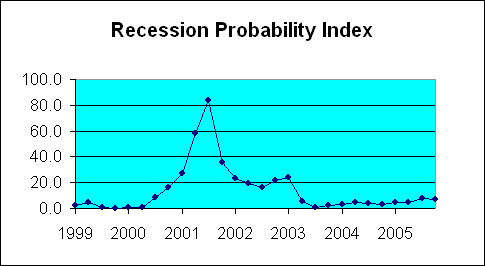
The expected strong 2006:Q1 GDP growth included encouraging numbers for investment and exports, and warranted a slight drop in the recession probability index.
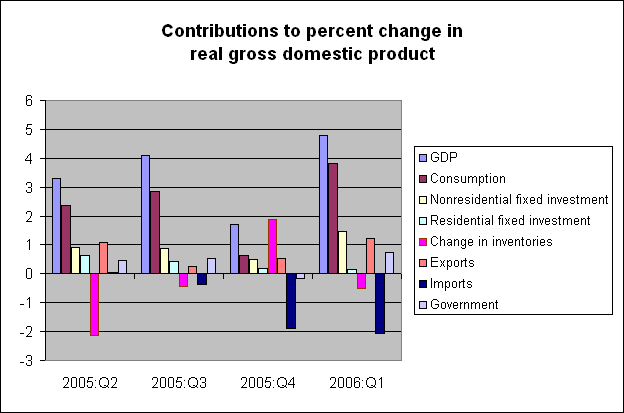
The Commerce Department announced today that U.S. real GDP grew at an annual rate of 4.8% in the first quarter of 2006. By any measure, this is a good performance. The average U.S. growth rate during quarters of economic expansion over the last sixty years has been 4.6%, and the average across all quarters (including economic recessions) has been 3.5%. The most recent 4.8% growth is a most welcome improvement over the 2005:Q4 growth of 1.7%.

Much of the seesaw between 2005:Q4 and 2006:Q1 came from autos, which contributed -1.9% to the 2005:Q4 total and +0.6% to 2006:Q1. Auto sales were not great, but even mediocre looks wonderful when compared with the dismal 2005:Q4 performance. Another measure is to compare the number of vehicles sold in the first 3 months of 2006 with the first 3 months of 2005, on which basis DaimlerChrysler was up 3.9%, Ford was down 2.8%, and GM was down 5.2%. We’ll see what $3 gasoline does to these numbers.
 >
>On the other hand, I was particularly encouraged by two key components of the first-quarter growth. Exports contributed 1.2% of the 2006:Q1 4.8% growth, more than double their 0.5% contribution of 2005:Q4, and enough to take a significant bite out of the -2% contribution of imports. Nonresidential investment also contributed 1.5% to 2006:Q1, triple its 0.5% contribution of the previous quarter. This component is the key to future growth, and sustainability requires higher investment spending and exports to replace some of the demand that’s currently coming from domestic consumption.
Overall, excellent news. But, like the current Fed Chair, I’ll be surprised if the next installment is as rosy.
Unlike the 1st quarter which came in slightly above expectations, the beginning of Q2 has been a little tough for auto sales.
Earthquake in China
In a much awaited move, the Chinese authorities managed to surprise the markets by raising their interbank rate 27 basis points to cool their overheated 10.2 % y/y growth in 06Q1. The usual centralized broadcast of orders to banks to
This FDIC report on “the next recession” has a nice chart that strongly suggests the weak Q4’05 GDP was a typical mid-business cycle pullback.
My guess is the second leg of the cycle won’t be very long–between 1 and 2 years.
I also think its time for supercycle effects to rear their ugly head (evidence: debt accumulation, housing bubble), and perhaps one-time effects like the decline of the dollar on the global stage.
Should be an interesting couple of years.
Is accelerated growth so great if it prevents the housing bubble from deflating nice and slow? I would think the bubble would deflate with less pain if growth was steady and moderately slow. I worry fast growth will prompt people to continue to over-consume. Then they may get surprised when interest rates go up further and their ARM or interest-only loan becomes impossible. I know it’s kind of perverse to hope for slower growth, but I really worry about housing given all the goofy loan arrangements out there. If it were just a matter of people choosing not to trade up because of labor uncertainty or slow wage growth, that’s fine, tough luck for them but it just means lack of change, rather than change in a negative direction. It seems awful nasty to surprise lots of people already in a home with foreclosures. Maybe I’m not seeing the forest for the trees, but the housing price problem still worries me. Am I off base?
There is some tendency to collate the 2Qs and look at the 6 month term to perhaps compensate for the outlier 05 Q4. The more I look at ‘durable goods’, I’m inclined to agree.
A glance at the consumption difference in the 2 quarters is enough to make me wonder what did happen in 05 Q4 to account for such a lousy showing. Some had supposed that there was a connection between slowing refi rates and that consumption, but the refi is even less attractive now and the consumption has reasserted itself. Is it the relatively wealthy who do not need to refi that accounts for this consumption?
Do we need to examine Table 2, the “durable goods”–the motor vehicles and parts which contributed ~1.5% of that 4.8% this quarter while last quarter it subtracted a similar amount to GDP growth? I did not hear any good news from Ford or GM this quarter that would substantiate these numbers, but maybe we need to look at Lexus and Mercedes. [Is it possible that the stats have different units — # of units (volume) for market share but final price tag for GDP purposes?] A look at Table 3 suggests that q4 was abnormally lean on motor vehicles and that may have constituted some ‘pentup’ demand that came unglued in q1 but that did not rescue Ford or GM from losing market share to Toyota.
I feel stymied by these stats. It is clear that consumption is the big difference from last quarter and hard to believe it was in the motor vehicle section.
Housing…housing…
If house prices fall 40% over the next few years, the difference would be made up over rental payments in 7 years. So hold.
If you try to sell and miss the top…$20,000 to move out, rent, $20,000 to move back in. plus the years (?) of lost equity buildup. And the chance of having to buy back in at a higher rate or watch your rent climb.
Trade at your peril.
The only catalyst for a housing drop is higher interest rates. M-3 money is growing at 8%. = inflation = $ goes down = assets (houses)go up. Read the inflation years of the 70-80’s. The phrase for real estate “geniuses” then was “inflation millionaires”.
Hedge higher interest rates with bond puts, currency hedges, interest rate trades, and keep your houses.
Calmo, a common pattern in an economic downturn is for consumer durables to fall a good deal while nondurables and services are fairly steady. When people are anxious or disposable income looks tight, durables are where they tend to cut back most.
When consumer confidence rebounded, durable spending at more normal levels makes the quarter-to-quarter growth rate look more impressive.
I am perhaps oversimplifying when I say 2005:Q4 was all autos– as you observed, there was also a big negative kick to durables generally (not just autos) in 2005:Q4, some of which was compensated by a big positive for inventory gain in 2005:Q4. My point was that, if you take inventories and durables other than autos (along with all the other GDP components) as given, but just didn’t have a drop in autos, the total 2005:Q4 GDP would have looked normal. This is more of an accounting statement than a fully fleshed-out economic model.
I believe that the energy shock was a key cause of that drop in durables generally, and I emphasized autos because that is where the action was most dramatic and where the tie to oil prices is most unambiguous. So, although the accounting statement is an oversimplification, I think it accurately focuses on the driving mechanism and gives a quick summary statistic to understand what was going on.
When people are anxious or disposable income looks tight, durables are where they tend to cut back most.
Thanks for your efforts to iron out my confusion JD which were initiated by your excellent bar graph showing what a miserable contribution ‘consumption’ made in q4 –a hole as it were (to steal from the charge transfer theory of electronics). But some wrinkles persist.
I recall looking at that disappointing result last quarter and agreeing with the view then, that this was a result of ‘sales brought forward’ from the previous quarter where GM actually gained market share for the first time in many quarters (due to record incentives which were not quite so heavily publicized). Consummers bought early and in q4, horror of horrors, saved (Is there a record of this upturn in savings or is it like those electron holes that due to the magic of financing ignore the tidy quarterly time frame?)[The impetus for smoothing some data just struck a chord.].
So examining the preliminary data for q1 does show this amazing turn around for durables and primarily in autos where apparently not everyone and his dog bought new in q3 last year (accounting for the hole in q4). The autos are made in q4 regardless of whether they are bought and that auto hole shows up as a significant gain in ‘inventory’. [This was one big wrinkle ironed out for me –thanks.]
When I try to confirm the recent auto data (not believing that the market is not saturated from previous incentives and a declining market of qualified buyers)[If the wealth gradient is getting steeper, there are fewer new car buyers, yes?], I can’t get no satisfaction (like Mick).
Instead I get this:
http://www.usatoday.com/money/autos/2006-04-03-car-sales-usat_x.htm?POE=MONISVA
The energy shock did not seem to affect consummers in q1 is what this report is telling me. The falling refi stats do not seem to affect consummers in q1 is also what this report is telling me. And my view is that the energy shock, unlike its marketing agent suggests, takes time. I sort of agree with this:
So, although the accounting statement is an oversimplification, I think it accurately focuses on the driving mechanism and gives a quick summary statistic to understand what was going on.
James,
Good work as always. I am not rosy on the Q1 numbers, especially after the productivity report.
I will weigh in Sunday on this in “The Song Remains The Same”….. and attempt to connect the dots.
We need to get the “Led” out…