Some complications
There has been a vigorous debate over the efficacy of a yuan revaluation; see Brad Setser’s or Dave Altig’s takes on the debate, and for links to other views. There is already an extant literature that attempts to estimate the effect of a revaluation. These include Marquez and Schindler as well as Willem Thorbecke. In each case, it is difficult for the authors to isolate conventional exchange rate-trade quantity elasticities for U.S.-China trade. In order to accomplish this goal, one has to first try to measure the bilateral flows. This post is a (kind of mundane) first step in that process.
At first glance, the question posed appears to have a simple answer: $19.575 billion in July of 2006. But in fact, the large degree of seasonality makes it hard to discern the underlying trend in the U.S.- China bilateral trade balance. In Figure 1, nominal imports from (blue) and exports to (red) China (in millions of U.S. dollars) are plotted. (I’ll ignore the issue of re-exports/attribution discussed by Schindler and Beckett.) The data reported by the BEA/Census are not seasonally, as is obvious from a quick visual inspection.
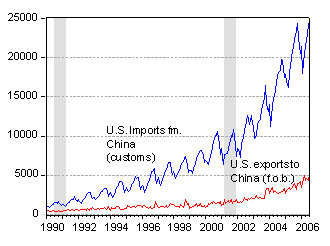
Figure 1: U.S. imports from China (blue) and U.S. exports to China (red). Source: BEA/Census via Haver.
In addition, the figures typically reported are nominal. In principal, one would want real quantities. Immediately, the researcher is confronted the constraint that there is no price index for U.S. exports to China available on-line, and the index for Chinese imports to the U.S. only goes back to December 2003. I approximate the former using the end-use capital goods export price index, and the non-industrial country manufactures import index for the latter. The resulting real import (blue) and export (green) series (December 2003 = 1.00) are presented in Figure 2.
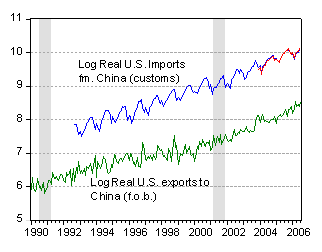
Figure 2: U.S. imports from China (blue, red) and U.S. exports to China (green), in December 2003 constant dollars. Deflated using non-industrial country manufacturing import price index, and Chinese-sourced imports price index for imports, and capital goods export price index for exports. Source: BEA/Census via Haver for trade flows, and BLS.
As a check, I use the reported China import price series to create the real import index (red). The close movements of the two series during the overlap suggests that at least during the recent period, the aggregate import index is not a bad proxy.
In order to generate a seasonally adjusted series, one encounters the additional problem that a big seasonal factor is not regularly placed in the calender — namely the Lunar New Year, which sometimes falls in January, sometimes in February. In order to account for this, I use a monthly dummy to absorb the Lunar New Year effect, before applying the Census X-12 seasonal adjustment procedure, using additive factors (on the log real series). This produces a log real seasonally adjusted series for imports (the U.S. export to China series does not exhibit obvious seasonality).
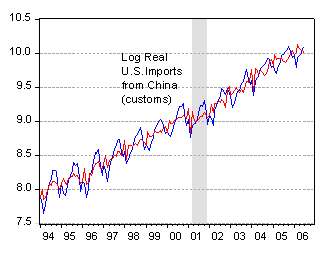
Figure 3: U.S. log real imports from China (blue) in December 2003 constant dollars. Seasonal adjustment accomplished via regression on a centered Lunar New Year dummy and then processed using the X-12 routine (red). Source: BEA/Census via Haver for trade flows, BLS, and author’s calculations.
The adjusted series has not had all the seasonality removed, but does exhibit less variability. Using these figures, I calculate the real trade balance.
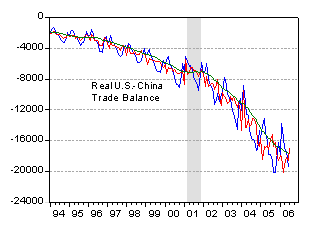
Figure 4: U.S.-China real trade balance (blue), seasonally adjusted trade balance (red), and trade balance calculated using 12-month moving averages (green). Source: BEA/Census via Haver, BLS, and author’s calculations.
According to these estimates, the real U.S.-China trade deficit is -$19.1 billion using the unadjusted series, -$17.8 using the 12 month lagging moving average. Using the seasonally adjusted series, the trade deficit is -$16.9. Perhaps more important than the actual level of the deficit is the fact that the direction of the series are different; both the unadjusted and moving average series are moving downward, while the seasonally adjusted series is moving upward. But given the preliminary nature of the estimates, I wouldn’t stress this last point overmuch. Finally, it is useful to place matters in context: in Figure 5 the nominal trade series normalized by nominal GDP is presented. In addition, the total U.S. trade deficit is also displayed.
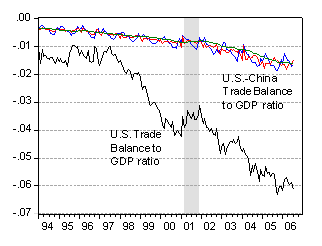
Figure 5: U.S.-China trade balance to GDP ratio (blue), seasonally adjusted trade balance (red), and trade balance calculated using 12-month moving averages (green), and U.S. total trade deficit (black). Source: BEA/Census via Haver, BLS, and author’s calculations. Monthly nominal GDP interpolated using quadratic match procedure. July GDP growth assumes 3.8% annualized growth rate from June.
This figure clearly demonstrates that stabilization appears to be occurring in both the bilateral and multilateral trade deficit. But of course, trends can change.
Late Addition: 9/15 12:50pm Pacific
Dave Schuler has requested an analogous picture, with the trade balance normalized by Chinese GDP. I am happy to oblige, with the caveat that the calculation could be made in any number of ways, and that Chinese GDP exhibits as much, or even more, seasonality than U.S. imports from China. I have opted to use the interpolated data on Chinese nominal GDP reported in dollar terms from the IMF’s World Economic Outlook Sept. 2006 database released yesterday.
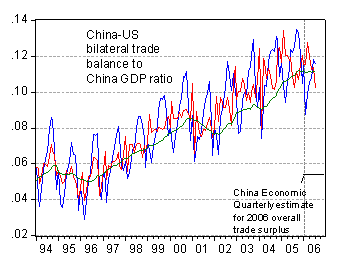
Figure 6: China-U.S. trade balance to Chinese GDP ratio (blue), seasonally adjusted trade balance (red), and trade balance calculated using 12-month moving averages (green), and CEQ estimate for 2006 Chinese overall trade balance to GDP ratio. Source: BEA/Census via Haver, BLS, IMF’s World Economic Outlook Sept. 2006 database, China Economic Quarterly 2006q3, and author’s calculations. Monthly nominal GDP interpolated using quadratic match procedure.
I have included the China Economic Quarterly‘s 2006q3 estimate for 2006 average overall trade balance to GDP ratio, to remind readers that for many purposes, a country’s global trade balance is of key interest.
Technorati Tags: trade deficit,
China,
Renminbi, and
seasonal adjustment
From Nominal to Meaningful: U.S.-China Edition
Menzie Chinn has a very interesting research mini-project going on at Econbrowser: Measuring the U.S.-China trade balance I wish we could see more of this and less moralizing about distributive justice. Chinn is looking at trade flows between the US an…
not sure i see stabilization in either the broad or the bilateral trade deficit yet, but there has been a clear slowdown in the pace of deterioration in both (and notably the pace of deterioration vis a vis China. export growth to china is up, import growth down — but i am not yet convinced that the surge in us exports in h1 wasn’t somewhat linked to Hu’s trip/ big boeing shipments. keeping the growth rate up off the now much higher base = a challenge.
Looking at the broad trade deficit — you certainly can argue that it has stabilized at around 6% of GDP. But I also think if you look at the changes since say the end of 2004, you can tell two stories. One is stable, a jump down (end 04), and more stability …
Another is more of a trend deterioration, with a big jump down in q4 05 pushing the deficit down below the trend line and a bounce back in q1 06 … at this stage, I am not sure which is the right interpretation.
One question — it has long seemed to me — based on just eyeballing the data — that there is a bit of seasonality in the seasonally adjusted us data, with q1 tending to be a bit better than one would expect … i.e. the seasonal adjustment used seems to lag the seasonal adjustment needed to take out the impact of the Chinese new year/ US holiday season. Have you ever happened to look at that question?
Brad Setser: Thanks for the as-usual excellent insights. Stabilization is indeed in the eye of the beholder. On the more narrow issue question regarding remaining seasonality in the seasonal adjusted series created in this analysis, my answer is some seasonality seems to remain (that’s why I have that caveat in between Figures 3 and 4). Certainly, more can (and will) be done. I have tried (i) averaging over January/February; (ii) a centered equal-weight dummy for the three month period in which the Lunar New Year takes place; and (iii) a centered triangular-weighted dummy for the Lunar New Year. The simple monthly dummy with X-12 run on the residual series has so far worked the best, but my analysis is not exhaustive.
Menzie — You are too kind. Looking back at my poorly written and poorly punctuated comments, I am impressed that you were able to decipher them …
Thanks for the information on seasonality.
A figure similar to Figure 5 showing the Chinese GDP and Chinese trade balance to GDP ratio would be very interesting.
Dave Schuler: Done – see Figure 6.
Thank you, Menzie. Honestly, it’s flatter than I thought it would be.