The Treasury Department reported a steady rate of purchases of Treasuries by foreigners (see the Bloomberg account here). Let’s hope that continues — although we should be cognizant of the ramifications: increasing debt and interest payments to foreigners.
In the old days (i.e., during the Reagan deficits), macroeconomists often argued that the burden of the national debt, and the associated interest payments, was somewhat mitigated to the extent that we owed the debt to ourselves. In other words, the national debt was largely an intergenerational transfer.
Well, to quote one of Jim Hamilton’s favorite artists, “The times they are a-changin’…”. As shown in Figure 1, the massive debt incurred over the last six years, combined with rising interest rates, has led to increasing Federal interest payments to GDP ratio. Furthermore, as illustrated in Figure 2, a larger portion of those interest payments — roughly half — are now to foreigners. Hence, we are now in the process of conducting a massive inter-national transfer on top of an intergenerational one.
Figure 1: Yield on 10 year constant maturity Treasurys (average of daily data), and Federal interest payments as a share of nominal GDP. Source: FRED II and BEA NIPA, December 2006 release.
Figure 2: Total Federal interest payments and interest payments to foreign holders, in billions of dollars, SAAR. Source: BEA NIPA, December 2006 release.
Looking more broadly at what U.S. residents (so not just the U.S. Government) will have to pay on net, what does the future hold? Maybe continued valuation effects will cushion the U.S. economy from sharp adjustments. Or maybe not. In an updated, alternate version of his Sharecropper’s paper, John Kitchen posits a number of future paths for U.S. net income payments. Most are pretty benign; some (associated with some admittedly unlikely scenarios) not so benign.
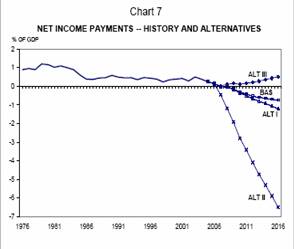
Figure 3: Net income payments as a share of GDP, under a variety of assumptions. Source: Kitchen (2006).
[Brad Setser has has some caveats regarding the TIC data.].
Technorati Tags: net income payments,
interest payments,
national debt,
valuation effects
The slight decline in interest rates over the latter part of 2006 led is a small absolute decline in interest payments for 1Q of FY2007 compared to FY2006. See here.
In about a week we’ll get the latest CBO estimates.
Professor Chinn, I’m a little interested in the difference in the raw numbers between the BEA NIPA data and the CBO data for the Federal Interest Payments on the Public Debt. CBO Data gives the Net Interest on the Public Debt as $Billion 168, 191, and 237 for FY 2004, ’05, and ’06, certainly smaller than the BEA NIPA numbers above, though not disagreeing with the general trendlines. Are they counting something slightly different?
John Thacker: These NIPA figures are not net, but gross, interest payments. I suspect (but do not know for certain) the difference would then arise because of the consolidation of government accounts (trust funds, etc.) to generate net payments. Regarding the decline in FY07 quarter one interest payments relative to FY06 Q1 payments, note there was a spike upward in that quarter. It would probably be better to compare a 4 quarter moving average.
Wouldn’t this be a particularly appropriate instance to normalize the data streams against national income, not GDP? GDP essentially includes the foreign borrowings; so the more being borrowed from abroad, the larger the denominator — largely cancelling out the resulting interest payments to abroad.
By the way, I never bought the “we’re paying the interest to ourselves” argument. That situation isn’t so different from what we have today — as we’ve seen, when foreigners are left with a surplus of dollars, they just end up coming back here getting parked in marginal financial assets.
Either way, the result is malinvestment into these marginal assets. Of late, this malinvestment has mostly been into government securities and mortgage securities, leading to excessive and profligate government spending and a housing bubble.
When the government takes on large quantities of debt, it is almost always a bad thing, because government is effectively expanding. As Milton Friedman said, the size of government is the size of its spending, not the incidental size of present taxation.
Billionaire Buffet’s “sharecroppers” view hits my funny bone or the one next to it. Is it the case that one is either a sharecropper or the benefactor (sharecroppee?) of the sharecropper? Does Roach view the rest of the imbalanced world as sharecropper for the US?
About those tbills, between China and Japan it looks like close to no new purchases last month and I wonder how long London and the Carib can keep pitch-hitting for them (time to go for a Setser Lurk). The general trade pattern of China->US seems to be shifting to China->Europe where I suppose the european garages are not nearly as stuffed as the US garages. So an improving US trade balance picture as housing and consumers cool, but along with that, pressure on long rates as tbills look for new buyers?
It’s hard to believe that debt servicing charges on the growing international debt will remain manageable with continuing or declining interest rates.
Aaron K,
What means “marginal” in the context in which you use it? I read both instances with and without “marginal” and get the same meaning, so think I must be missing something.
Foreign debt has been a blessing to the US since Alexander Hamilton restored the credit of our nation in 1790. In 1790 our total percentage of debt to GDP was around 1.24% and the foreign component was about .30%. If foreign debt is properly understood it is the rest of the world financing US production. Foreign debt is a benefit. It indicates that the economy of the US is healthy. If the US was not a good investment the foreign money would go somewhere else. Hamilton understood this, but today many have forgotten it.
Dick, you might be interested in some of the comments we made about that issue here.
JDH,
Thanks for the link. I have had a chance to read your article but not the responses yet. More comments later.
Regarding the decline in FY07 quarter one interest payments relative to FY06 Q1 payments, note there was a spike upward in that quarter. It would probably be better to compare a 4 quarter moving average.
Fair enough. At the same time, with both declining interest rates, a lower rate of inflation due to the decrease in energy prices recently (there are several inflation-linked securities in the debt), and a relatively small deficit relative to GDP and GDP growth for FY2006 (1.9% of GDP), it’s reasonable to think that interest payments as a share of GDP will not grow for this fiscal year.
The big problem, of course, is long term growth of Social Security and especially Medicare.
DickF If indeed capital flows to the United States signals the high productivity and profitability of the U.S. economy, why is such a large component of those capital flows coming from central banks, monetary authorities, and state-owned enterprises?
John Thacker: Deutsche Bank (which I’ll take as proxy for private sector consensus) as of 1/19 places 2 year and 10 year Treasuries in Q3 2007 at 4.7% and 4.9% (versus 4.7 and 4.7 in Q4 2006), a slight rise. Since TIPS only accounts for less than 10% of total debt outstanding ($413 bn of $4367 bn outstanding, November statistics from Bureau of Debt statistics), I don’t think the inflation effect on TIPS yields will be dominant.
By the way, in August, CBO projected 2.1 ppt of GDP deficit for FY2007, but the debt-to-GDP ratio was projected to increase from 37.0 ppt to 37.3 ppt. So, with constant or slightly rising interest rates, and a rising debt-to-GDP ratio, I can see rising interest payments as a plausible outcome.
Deutsche Bank (which I’ll take as proxy for private sector consensus) as of 1/19 places 2 year and 10 year Treasuries in Q3 2007 at 4.7% and 4.9%
By the way, in August, CBO projected 2.1 ppt of GDP deficit for FY2007, but the debt-to-GDP ratio was projected to increase from 37.0 ppt to 37.3 ppt.
However, in that August CBO projection the prediction 10 year Treasury rate for 2006 was 5.1% and for 2007 5.4%, higher than what current predictions by Deutsche Bank are, yes?
And in August the CBO projected a deficit of $260 billion, or 2.0% of GDP for FY2006, which in November became an actual $248 billion, or 1.9% of GDP for FY2006.
And August was before the budget bills had been adopted as continuing resolutions, below the original CBO projections of increases in line with inflation to discretionary spending. (Of course, the new Congress could still adopt increased appropriations so that the total appropriations increase at the rate of inflation.)
So those sound to me like a couple of reasons why the projections may well have improved since that August report.
As I mentioned, the update to the August report comes out tomorrow at 10 am, so we can take a look.
Also, I belive that those debt to GDP ratios are given for the end of a fiscal year. In which case it might well be more relevant to note that while the debt to GDP ratio was 37.4% at the end of FY 2005, it was predicted in August to be smaller, 37.0% at the end of FY 2006, and then 37.3% at the end of FY 2007. (And, as we know, the debt was actually .1% of GDP less as of November than the CBO was predicting that it would be in August.)
So, then, are the interest payments likely to be smaller or larger in a year where the debt to GDP ratio starts at 37.4% and ends at 37.0%, or a year where it starts at 36.9% and ends at 37.2%?
Or am I looking at the numbers incorrectly? Please let me know.
Well, it’s out.
And indeed, if you look at page 26 of the projections, net interest payments on the debt are projected to hold steady at 1.7% of GDP for the next four years as the debt-to-GDP percentage declines. (After that they drop, but I refuse to consider the exact details of the deficit past that, since it depends on expiring tax law changes thanks to the Byrd Rule.)
I forgot to mention one more reason that the projections would look better– the calculations in August assumed increases in discretionary spending in line with inflation, but the baseline used included disaster spending for Katrina. If you take away that spending and recalculate, it improves.
Anyway, debt held by the public is now forcast to decline to 36.6% at the end of FY07, 35.7% at FY08, and 34.8% for FY09, with the deficit at 1.3%, 0.9%, and 0.8% in each year respectively. Of course there could be more Iraq spending or otherwise.
Of course, this depends on a lot of economic assumptions as well. The CBO is assuming that economic growth slows this year and rebounds the next, and that short term Treasury rates decline slightly, apparently– though they give a rate of 4.9% for 2 year T-bills at the end of 4Q06.
John Thacker:
Thanks for the input. I have the highest regard for the CBO’s staff and their output. This regard is especially high as I had a chance to observe closely the process of generating the projections in mid-2005 as a Visiting Fellow. It is important to recall that these projections incorporate “current law”. Hence, the staff does not incorporate likely fiscal outcomes, but what occurs under current law. This point is germane to two issues that work to make the likely expenditures for FY 2007 higher (just like what occured last year). I have in mind the rumored block-buster $100 billion supplemental for GWOT/OIF expenditures. From the CBO update (summary):
The second point is the increase in the overall level of defense spending, in order to accomodate a larger Army. So you’ll excuse me if I’m skeptical of the 1.3 ppt of deficit-to-GDP figure.
So you’ll excuse me if I’m skeptical of the 1.3 ppt of deficit-to-GDP figure.
Of course, I’m skeptical too and that exact figure is almost certainly wrong. The report itself certainly estimates that, yes, about an extra $25 billion should be added (bringing the military authorizations from ~$70billion to ~$95billion), and that the deficit will probably be around $200billion and 1.5% of GDP instead of 1.3%.
But surely you were skeptical of the August numbers for reasons going in the other direction; i.e., the Katrina spending? And certainly you knew that you couldn’t reference the August projections now without taking into account that the continuing resolutions held spending below the baseline level that had been projected (by law) by the CBO in August?
Even the 1.5% number with a $95-100billion appropriations is considerably smaller than what was predicted in August, no?
Still, there are quite a few other factors. The new Congress may well decide to extend the AMT relief that expired on December 31, 2006, for example, without making up that revenue elsewhere. It may also decide to increase appropriations in other ways. Various tax credits could be extended, the economy could behave in different ways, all sorts of things. There are lots of reasons why not to trust the projections past a few years, except for perhaps the mandatory spending.
However, the difference between 1.3% and 1.5% deficit to GDP ratio is smaller than than the difference between 1.5% and the original August projections of 2.1%. Even with adjustments in military expenditures, the proportion of GDP given to interest payments should not rise much, if at all. After all, even the original August projections, with much worse looking data on both interest rates and the deficit, had the net interest rising to only 1.8% of GDP for FY2007 and 1.9% in FY08 and 09 before falling after that. So even with a 1.5% deficit we’re still looking at interest payments around 1.7% of GDP, nearly the same as FY06.
And hence your title seems to me to be a bit inaccurate at this point. “Federal Government Interest Payments Have Risen,” perhaps would be a bit more accurate, at least in terms of ratio to GDP.
John Thacker: To be honest, I’m not certain how to reconcile the extra $25 billion cited by CBO with the recent comments by OMB Director Bolten alluding to a $100 billion supplemental on top of the previous $70 billion supplemental earlier on in the FY2007 period. (In other words, I’m not certain if that number is a pre-surge announcement number or not; see discussion here).
Some elaboration on why the “improvement” in the current law CBO projection — from the Center for Budget and Policy Priorities: