The interesting aspects of the survey of forecasts conducted by the Wall Street Journal (data here) are not in the means (or medians), but in the tails.
First, it’s of interest to note that forecasts of 2007Q4 growth have been revised downward over time.
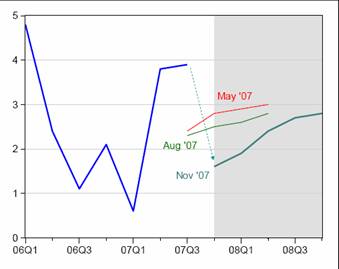
Figure 1: Actual growth, SAAR(blue) and average of forecasts of growth from May 2007 (red), August (green) and November (teal). Source: Wall Street Journal, November 15.
However, I think the most interesting aspects of the data are not in the mesures of central tendency, but rather in the dispersion of forecasts.
Figure 2: Histogram of 2007Q4 growth forecasts. Source: Wall Street Journal, November 15.
This histogram of the forecasts for 2007Q4 illustrates the lows (0% growth from Paul Ashworth of Capital Economics) to 3.7% (James F. Smith of Western Carolina University and Parsec Financial Management). The summary statistics indicate that the distribution is not Normal, as shown by the Jarque-Bera statistic; rather the distibution is particularly leptokurtic (fat-tailed).
The distribution becomes much more Normal in the subsequent quarters; Figure 3 illustrates this fact. I think this reflects reversion to (trend) mean growth rates in the forecasts.
Figure 3: Histogram of 2008Q1 growth forecasts. Source: Wall Street Journal, November 15.
Returning to the 2007Q4 forecasts, another interesting aspect of this distribution is that there seems to be a dichotomy between forecasters associated with investment banks, other financial services firms, or trade association, versus university and consulting firms with an econometric modeling component (e.g., firms that absorbed DRI, WEFA, etc., or are known for their models, such as Macroeconomic Advisers).
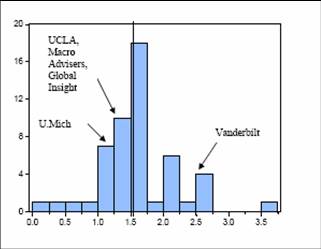
Figure 4: Histogram of 2007Q4 growth forecasts. Source: Wall Street Journal, November 15.
As shown in Figure 4, RSQE at University of Michigan and Leamer at UCLA are on the left side of the distribution (along with Global Insight and Macro Advisers). On the right side is Daane at Vanderbilt U.; the only other forecaster in this category is Allen Sinai of Decision Economics (at 1.6%, just slightly over the mean).
Coding university and non-financial sector econometric-oriented forecasters with a dummy variable, I find using a cross-section regression (n=52) that these forecasters forecast a slower growth rate — by 0.19 percentage points. The difference is statistically significant at the 5% MSL using White heteroskedasticity robust standard errors. (I coded the following as dummy=1: Capital Economics, Global Insight, Vanderbilt U., U. Mich., UCLA, Moody’s, Macroeconomic Advisers, High Frequency Economics, Decision Economics, Standard and Poors).
What about recession probabilities. As one might anticipate, the average growth rate forecasted for the 07Q4-08Q3 period is highly (negatively) correlated (adjusted R-squared = 0.39).
Figure 5: Scatterplot of average growth over 07Q4-08Q3 against probabilty of recession; Nearest Neighbor Fit, bandwidth = 0.3, Tricube weighting. Source: Wall Street Journal, November 15, and author’s calculations.
Interestingly, there does not seem to be a correlation between forecaster affiliation and recession probability — at least not a statistically significant one. The difference is about 3 percentage points. (And note that there are a lot of forecasts with very low growth rates from investment banks (e.g., Merrill Lynch at 0.7% in 07Q4.)
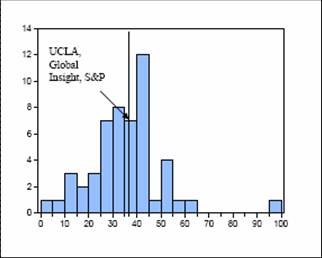
Figure 6: Histogram of recession probabilies. Source: Wall Street Journal, November 15.
It’s important to recognize that the analysis here is really a “snapshot”, at what might very well be a turning point in the business cycle. It’s unclear whether the attributes that have been highlighted persist over the business cycle. In other words, I don’t know if the result:
Batchelor and Dua (1990) do find that some forecasters seek to distinguish their forecasts from each other, taking a position of optimist or pessimist within a panel of forecasters, although the magnitude of this effect is very small relative to noise present in the forecasts.
holds (quote from Gregory and Yetman (International Journal of Forecasting, 2004))). I’m also not addressing a series of other questions highlighted by Batchelor (2007). Eisenbeis, Waggoner and Zha (Business Economics, 2002) discuss some of the attributes of forecasters in the WSJ survey, over time.
One last point to remember when examining the consensus forecasts from this survey: the survey was conducted before Friday’s data releases on the CPI and industrial production.
Technorati Tags: href=”http://www.technorati.com/tags/forecasts”>forecasts,
GDP,
recession.
Glad to see that the herd of economists can get things moving in the right direction — down — when the data comes in weak.
Reminds me of a saying from my Navy days: “Knows right answer when told.”
I think that the economists are still too optimistic. Look at how bad corporate earnings have come in; S&P 500 Q3 07 operating earnings are 8% below one year ago:
http://www2.standardandpoors.com/spf/xls/index/SP500EPSEST.XLS (column C)
And, reflecting the full-brunt of GM’s nearly $40B write-off, as reported earnings are horrendous, off 28% (column D).
Broader view on earnings: http://online.wsj.com/mdc/public/page/2_3024-industryearn.html
I expect that the economists will continue moving their numbers south, as the reported numbers on the economy continue moving south.
Given your interest in forecasting, you might find of interest the review of Philip Tetlock’s recent book, “Expert Political Judgement: How Good is it? How do we know?” Tetlock deals with more than political forecasting, as does the review.
http://repository.upenn.edu/cgi/viewcontent.cgi?article=1056&context=marketing_papers
In my experience of bank forecasters (I work alongside them), there’s a premium placed on “having a view”, that is, having a view different than the herd… i’d expect fat tails in the forecasts. It doesn’t seem much to matter what that view is… I’ve seen very little accountability in bank forecasts. Forecasters are usually treated like entertainers… every bank has to have them but they are not taken seriously.
D-Slam: I know that this is a popular view of forecasters, and you’ll see that this is somewhat verified by the statistical evidence summarized in some of the articles linked to in the post. On the other hand, there is an equally popular view that forecasters herd because there is “safety in numbers”. So we have a series of influences that offset each other to an unknown degree. I also am curious about how these forecasts get distributed throughout organizations, even if in casual conversation, the forecasters are dismissed as entertainers.
On April 4, 2007 Van Schaik’s Economic Outlook said a recession was a “…high probability rather than a mere possibility.” A little early, perhaps, but one must be a bit early with a forecast if it is intended to be of any value. We are just as bearish now as we were then on the economy and stocks. We are still calling for a 24+ month recession.
Is the “fat belly” of the Q4 distribution likely to result from having inputs for a bottom-up forecast in hand? We already have a fair estimate of PCE for Q3, and for September, so we know the starting point for Q4. We have similar information for inventories, the magnitude of which in Q3 makes a difference for inventories’ impact on Q4 GDP. Wouldn’t that greater certainty about the outcome lead to a fat belly for the distribution of estimates?
An interesting post, not least because until I read it I didn’t appreciate my Q4 forecast was the most bearish in the latest WSJ poll.
I certainly wouldn’t have expected to be at the bottom of the pack. I’m quite surprised by it actually.
I agree with a previous post that forecasters do have an incentive to stand out from the crowd. But having said that our latest forecast of stagnant GDP in Q4 is based solely on the outlook as we see it – there’s no grandstanding behind it. (For instance in the previous October poll our 3% Q3 call was well above the median.) Surging energy prices are going to have a big impact on real incomes and consumption over the final two months of Q4. Residential investment is collapsing. The anecdotal evidence suggests that non-residential structures investment has peaked. In addition, inventories and military spending, which added a lot to Q3, are likely to subtract from growth in Q4. All things considered, I’d say the risks to our 0% forecast are actually stacked on the downside.
As for the forecasting process, we do indeed use a full econometric model. But I’m not sure whether that adds much value for forecasting over very short time horizions. I think everyone uses more of a bottom-up approach as far as the current quarter is concerned. Model-based forecasters just adjust the equation residuals to get the answer they want for the very short term and then use the model as a medium-term guide. So I’m not convinced there is much of a practical difference in approaches for 2007 Q4.
Thinking about the fat-tails of the distribution for Q4 specifically – that’s not surprising as no-one knows for sure what impact the credit crunch is going to have. The elevated uncertainty surely explains why Q4 forecasts are very spread out. It would be interesting to see whether the Q4 forecast distribution has fatter tails than in previous quarters.
Q4 is being revised downward, but why do you conspicuously fail to mention that Q307 willbe revised UPWARD to 4.8%?
That is as much the other side of the coin here as the coin you did mention.
The new Fed forecasting transparency should clear all this up. One forecast, out ’til 2010, must be right, eh?
Seems like a no-win, why would the Fed add the risk of being wrong with your forecast to all the other political pressure they’re under? Makes no sense, Barney Frank, Ron Paul et al will be screaming at them when they’re off.
Paul A.: Thanks for the thoughtful remarks. I was actually using university-affiliated and model-oriented forecasters as a shorthand for institutions relatively far removed from the financial institions (e.g. away from Wall-Street-think).
GK: I guess I could mention the few instances of people guessing that 2007Q3 growth will be revised higher — but to what point? The forecasters projecting slower growth in 07Q4 can count the (international trade) beans just like everybody else. So, the only point of noting the likely upward revision is to highlight how far the fall is anticipated to be.
VennData: The same argument could be posed in the case of all political (and business) institutions. But I think academic thinking has come around to the view that having more information out there reduces the likelihood of big “surprises” and counterproductive Fed-watching. But for an informed view, see Jim’s post on the subject.