In a previous post on China’s currency, I focused on the implications of the ADB’s report on the new ICP analysis of PPP-based GDPs for misalignment estimates for China. Now, it’s time to look a bit more closely at why the data revision occurred.
From the World Bank’s Backgrounder FAQs [pdf] on the ICP:
What are the major findings of this study?…
China participated in the survey program for the first time ever and India for the first time since 1985. This results in more statistically reliable estimates of the size and price levels of both economies. The previous, less reliable, methods led to an overestimation of their GDPs by 40 percent. China still ranks as the world’s second largest economy with around 10 percent of world production and India is the fifth largest with over 4 percent of the world total.…
Why did PPP-based estimates of China’s GDP drop by 40 percent?
This is the first time China participated in the ICP. Previous estimates were extrapolated from a bilateral comparison of 1986 prices between China and the US. The extrapolations failed to take into account the change in structure and increase in prices over time.
Are China’s PPPs biased because they only furnished prices for 11 administrative areas?
If the national average prices based on these 11 cities are not fully representative of the rest of China, then there may be
some bias. Simulations suggest that the bias for GDP is not likely to be more than five percent.
And here are some answers to questions I’ve had over the years:
Why do the PPP data differ from the data in the World Development Indicators?
The data in World Development Indicators are based on previous benchmark surveys. For developing countries, where benchmark data existed, they are based on the previous ICP round in 1993 and are quite out of date. For countries with no previous benchmark, data were imputed. So it is not surprising that there will be some changes with the introduction of new and better data. The biggest change is for China which has participated in the ICP for the first time.
How do they differ from what has been in the Penn World Tables?
The Penn World Tables have been based on older benchmark data. There are also differences in methodology that causes notable differences. As a result, they cannot be compared directly to the new ICP data.
Why do the GDP, population, and exchange rate data in the report differ from those published in the World Development
Indicators?
The data for GDP, population, and exchange rates were provided by national sources. For a few countries they differ from the data published by international agencies such as the World Bank because of differences in vintage or statistical methods. When the ICP results are published in the World Development Indicators, they will be made consistent with other indicators in the WDI database.
Now, let’s return to the policy implications. From the NYT on the 21st:
The World Bank cautioned that it did not calculate its figures as a guide to currency values. But the new figures somewhat strengthen China’s contention that its currency, the yuan, is not seriously undervalued and does not need to be allowed to rise sharply against Western currencies.
Jeffrey Frankel, the James W. Harpel professor of capital formation and growth at Harvard, has been one of the most outspoken advocates of yuan appreciation. He has cited the World Bank’s previous purchasing-power calculations to justify his position.
Professor Frankel acknowledged in a telephone interview on Thursday that the new World Bank figures badly damaged that argument. “I would have to retract that based on these latest numbers,” he said.
But Professor Frankel said that many other economic indicators showed that the yuan was undervalued and should be allowed to rise.
He cited China’s huge and growing trade surplus, its ever-rising foreign exchange reserves, market speculation on a further appreciation of the yuan — it has already risen 5.9 percent this year — and signs that the Chinese economy might be overheating as exports soared.
Some economists, including the former head of the China division at the International Monetary Fund, question whether the World Bank has now gone too far in the other direction and overstated prices in China. While describing the estimates as an important step toward making international comparisons of economies, they point out that the bank looked mainly at affluent Chinese cities in coastal provinces with big export industries.
While I concur that the data revisions do damage the case that the CNY is undervalued, I feel the damage is less than some others might argue. That is, in the various papers by myself, Yin-Wong Cheung and Eiji Fujii, we have argued that given the uncertainty surrounding the strength of the real exchange rate/per capita income relationship, we cannot reject the null of no misalignment at conventional levels. Now, it is even more the case that that assertion holds. But we still cannot reject the null hypothesis that the CNY is undervalued, exactly because we know there is (substantial) uncertainty in the world. (Note that our standard error bands do not take into account uncertainty regarding the model specification, or measurement error in the right hand side variable.)
And Frankel is exactly correct to stress other indicators of misalignment. In other words, the PPP-income criterion is only one of many ways of identifying a currency misalignment (and it’s a long run one). Other more relevant ones still tend to indicate undervaluation. However, my central proviso still holds — keep in mind the uncertainty surrounding the estimates when making conclusions. In other words, a little humility about how much one thinks he knows can’t hurt… In that spirit, I recap the figure implied by the latest ICP revision.
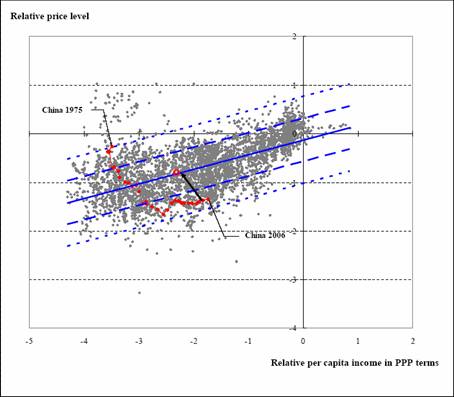
Figure 1: Log price level and log relative per capita income in PPP terms, and regression line (blue solid) with +/- one (long dashed) and two (short dashed) standard error prediction interval. Red line is China’s path according to 2007 vintage of WDI (2006 observation from IMF WEO). Circle is the ICP-implied location of the Chinese observation for 2005. Source: Cheung, Chinn and Fujii (2007), ADB, and author’s calculations.
Technorati Tags: misalignment,
undervaluation,
China,
Renminbi, Chinese yuan,
purchasing power parity,
World Bank
When data points have to be imputed, statisticians usually qualify these with some kind of standard error (or generate a series of “plausible values”) e.g. Rubin (or as in your post, the measurement error in the RHS variable). I suspect that had the uncertainty around the imputed values been incorporated into the estimates of GDP we may not have had to revise our expectations of overvaluation/undervaluation by as much.