The BEA released the end-2007 International Investment Position data on June 27.
Several observations:
- As in recent years, the NIIP to GDP ratio continues to deteriorate.
- However, the NIIP to GDP ratio as of end-2007 is improved relative to the originally reported end-2006 NIIP/GDP ratio.
- In the last year, the dollar change in the NIIP deviates substantially (i.e., is more positive) than the corresponding current account reported on a NIPA basis. This repeats the pattern from the previous five years.
- Interestingly, 2005 stands out by far as an outlier, wherein the the NIIP improves while the CA is in substantial deficit.
- There appears to be a measurable correlation between dollar depreciation against other major currencies and the deviation between change in NIIP and CA.
The first two observations are illustrated in Figure 1.
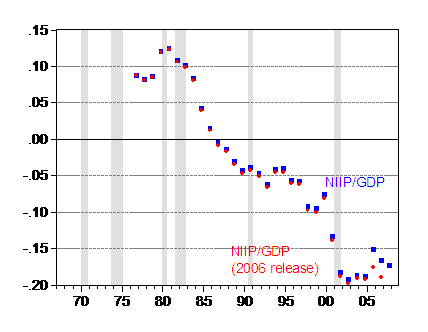
Figure 1: Net international investment position to GDP ratio, 2007 release (blue), and 2006 release (red), all calculated using June 2008 GDP release. NBER defined recessions shaded gray. Sources: BEA, International Investment Position, 2007 and 2006 releases; BEA GDP release of 26 June 2008; NBER.
The second two observations are illustrated by Figure 2.
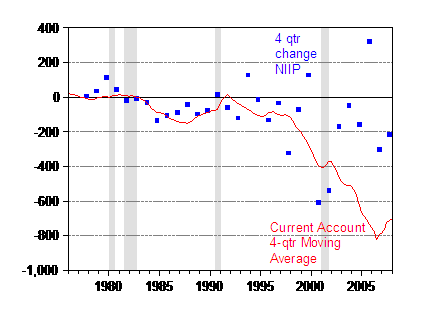
Figure 2: Year on year change in net international investment position, 2007 release (blue), and 4 quarter moving average of SAAR current account (red). NBER defined recessions shaded gray. Sources: BEA, International Investment Position, 2007; BEA GDP release of 26 June 2008; NBER.
The last observation is illustrated by the scatterplot in Figure 3, applying to data over the 1992-07 period.
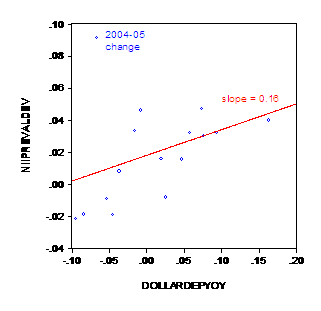
Figure 3: Deviation between the change in NIIP and the corresponding current account, all normalized by GDP (vertical axis) and year-on-year depreciation of the dollar against a narrow basket of major currencies (Fed index), calculated in log terms. Simple OLSregression line in red. Sources: BEA, International Investment Position, 2007 release; BEA GDP release of 26 June 2008; FRED II; NBER.
While the regression coefficient is not significant, allowing for a dummy for the anomalous 2005 observation (Brad Setser‘s decomposition attributes this effect to mostly market valuation changes, if I read his graph correctly), one finds that each 10% depreciation in the dollar against a basket of major currencies induces a 2.5% increase in the gap between the NIIP change and the current account (all expressed as a ratio of GDP). Specifically:
dev = 0.01 + 0.25dep + 0.097dum05
Adj-R2 = 0.68, SER = 0.017, N=16, all coeffs sig at 5% msl.
Should the dollar appreciate in 2008 against other major currencies, then one should expect the valuation effect to be reversed. A cessation of dollar depreciation will mean on average the gap between the change in NIIP and the CA (as a share of GDP) will be only 1%. (Another point I’ve highlighted is that the cumulative current account and NIIP converge during recessions — see “Can Gravity Be Defied?”.
One interesting point highlighted in Frank Warnock, et al.’s paper, presented at the UW-Madison conference on current account sustainability a couple months ago is that it is difficult to rely upon some dark matter explanation for the differential rates of return on US owned assets abroad versus foreign owned assets in the US. Rather, previous studies have mismeasured the stocks of assets, and mismatched flows to stocks, imparting substantial measurement error to rates of return.
In an extensive forensic analysis indicates Warnock et al. conclude:
In this paper we provided a brief summary of some of the theories of U.S. current account
sustainability and viewed them through the lens of the relative reliability of various items in the
international accounts. From the perspective of relative reliability, the dark matter view fails, as it rests on
an assumption that income streams are the most accurate items in the entire set of international accounts.
Given that the bulk of income streams are themselves estimates based on other items in the accounts, this
assumption is false. The exorbitant privilege view also fails. In its original form it rested on the
assumptions that the current vintage of revised positions and flows form a consistent dataset and that all
“other adjustments” are best thought of as valuation adjustments. In this paper we show that this is not
true, in part by calculating “other adjustments” by asset class and filling some known holes in the
international accounts. The set of accounts we produce by doing so are entirely consistent with a small
cross-border returns differential, suggesting that there is no evidence that the U.S. can earn its way to
current account sustainability.
In the title of this post, I mentioned “What’s Missing”. One issue Frank identifies, which was news to me, was that real estate purchases are not included in the balance of payments data, and hence not in the international investment position estimates.
In principle, cross-border transactions and holdings of residential real estate should be included as
part of direct investment, as is currently the case for commercial real estate. In practice, individual homeowners
are not surveyed and hence these data are omitted from the recorded DI figures. To the extent that foreign activity in the U.S. residential real estate market is of the same magnitude as the level of activity of U.S. residents in the foreign real estate markets, there is no net impact on the international transactions
accounts. However, recent surveys conducted by the National Association of Realtors (NAR) suggest
that this may not be the case.
Additional discussion of the IIP release from Brad Setser.
[Update and extension: 11:30am Pacific]
Brad Setser has made an excellent point that the standard series reported by BEA is based upon direct investment at current cost. In the figures below, I report data based upon market value. Figure 4 depicts the NIIP ratios using the standard series (blue squares) and market value based (green triangles).
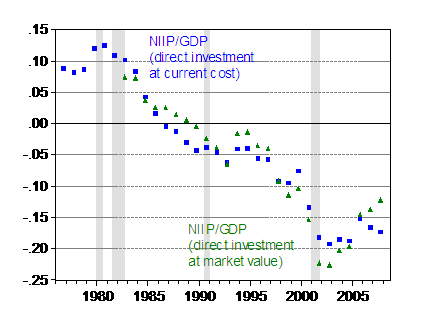
Figure 4: Net international investment position with direct investment at current cost to GDP ratio, 2007 release (blue square), and with direct investment at market value (green triangles), all calculated using June 2008 GDP release. NBER defined recessions shaded gray. Sources: BEA, International Investment Position, 2007; BEA GDP release of 26 June 2008; NBER.
As Brad mentions in his post, the NIIP/GDP ratio using market values is actually improving. Figure 5 depicts the gap corresponding to that in Figure 2, but using market values. The pattern is replicated, although the gap is much wider, now that direct investment is reported at market values.
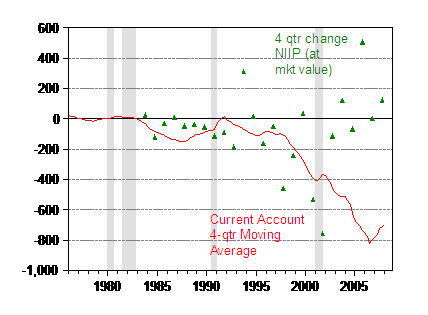
Figure 5: Year on year change in net international investment position with direct investment at market value, 2007 release (green triangles), and 4 quarter moving average of SAAR current account (red). NBER defined recessions shaded gray. Sources: BEA, International Investment Position, 2007; BEA GDP release of 26 June 2008; NBER.
Figure 6 reports the deviation, normalized by GDP, corresponding to Figure 3, but using market valued direct investment.
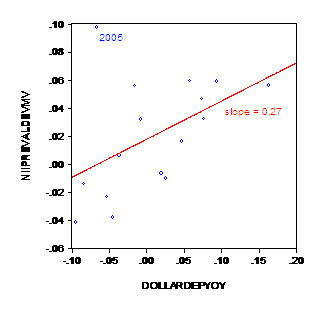
Figure 6: Deviation between the change in NIIP (with direct investment at market value) and the corresponding current account, all normalized by GDP (vertical axis) and year-on-year depreciation of the dollar against a narrow basket of major currencies (Fed index), calculated in log terms. Simple OLSregression line in red. Sources: BEA, International Investment Position, 2007 release; BEA GDP release of 26 June 2008; FRED II; NBER.
The slope coefficient is now noticeably larger. Estimating the equation with the dummy for 2005q4 yields a slope coefficient of 0.38. This suggests that any dollar appreciation against the major currencies will have a somewhat higher impact on the deviation than suggested in the results using the current cost measure of direct investment.
dev-mktval = 0.01 + 0.38dep + 0.113dum05
Adj-R2 = 0.64, SER = 0.024, N=16, all slope coeffs sig at 5% msl.
Menzie — one small note, I used the NIIP data series with FDI valued at its market value in my graphs, where I think you are using the data series with FDI valued at current cost. Obviously, using the series with FDI at market value increases the impact of moves in equity markets — i.e. “market changes.” The BEA prefers the current cost method, so i probably makes the most sense — tho a part of me thinks it is a bit strange to value portfolio equity at market value and FDI at estimated cost. Both approaches have their problems tho.
I really need to read the Warnock paper closely, but I strongly agree with the general view that the income component of the BoP data is among the least reliable of data points. Interest payments are estimated based on stocks, and FDI data comes I think from tax data. And there are strong incentives to shift income to low tax jurisdictions that end up shaping the data. I need tho to read Warnock’s explanation for the “other” adjustments. I also hadn’t realized that real estate isn’t in the data; I had assumed it was counted as part of direct investment for some reason.
Brad Setser: Thanks for the catch. I’ve fixed/augmented the graphs and discussion.
I am not sure it is a catch; the BEA uses both data series. And I gather we are the only ones who obsess about the details of the NIIP!