According to the OECD, America’s economy will be shrinking throughout 2009. The rest-of-the-world won’t be doing so hot either.
The OECD released its semi-annual Economic Outlook today. Here are the forecasts.
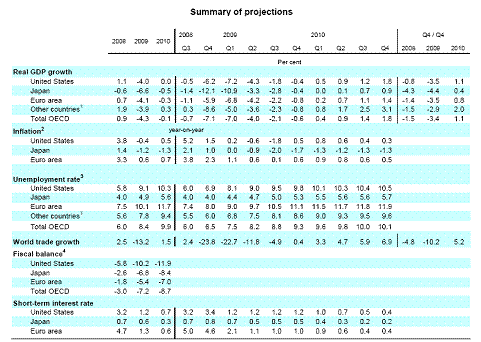
Table from OECD, March 31, 2009.
And here is a graph comparing aggregate OECD and non-OECD growth, quarter by quarter, against estimated growth of potential GDP.
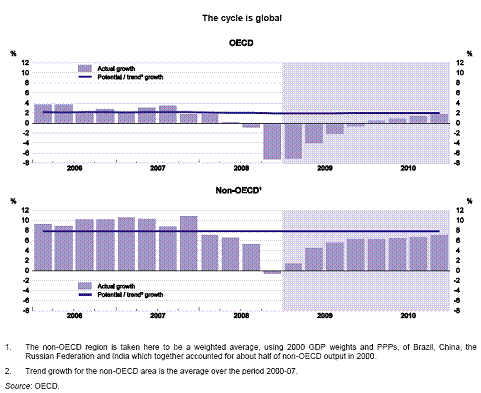
Figure from OECD, March 31, 2009.
The graph of trade volume growth is pretty distressing as well. Lots of interesting data in the release.
Technorati Tags: OECD Economic Outlook, recession,
GDP, unemployment, and trade volume.
Menzie,
When you were discussing the Obama economic team you wrote the following:
I’d also like to comment briefly on the stimulus package that was also brought up in today’s news conference. I recall the advice that Larry Summers offered when we were debating this issue last January:
First, to be effective, fiscal stimulus must be timely…. Second, fiscal stimulus only works if it is spent so it must be targeted…. Third, fiscal stimulus, to be maximally effective, must be clearly and credibly temporary– with no significant adverse impact on the deficit for more than a year or so after implementation.
Although our current situation is more serious than the one we faced a year ago, I still believe that this is a correct articulation of the core principles to keep in mind. Bigger government deficits should not be conceived by anyone as a long-run solution to our economic problems. When economists tell the politicians, “increasing the deficit right now would be a good thing,” we run the same risk as if a doctor advises an alcoholic, “a few glasses of wine will be good for your heart.”
At the time the OECD was forecasting a recovery in the 4th qtr of 2009.
How do you feel about recovery as it relates the the actual performance of the Obama economic team?
DickF: Actually, if you read the post carefully, you will note that it was Jim Hamilton who wrote it.
If you nonetheless wish me to comment, I think to the extent that this recession is looking ever longer (and would be even longer and deeper were it not for the stimulus package), the stimulus is still timely and targetted. Could it have been more targetted, with a bigger multiplier effect? You bet [1] [2]. But the Congress (or more specifically the Senate) did not heed the analysis of the sort I laid out.
So the two very worst quarters, in GDP growth and trade growth, are over.
Why is Japan’s unemployment rate so low, even when their GDP contraction is the worst?
Why is the annual GDP growth for the US for 2010 showing as 0.0, when all 4 of the quarters are positive?
This is screwed up.
GK: The 2010 figure that is 0.0 is y/y. You will note that the sum of the q/q annualized growth rates in 2010 averages to the q4/q4 growth rate [i.e., (0.5+0.9+1.2+1.8)/4 = 4.4/4 = 1.1 ]. Hence, the numbers make perfect sense, in terms of consistency.
Menzie wrote:
I think to the extent that this recession is looking ever longer (and would be even longer and deeper were it not for the stimulus package)…
Spoken like a true Revolutionary War surgeon as General Washington’s blood drips into the bowl and his life passes away.
Long live John Law!
Menzie,
The shock is not how bad US is doing, but how much worse Japan is. What is wrong with that country? Why is a country with the oldest population refuses to save a bit less?
From the same OECD document, I see the chart on page 17 shows this downturn to be the most highly synchronized recession in the post-war period.
The chart title is: The downturn is the most severe and synchronised in post-war history
Fascinating. It sure adds an interesting spin to the green/political-ecology/environmentalist/3rd world solidarity mobilization cry of “Think globally, act locally.”
Menzie,
So 2010 being 0.0% growth is the rate from the MIDDLE of 2009 to the middle of 2010?
Also, why is Japan’s unemployment rate so low, if its GDP contraction is so much worse? Is their workforce much more highly educated than the US? I don’t believe that it is.
Again, this shows that the worst is certainly behind us, now that we are into Q209. There is one more tough quarter to go. After that, things will be sluggish, but manageable.
GK: Approximately yes. Depends where the center of “mass” is in the year. Really, the more accurate description is the 2010 y/y growth rate is change in the the average of the quarterly GDP for 2010 vs. that for 2009.
GK wrote:
Again, this shows that the worst is certainly behind us, now that we are into Q209. There is one more tough quarter to go. After that, things will be sluggish, but manageable.
And this is based on what?
DickF wrote: And this is based on what?
Inventories?
“And this is based on what?”
er… the charts in this article, which are right in front of your face…..