The advance release for 2009Q1 GDP will come out on April 29. Until then, we have some readings from the monthly GDP nowcasts, two of which were released on April 15. e-Forecasting identifies an annualized 9.6% decline in first quarter GDP. Macroeconomic Advisers (whose monthly estimates only extend to February) writes “Our latest tracking estimate of a 5.1% decline in GDP in the first quarter includes a 1.2% decline in monthly GDP in March, reflecting a partial reversal in net exports and weakness in PCE and inventory investment.” A lot hinges, then, on what happens to net exports.
Today, the Chicago Fed released the Chicago Fed National Activity Index (CFNAI). The CFNAI is based upon the common factor approach to combining the information in 85 series, as laid out by Stock and Watson (1999). Overlaying the CFNAI level against the m/m annualized growth rates of the two GDP series (in log terms) yields a suggestive picture, wherein output is continuing to decline.
Figure 1: CFNAI (blue, left scale), and month-on-month annualized growth rate of real GDP from e-forecasting (red, right scale) and from Macroeconomic Forecasting (green, right scale), calculated in log differences; NBER defined recession dates shaded gray. Last recession assumes recession has not ended by March 2009. Source: Chicago Fed [xls] (4/20/09), e-forecasting (4/15/09), Macroeconomic Advisers [xls] (4/15/09); NBER.
Obviously there is a lot of noise in this graph; the documentation for interpreting the CFNAI [1] highlights the 3 month trailing moving average, especially relative to the -0.7 threshold. In Figure 2, I plot the 3 month moving average of the CFNAI against the 3 month annualized changes in real GDP.
Figure 2: Three month moving average of CFNAI (blue, left scale), and 3 month annualized growth rate of real GDP from e-forecasting (red, right scale) and from Macroeconomic Forecasting (green, right scale), calculated in log differences. NBER defined recession dates shaded gray. Last recession assumes recession has not ended by March 2009. Source: Chicago Fed [xls] (4/20/09), e-forecasting (4/15/09), Macroeconomic Advisers [xls] (4/15/09); NBER.
Of course, these are retrospective indicators. The Conference Board’s Index of Leading Indicators suggests a continued downturn through the summer [3] [4].
In my opinion, the wild card is net exports. As Macroeconomic Advisers pointed out in describing its estimate of the February GDP, more than 9.5 percentage points of the 7 percentage points of annualized m/m growth in February was accounted for by net exports — that is the combination of reduced imports and increased exports. But reduced imports, while mechanically increasing current GDP, presages decreased output in the future. Then, the next question is whether US export growth will be sustained. Frankly, with collapsing world trade, I’m dubious.
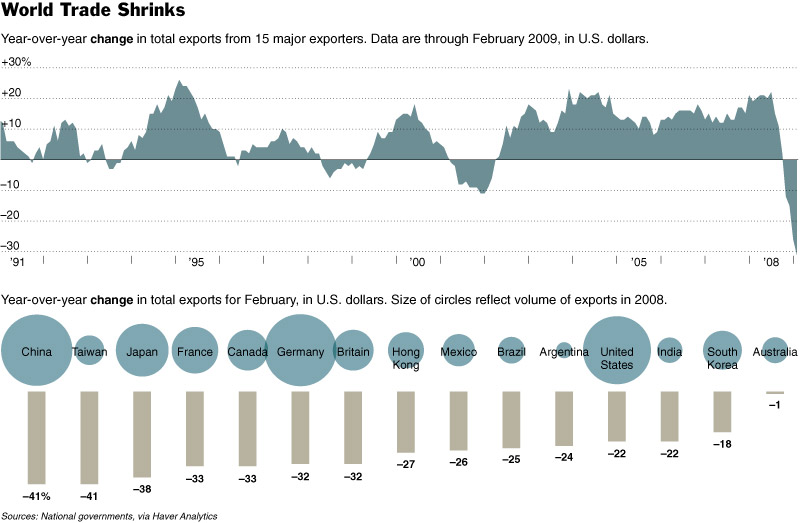
Figure 3: from Floyd Norris, “Trade Is Falling Fast Across the Globe,” New York Times (April 10, 2009).
Look at container statistics.
1) Weekly readings of US Intermodal Railcar loadings continue to nosedive.
2) Latest weekly reading of Container Index dropped to a new cycle low.
3) Port of Los Angeles monthly Container stats shows continued drop in out-bound containers.
US exports for Q1 2009 are going to be much lower than expected.
I see John needs to put the “boom” on Menzie’s “collapsing world trade” (maybe the “ka-boom” was a tad understated) and I find myself wishing for something less dismal. Anything.
Ok, I found the last graph showing the strengths and trends of the major exporting countries very…educational. So that is one positive: I am better informed about the global dispersion of goods and services. [Lookit the difference between India and China…where are the other Euro countries?…] Does Haver have the trans-national breakdown of these exports so we can see how much of China’s exports are co-ventures possibly explaining some of that India/China export difference?
Why do reduced imports presage decreased output in the future?
I do not get it.
Reduce imports reflect prior declines in consumption and current declines in inventories.
So why do they imply lower future output?
Minor pet peeve: When you say “a 9.6% decline in first quarter GDP” you do NOT mean that GDP declined by 9.6% in the first quarter. You apparently mean that it declined by about 2.4% and the annualized rate of change translates to 9.6%. Likewise, apparently the “5.1% decline in GDP in the first quarter ” is NOT actually a 5.1% decline, but rather about 1/4 that amount, although the “1.2% decline in monthly GDP” is actually a 1.2% decline in that month (if I understand you correctly, which is far from certain).
The practice of sometimes reporting annualized numbers without saying so and sometimes reporting the numbers literally (i.e. “1.2%” really means 1.2%) is confusing, although it is widespread in all the media. I encourage you to say “at an annual rate” or something similar if that’s what you mean, as you do in your second paragraph.
Erik Brynjolfsson: Good point. Usually, I’m more careful. Fixed now.
Its just a silly typo, but I think you mean “high frequency” rather than “hi frequency”
Spencer: Most imports are part of some commercial transformation process, e.g., cut, stamped, assembled, shipped, that takes time and run to a schedule because of all the co-ordinated vendor actions. If imports are down now, one can infer that the commercial schedules to transform them into final product (which counts them in GDP) are set with the expectation that demand will be lower in the future.
spencer: I’m working off of Rich Clarida‘s findings that real imports are cointegrated with real consumption, and the presumption that consumption will continue to trend downward as a share of GDP.