Why were the aughts so nasty for stocks?
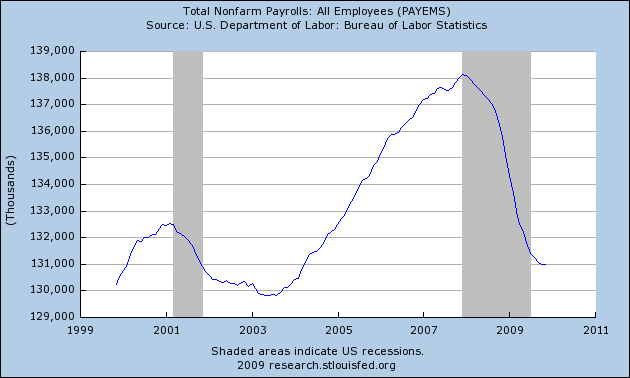
The U.S. ended the decade more or less where it began in terms of total employment.
 |
The owners of capital fared no better, with the nominal S&P500 stock price index down 20% for the decade. The dividends stockholders collected made up for some of that, but inflation took away even more.
 |
One of the reasons stocks did so badly was that real earnings ended the decade 80% lower than they began. Even when you smooth out cyclical variations by taking a decade-long average as in the dashed blue line below, the downturn in earnings at the end of the decade is still pretty significant.
 |
But a bigger reason why stocks did so badly was the changed valuation of those earnings. Yale Professor Robert Shiller likes to summarize this by using decade-long averages of real earnings to calculate a price-earnings ratio. In January 2000, this cyclically adjusted P/E ratio was profoundly out of line with the average values we’d seen over the previous century. If you trust the tendency of this series to revert to its long-run average, it means that whenever the blue line is above the red, you should expect stock prices to grow at a slower rate than earnings. If you bought when the blue was as far above the red as it was in January 2000, then I hope there was something else you found to enjoy about the naughty aughts.
 |
That doesn’t mean you should never buy when the P/E exceeds its historical average. If you buy at those times, you may expect to earn a return below the average historical real yield of 5.5% per year, but it could be that this lower return of, say, 4% would still be better than you can get anywhere else, and good enough for your saving objectives. In 1995, Shiller’s long-run P/E was a bit rich by historical standards at about 20, right where it is today. If you bought at those high prices in 1995 and sold at the even higher prices in 2000, then you did very, very well. But if you’re smart enough to know exactly how to pull that off, then I’m smart enough to know that I’m not you.
Shiller’s graph persuaded me to keep extra cash entirely out of stocks for most of the last 15 years. I shared with Econbrowser readers my reasons for going back into the market over November 2008 through the spring of 2009. In retrospect, that was the one brief window over the last 20 years when Shiller’s calculation suggests you could earn above-average historical returns from buying stocks.
Many financial analysts used to give the advice to put steady monthly amounts into stocks and hold for the long term, trusting in the long-run averages eventually to give you that 5.5% annual real return. The experience of the last decade has spooked some people out of that philosophy. I think it still makes sense provided that the long-run P/E doesn’t get above 20; beyond that, you want to be aware of the risks.
Some people have the psychological reaction that when stock prices have been going down, equities are becoming a riskier investment. I take the opposite view– the higher stock prices go, the scarier they look to me.
Excellent call indeed — in fact the linked articles were 2 of my favorite econbrowser posts so far.
“If you bought at those high prices in 1995 and sold at the even higher prices in 2000, then you did very, very well. But if you’re smart enough to know exactly how to pull that off, then I’m smart enough to know that I’m not you.”
I think one would need a model/idea about trend-followers to do that or a very, very good intuition/feel for the market (in addition to the fundamentals). Preferably, one would arrange for both… 😉
The stock market has done badly because the US domestic private sector has been in deficit almost every year since 1997!
Figure 3 of http://www.levy.org/pubs/sa_dec_09.pdf
So…the big problem is interest rates aren’t low enough and corporate and individual taxes are too high..right?
Some people have the psychological reaction that when stock prices have been going down, equities are becoming a riskier investment. I take the opposite view– the higher stock prices go, the scarier they look to me.
Basic finance is that risk and expected return are directly related. Stock prices tend to be low at times of high risk. At that point, your expected return is highest.
Or don’t you agree that risk and expected return are inexorably intertwined?
I’m afraid the market just doesn’t work the way Shiller thinks it does. The meaningful relationship involved isn’t the one he suggests exists between inflation-adjusted stock prices and ten-year inflation-adjusted earnings per share – instead, it’s the one between nominal stock prices and nominal dividends per share. When order exists in that relationship, you can put your investing strategy pretty much on autopilot – the market even provides clear signals to let you know when that order no longer exists, frequently with early warning signals that order is breaking down.
It’s untangling the relationship between expected dividends and and stock prices during periods of disorder that’s the challenge!
My theory is just a return to the mean. Stocks did amazingly well in the 80s and 90s averaging a total return of twice the 1871-2008 average. This could not continue indefinitely. The 00s have brought us closer to the mean return but not quite there.
People who didn’t make money this decade have a very limited view of financial instruments.
There is always a bull market in some asset class.
A bear market is a bull market for shorts.
Once you know this, even a decade such as this one can be profitable.
Hell, a flat market is great to earn 10-15% a year in covered calls.
“I think it still makes sense provided that the long-run P/E doesn’t get above 20…”
But it just pushed above 20, didn’t it? The Q ratio is just as bad, because assets of businesses have fallen so much, an S&P500 of 1300 or so will be equal to the 1560 of October 2007.
If you take an equal weighting (not capitalization weighting) of random stocks (and thus accept a mostly small cap portfolio) and maintain that equal weighting with frequent rebalancing, while holding down overall trading/slippage costs, then you do a lot better. Fundamental weightings have the potential to improve things further.
The Tokyo stock exchange crossed 10,000 about 1984 on its way up to 39,000 in 1989, then the bubble burst. The Nikkei plunged into the mid-teens over the next couple of years, bounced between there and the low twenties for most of the nineties. In the noughties it began by plunging below the 1985 level, recovering to the mid teens and fainting again. It is now around 10,500, like the Dow.
There is no guarantee that stock investors in the US will be treated any better during the next decade, than Japanese investors have treated for the last 2.
But it just pushed above 20, didn’t it?
====================
Last I read it was at 24. If you want to pick nits, TTM P/E is at 90
The 1990’s will be remembered as fondly as the 1920’s ….. a bubble that was non-sustainable on real economics
Bill Clinton = Calvin Coolidge
George W Bush = Herbert Hoover
Bob and Mark: Right now we’re at 20.4– that’s my point.
While I completely agree with the spirit of Shiller’s methodology (which is to smooth earnings so as to get reasonable PEs when earnings are distorted), there is one big drawback: accounting standards change through time and differ in each country. So $1 in earnings in the U.S. today is not necessarily the same as $1 in earnings in the U.S. twenty years ago or in another country.
For this reason, I prefer to look at the Fed’s Net Corporate Cash Flow. This series is quite stable, so it does not need smoothing. Also, it is much less subject to accounting changes. Finally, I believe it is a good proxy for free cash flows but I need to do more research on that (in equity valuation theory, only free cash flows are relevant).
See http://raphaelkahan.blogspot.com/2009/12/december-stock-market-update.html
JDH: That is indeed interesting. But something is missing.
For several decades now, you have been writing articles on the economics of oil yet you apparently stayed out of the early 21st century oil boom that ultimately evolved into a full commodity boom. Why?
If you were a senior executive in an oil and gas exploration and production company, I could understand wanting to avoid o&g stocks for purposes of portfolio diversification. You are in the employment of a para-public university whose risks are if anything negatively correlated to oil prices.
Have any of your writings influenced policy in the USA? I would guess not. Apparently, you have chosen to not lever this knowledge into your investment strategy. Why? Did you choose to pre-commit to a strategy of avoiding specific sectors and specific companies?
Given that there have been multiple occasions where buying at a 15 P/E results in significant losses over a multi year position I am mystified by this post. As Prof. Shiller’s chart illustrates most secular bears end with a P/E in the single digits. Perhaps this time it *really* is different, Prof. Hamilton.
“One of the reasons stocks did so badly was that real earnings ended the decade 80% lower than they began. Even when you smooth out cyclical variations by taking a decade-long average as in the dashed blue line below, the downturn in earnings at the end of the decade is still pretty significant.”
But the decade long average is higher for 2000-2010 than it is for 1980-1990 and 1990-2000, and it trends upward more.
It appears that earnings in the 2000s were not bad by historical standards, just not nearly as good as the market expected, and embedded in prices.
Plus, of course, the earnings stream became a lot riskier in pattern, increasing the risk premium the investing public placed on stocks.
If the next Fad is China ( perhaps, a sound fad) than emerging markets will leave the US stocks on average flat for the next 10 years, around DOW 10 000 or so, despite the fact that the US has huge domestic consumption. There is only cyclical profit left in the US stock indexes ( except, if You bought in March 2009).
The emerging market stock markets will steel the investor money from the US. In usual herd like manner, investors will drop US stocks one by one, increasing emerging market stock share in their portfolios, so that net investment in the US stocks will stay flat.
One of the graphs above seems to imply that average PE was near to 15. It was actually near to 10, and it is only the continuous pressure by the USA governments in the past 25 years (and especially since 1995, when all stops were removed) to drive up asset prices via a series of bubbles that skews the picture. Considering alternative investments and the risk of stocks, a PE of 15 makes no sense as a long term average.
Also note that according the graph above since 1995 PEs have been above “average”, while in the 1890-1995 they have been mostly below (except during bubble periods), even if the country was developing much faster in the earlier period.
Indeed look again at the graph and you will easily that there have been two completely different periods, 1890-1995 and 1995-2010, with very different real growth rates, and very different PE average levels (around 10 in 1890-1995, and around 20 in 1995-2010).
It looks like the USA elites have decided to asset strip the USA and cash out their assets, and have been determined to do so at the best possible price, and the past decades they have resorted to every possible trick to goose the prices of the assets they are selling up, from deregulation and accounting fraud to 1% interest rates to TARP.
The most obvious example of this has been Goldman Sachs partners selling out their previously jealously guarded partnership shares.
Blissex: The fourth graph plots the ratio of the real price to the ten-year average of real earnings. That is not the same concept as the “average P/E” ratio. The latter would be a smaller number than the former as a result of average positive growth for real earnings.
Excellent writing on the stock market on a macro level (though anyone who can read annual reports and willing to invest in individual stocks should really do bottom up analysis).
I have yet to see insightful comments regarding the influence of third party asset management on asset pricing. Asset managers who make fees based on a percentage of assets (the predominant model today) have an obvious interest to keep asset price as high as possible most of the times, long term returns be damned. Now I really believe this is one source of the great power that the Fed enjoys today, esp compared to the Great Depression era, when most investors managed their own money. Monetary policy (interest rate) needs to conduct through asset price. If asset price does not respond the Fed would be pushing on a string.
Interesting that in the first chart the St Louis Fed has determined that we are somehow no longer in a recession. Really? What pray tell are we in then (and I exclude of course the TBTF’s who have paid themselves tens of BILLIONS of taxpayer $$ as bonuses).
The decade doesn’t end until December 31, 2010.