Yes, we’re still in the economic recovery phase, and yes, it still looks pretty sluggish.
Americans bought 1.1 million light vehicles in May, 19% more than in May 2009. Apart from the cash-for-clunkers blip last August, that’s more cars sold than in any month since August 2008. But the latest number is still almost 30% below May 2007. The recovery is underway, but we have a long, long way to go before you’d call things normal.
 |
Temporary government hiring for the 2010 Census added 411,000 workers to the employment rolls in May, but that was about it on the employment front. BLS says the private sector added only 41,000 jobs (ADP had a similar estimate), half of which were taken away by losses of state and local government jobs. The unemployment rate edged down to 9.7%, but this was entirely accounted for by people dropping out of the labor force. Even with the Census jobs, we’re still below the employment level of May 2009. Although disappointing, all this leaves us about on track for what might be expected at this point for the sluggish recovery many had been anticipating. Healthy job growth is still something we’re hoping will come in the future as opposed to something anybody claims to be seeing so far.
 |
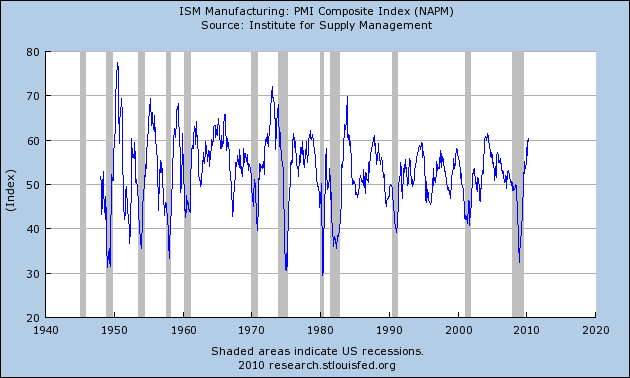
But there are some other more favorable indicators. Earlier in the week, ISM reported its PMI manufacturing index was at 59.7 for May. Some outlets reported that this was less favorable than the 60.4 reading for April, but that’s the wrong way to interpret this statistic. Any value above 50 means that more of the managers surveyed reported that May was better than April than reported worsening conditions, and a value near 60 is quite a strong indicator that things are getting better.
 |
The Federal Reserve’s index of industrial production, released a few weeks ago, also looked pretty good.
 |
The Chicago Fed National Activity Index, one of the best overall indicators of economic activity, has been in positive territory for two months in a row now.
 |
And the Aruoba-Diebold-Scotti Business Conditions Index has been sending pretty favorable readings.
 |
So my assessment remains as it’s been for some time– we are in the recovery phase, but it remains disappointingly sluggish. Our Econbrowser Emoticon, which has been stuck in neutral for almost a year, looks like it will be staying put for a while yet.
I always looked at the recovery phase in two ways.
One is the official NBER cyclical definition that recoveries are from the bottom until the previous peak in real GDP is surpassed. After that we are in an expansion.
The second is the period when inventory rebuilding makes a significant contribution to growth.
In either case the economy should be making the transition from recovery to expansion sometime this summer– maybe as early as June.
In either case we are having a moderate recovery — stronger than in 1990 and 200 but weaker than most other recoveries. It is especially weak in relationship to the depth of the recession.
The key question is what happens to growth when the economy passes from recovery to expansion.
Unless we see significantly stronger growth in real income as the boost to growth from inventory rebuilding fades what is going to keep the real economy from entering a period of stagnation or sub-par growth? I do not know. It is unlikely to be trade. What do you think would create strong growth?
I think you guys are nuts.
Looking at employment seems more trusty than at unemployment, and looking at tax revenue seems even stronger.
Employment is down because people are working less. Sales tax collections are down because people buying less. Don’t point to an index and tell me they’re ‘feeling confident’. They are earning less than before and spending less than before.
And there is a tidlewave of new state government layoffs coming.
If we can avoid another financial crisis like Fall of 2008, I think we shall be on track for nothing worse than a mildly deflationary version of the 70s oil shock malaise. But, I have a lot of worry about the current European troubles turning into another Lehman-like event and we end up with 12-15% U-3 here in the US after round II of another six months of steep layoffs.
I made a little graph regarding the employment recovery that is in terms of aggregate weekly hours as opposed to the headline payrolls number:
http://1.bp.blogspot.com/_o8Xs9Yq45p4/TArWuCz4ZAI/AAAAAAAAADc/tUvMYqeGEEA/s1600/AggregatehoursMay2010.jpg
For this purpose I assumed that the present recovery began after July of 2009. Now, if I had also thrown in the recovery from 1981-82 the present recovery would look quite puny indeed. While it would be right to call this employment recovery sluggish, it is looking better than the prior two recessions, though it needs to be much better in order to repair the considerably greater amount of damage.
It is quite simple. When you sepnd 1T on exptending unemployment benefits and people expect tax rates to increase jan 1, you will not have significant job growth. You cannot have more than a 1.0 multiplier on extending unemployment benefits. It doesn’t take a CEA economist to figure that out. With our debt approaching 70% of GDP and slack economic growth, we have a problem. It will only get worse from the proposed economic policies of this administration. It has to be theri goal to bring this country to its knees because they are succeeding.
“So my assessment remains as it’s been for some time– we are in the recovery phase, but it remains disappointingly sluggish”
What????? National debt is 79 trillion dollar with GDP only 14.2 trillion.
It’s just a matter of time to see hyperinflation in US, 25% unemployment rate, and eventually great recession.
Wake up!!!
Spencer: Much of the downturn in recessions comes from people postponing purchases. Undoing that along with inventory rebuilding are the key thing producing the extra kick at the start of a normal recovery. But it doesn’t seem to be doing the trick this time around, at least so far; that’s the point I’m raising.
As for longer run growth, I think what we are rooting for is for business fixed investment and net exports to lead the charge. If that doesn’t happen, I suspect we’re talking about a slower growth rate once we return to full employment. But, as I say, full employment is still a long, long way away.
I’ve figured traffic trends are a good measure.
They’ve shown that productivity has actually decreased (in MPG) 2005. The recent adjustments have shown great improvement. However, I think this has more to do with numbers being fudged in the scramble for stimulus dollars than actual improvement (other than decreased congestion in a down economy).
I previously thought TVT would over-estimate traffic volume in a recession, but I talked with Steve Jessberger at the FHTWA and he said the opposite is true (I don’t remember his explanation, but it seems right). I suggested that number may be fudged to make ITS system appear more effective than they are, but he pointed out that they could only do that for a short time and the truth would come out, I agree. But I think the one shot drive for stimulus dollars has skewed the numbers upward and hidden the decline in fuel efficiency (productivity) we’ve had.
Whist ready to welcome any good news, the contradictions remain, between an expanding financial sector and a contracting manufacturing sector (see the latest post from Menzie Chinn : Tales from the BEA’s GDP by Industry Release: The Private Economy and Rebalancing)
https://econbrowser.com/archives/2010/05/tales_from_the.html
I keep the public debts as road maps and the statistical model of the IMF and P Rogoff C Reinhart “This time is different” as compass.
Three years after epitomizing the crisis as a Banking,financial causes and effects none of its structural problem has been conclusively addressed.
Brian
The link to your thread is not operating
It looks to me like your ISM chart peaks around 60 and then we head back into recession.
I know their forecast is high frequency and subject to revision but boy did you e-forecasting
updated GDP projection????
A tepid recovery is disappointing considering the size of the stimulus plan which preceded it.
The stimulus is winding down, the inventory adjustment is ending, taxes will be going up, private deleveraging continues.
This recovery was bound to be unusual, as it came after the bursting of an extraordinarily large financial bubble. On top of that, policymakers are refusing to recognize its unusualness, and they insist on treating it with their traditional medicine – Keynesian monetary and fiscal stimulus – even though there is strong evidence that the bubble was caused partly by excessive use of that medicine after previous recessions and by inappropriate continuation of fiscal stimulus during the expansion of 2003-2007.
The result has been extremely radical fiscal stimulus, as governments that were already running large fiscal deficits sought to boost spending further by a degree that seemed to match the scale of the recession. These deficits have been diverting capital from the private sector, slowing the job growth that normally drives recoveries, and they are creating a new financial crisis, already underway in Europe. Japan seems most likely to be next to hit the wall with its overspending. Its saving grace has been its people’s faith in the Japanese state, and particularly in the state’s guarantee of deposits in the state postal bank, which are on-lent to the government to fund the deficit. Thus, the income that the Japanese people are ostensibly earning on their deposits actually comes out of their taxes, or worse, from the supply of new deposits.
My sense is, the ‘recovery’s an artifact of government deficit spending and that your emoticon will soon be frowning again. Instead of net exports contributing to the recovery, the U.S. CA balance appears poised to go down again. The only bright spot may be that with dollar appreciation and global growth slowing, the oil deficit may improve. Otherwise, it seems like it is back to the old export-led growth strategies in ROW. The world’s surplus countries have got to find another business model, particularly those in Asia – the U.S. and other borrowers have (or will) hit limits.
You can provide all the demand side stimulus you want but it will not create jobs. Read the opinion piece in yesterday’s FT http://www.ft.com/cms/s/0/e7909286-726b-11df-9f82-00144feabdc0.html.
Paying people not to work will not grow jobs. Obviously, you never had employees. They will react to the incentives. 99 weeks of unemployment will get you employees that do not work.
Even the Europeans have figured it out. Now who will Obama try to copy?