I keep on hearing we have a spending problem, but no revenue problem, from you know whom. I decided to appeal to actual data. Below is a time series plot of Federal current expenditures and tax receipts plus contributions to Federal social programs, as a share of GDP, over the 1967Q1-2011Q1 period. The data are based upon the data definitions in the BEA’s national income and product accounts (NIPA), as of June 2011. Outlays are declining, and as of 2011Q1 are at 0.25, which exceeds the previous peak, during the Reagan era, at 0.241 (1982Q4). Federal tax receipts plus social program contributions are at 0.158.
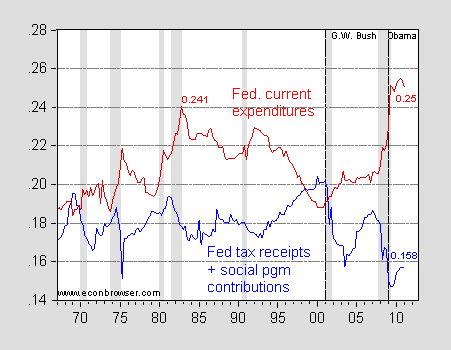
Figure 1: Federal current expenditures, line 20, BEA Table 3.2 (red) and sum of Federal tax receipts and social program contributions, lines 2 and 11, BEA Table 3.2 (blue), both divided by GDP. All raw figures in billions of $, SAAR. NBER defined recession dates shaded gray. Dashed lines at 2001Q1 and 2009Q1. Source: BEA, 2011Q1 3rd release, NBER, and author’s calculations.
Note the blue line does not equal total Federal receipts (income receipts on assets, transfer receipts, enterprise surpluses are not included), but it is only a small bit off. In order to close the gap between outlays and tax and contribution receipts, one needs growth which will reduce outlays and increase receipts through automatic stabilizers. But more fundamentally, it is hard to see how the bulk of the gap (i.e., the structural component) can be closed entirely by reducing spending.
[Update 8:41am Pacific] Reader MSM asks:
You essentially assert that the bulk of the gap is structural, rather than cyclical.
Really?
Which of these numbers say that, and how big is the structural-cyclical split of the gap?
Well, one can always refer to the CBO, as I have on a number of occasions in the past, to obtain the numbers requested. It’s as simple as downloading a spreadsheet to obtain the numbers. Here they are plotted (by FY):
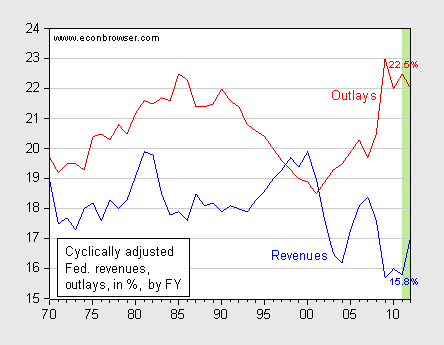
Figure 2: Federal revenues without automatic stabilizers (blue) and outlays without automatic stabilizers (red), both as a percentage share of nominal GDP, by FY. Numbers correspond to FY2011 values. Green shaded area are projections. Source: CBO, “The effects of automatic stabilizers,” (May 2011), additional information.
Going forward to 2016, one would see the current law projection of cyclically adjusted revenues bounce back up to near average levels; that is because of the expiration of the 2001 and 2003 tax cuts (and the extension passed last year).
Over the last two years, we are at the lowest point in revenues (as a % of GDP)since the 70’s. Explain to me how lowering taxes at this time is the right thing to do? GOPpers should throw away that cocktail napkin with the Laffer curve drawn on it. We’ve been to the left of the apex of that curve for a looong time.
The real point is the GOP wants to eliminate Medicare. They’ll dress it up with lies, but they want to shift the cost from the government to the individual. I think a big issue in the current debt limit mess is the posturing over cuts to Medicare; the GOP wants them but they want to be able to blame the Democrats for them because you can’t get elected running on a platform of impoverishing old people. So there is no revenue problem, just a spending problem because spending is Medicare and then Social Security.
We now have faith-based government. If I’m alive long enough, the history books will record this as the time when America drove itself into decline by placing ideology, particularly religiously driven ideology, over pragmatism.
You essentially assert that the bulk of the gap is structural, rather than cyclical.
Really?
Which of these numbers say that, and how big is the structural-cyclical split of the gap?
Menzie,
We have both a spending and a revenue problem. What we don’t have is a tax rate that is too low.
Thanks for your graph. It makes the point very clearly. Increased tax rates decrease tax revenue. It also clearly shows that to bring the federal budget into balance spending needs to decline as revenue increases. This is clear in the 1960s and the 1990s on your graph.
From your graph it seems that policies that reduce tax rates to increase production and total tax revenue combined with a serious reduction in expenditures is just the right formula for pulling us out of our current crisis.
Also dramatic in your graph is the impact of Greenspan’s stable dollar during the 1990s. A stable dollar allows producers to produce without the economic friction of windfall profits and losses from currency fluctuations. A stable currency is one of the most important elements in allowing an economy to grow. A constantly depreciating currency destroys savings as people seek to dump their money for real assets as soon as possible.
Thank you for the CBO link (broken, but quite decipherable).
I see the CBO showing a projected budget deficit of -996 in 2011 to -463 in 2014. Hence, I’m not immediately seeing why you characterize the bulk of the gap as structural. I can only suppose that you’re assuming that your audience knows (or should know) how the CBO baseline shows structural change from 2011 through 2014.
MSM: See Figure 2 I have just added.
Brent Bruckner: Fixed the link. Well, the CBO out-years projection incorporates the current law requirement that Bush era tax cuts expire as originally legislated. I interpret the gap w/o raising those taxes as structural (obviously, in a non-CBO current law sense, but in a Republican holds fiscal policy hostage sense).
Thank you for providing Figure 2.
I note that you started with current expenditures and revenues in Figure 1, and then shifted to excluding automatic stabilizers in Figure 2.
Time to revamp the tax code. Eliminate the income tax and employment taxes. Put into effect a transaction tax of %5 on all transactions in the country. Tax Corpoations on the domestic production, that is, the less you make in the U.S. the higher your tax rate. If you produce more than 50% of your product off shore, you are tarriffed at 25%. The federal and state doffers would overflow and the worker would be freed.
Professor-
Several points-
The use of quarterly amounts seems a bit strained and motivated solely to make this regime look better by a comparison with Reagan. Annual outlays peaked at 23% of GDP in FY 1983, as the country was roaring out of a severe recession (compare that to today’s stagnation). Note that outlays were 22.2% of GDP in FY 1981, mostly under Carter. Estimates for FY11 are about 25.3% of GDP.
Receipts are down not because tax rates are low, but because taxpayers are beaten down. Receipts were 18.5% of GDP just before the financial crisis, and the defict was just 1.2% of GDP after peaking at 3.5% in FY 2004 – if we were to revive the economy and curb the current regime’s profligacy, we would have a manageable problem. Revenues will take off once the economy takes off. There is no need to raise tax rates to get more revenue – Obama just has to get his boot off the neck of the private sector.
The budget will not be balanced overnight, but can be brought into balance over time, without disaster, with a plan like Paul Ryan’s. For this to happen, it is essential that our Dear Leader be returned to private life in 2013.
We have a “revenue problem” because there are not enough people working.
We have a “spending problem” because there are not enough people working.
Get people working again to see the 90s again. How to do that? Demand side solutions. MMT is the only economic paradigm that sees reality.
if you break it roughly into tax “regimes”, say pre 1983, 83-92, 92-00, and 00+, there is a decent correlation between the deficit as a % of GDP and the unemployment rate, with different slopes. I am not 100% sure of the dates offhand but, duh, within a “stable” tax structure, recession results in deficits by lowering receipts and increasing expenditures via stablizizers. Surpluses were generated in the 90s when UE fell below about 5%. More evidence we should be focused on jobs/growth, and not austerity!
However, from the perspective of ultimately what revenue targets one would pick, even the 90s targets are slightly suboptimal – if a “balanced” budget is desired: there were no surpluses until unemployment fell below what many people think is non-inflationary. One wants the deficits generated when UE is above some the rate u to equal surpluses when UE is below the u(i.e. u is roughly the breakeven UE rate at which the deficit= 0). Since UE spends more time above 5% than below it, the breakeven rate u is probably closer to 5.5-6% – which implies slightly higher rates than in the 90s(or higher non-inflationary growth, not likely!). Just some thoughts.
Brent Bruckner: Figure 2 presents different series because reader MSM asked for the cyclically adjusted gap. The outlays and revenues w/o automatic stabilizers are the CBO’s versions of cyclically adjusted (nomenclature change).
As shown, each time income receipts reached a pick a recession ensued.
Income Receipts
http://research.stlouisfed.org/fred2/series/BOPXRT?cid=3000
According to the http://www.bea.gov/scb/pdf/2011/07%20July/0711_itaq-text.pdf
U.S. government receipts increased strongly, resulting mostly from an increase in interest receipts on U.S. reserve assets.
Reserve assets
Coverage and definitions Transactions in U.S. official reserve assets are measured in the following accounts: (1) Gold (line 42); (2) special drawing rights (SDRs) (line 43); (3) reserve position in the International Monetary Fund (IMF) (line 44); and (4) foreign currencies (line 45) (see table 18). Transactions consist of (1) sales and purchases by U.S. monetary authorities of monetary gold (that is, gold held by the U.S. Treasury as a financial asset); (2) IMF allocations of SDRs to the United States and cancellations of SDRs, U.S. acquisitions of outstanding SDRs, and sales of U.S.-owned SDRs for foreign currencies or U.S. dollars; (3) changes in IMF holdings of dollars, resulting from transactions between the IMF and member countries; and (4) foreign exchange market interventions by U.S. monetary authorities, some acquisitions of foreign currencies from the IMF or foreign governments, and net earnings on U.S. official
Worth trying to have the same information for Europe.
An other subprime?
Thanks, I follow you that excluding automatic stabilizers removes much of the cyclical component.
I don’t think the 15.8% revenue number is even valid anymore. Since January the Daily Treasury Statement shows revenues are flat. The project for FY 2012 is for $2.5 trillion in revenues, but that is far too optimistic.
There are a bunch of items scheduled to expire at the end of 2011 that would constitute austerity. Key among those are the 2% payroll tax reduction, unemployment extensions, Medicare physician reimbursement and proper funding of housing agencies losses. Is Congress going to allow those to roll off?
Rich Berger “Receipts were 18.5% of GDP just before the financial crisis, and the defict was just 1.2% of GDP after peaking at 3.5% in FY 2004”
Receipts were 18.5% of GDP at the peak of the business cycle when tax payers were cashing out of the housing bubble. Capital gains were 900 billion that year. The on-budget deficit was 2.5% of GDP that year after peaking at 4.9% in 2003 and 2004.
Rich Berger: Annual outlays peaked at 23% of GDP in FY 1983, as the country was roaring out of a severe recession (compare that to today’s stagnation).
Outlays peaked at 23.5% of GDP in 83. The country “roared” out of the recession in 81 because growth was strong before the recession. Compare what growth looked like before the recession in 81 to before the recession in 07. In Q4 1980 real GDP grew at an annualized rate of 7.6%. In Q4 1981, real GDP grew at an annualized rate of 8.6%. In Q3 2007, real GDP grew at annualized rate of 2.3% and 2.9% in Q4 07.
1977-1987 can be summarized as strong growth – interest rate hike slow down – sharp rebound – average growth.
Economic growth during the first three years of the Carter administration was stronger than during the first three years of Reagan’s second term.
Real GDP growth
1977 4.6%
1978 5.6%
1979 3.1%
1985 4.1%
1986 3.5%
1987 3.2%
Basically yeah, since so many people are out of work insurance transfers are higher and we collect less taxes.
The 80’s were usual because we did’t see the drop in overall spending like other expansions and tax revenue didn’t bounce back up as much either.
Joe
Funny but the voters must have thought that Carter was too successful. In fact, I think the real growth rates during the Carter admin were a consequence of inflation. Stimulus first, hangover later (during Reagan’s term).
We will need another Reagan to clean up the Obama mess.
Rich Berger In fact, I think the real growth rates during the Carter admin were a consequence of inflation.
Huh??? So now real growth rates are just a consequence of inflation??? I have no idea what you were trying to say here, but whatever it was you might want to give it another shot.
Prof. Chin: How do you think you close the gap – even with 70’s tax rate you can not get to more than 18% in cyclically adjusted revenue…now, can you understand what the “lunatics” in tea party say – it is the spending that is the problem….
For those who do not understand what Rich Berger is so patiently trying to explain.
Because of the Reagan tax rate cuts (and also modest regulatory easing), the economy boomed from the approximate time his initial tax rates reduction were finally fully implemented. Perhaps some do not understand this because Menzie purposely limits his graphs to revenues as a percentage of GDP (which show a visually flat curve). But to fully appreciate what the revenue curves actually says, either or both, a curve of GDP growth or actual revenue growth should also be provided.
Looking at those additional curves as compared to other eras would show that the Reagan era tax rate growths brought long lasting high real GDP growth as well as tremendous increased revenues. In fact revenues grew so greatly, that even with huge spending increases by the Democratic Party lead Legislature of the times, revenue outgrew even that pace.
2sb-
I guess I overestimated you, so I will try a simpler explanation. The real GDP is estimated by dividing nominal GDP by a price index to remove the estimated effects of inflation. The initial reaction to inflation is stimulative, as businesses and individuals believe that demand for their goods and services is real. It is only later when prices have increased do they discover that the “increased” demand was only debasement of the currency. The price deflator does not take these lags into account. During the Carter years, the annual inflation rate was increasing, so each stimulus was succeeding by a greater stimulus. Eventually, the rate of inflation rose far enough (about 13% in 1981) that the fear of a runaway inflation caused the Fed (with concurrence of the Reagan administration) to reduce monetary growth, and bring inflation down. The side effect was a severe recession of 1981-1982, as price expectations were reversed.
I had always wondered why the real growth rates during the Carter years looked relatively good, while the Carter economy was so dismal. I believe the answer was the lag between stimulus and price increases. Like a junkie, the economy went through a tough withdrawal until inflation was controlled and the Reagan boom took hold.
Both charts are good at showing that current expenditures have long exceeded federal receipts. A balanced budget would have small surpluses in non-recession years, with deficits showing up in recession years (i.e., blue line would be higher than the red line in most years). If we want the level of federal spending to average ~20%, then we need the level of federal revenue to average ~20%. If we want federal revenue to be more like ~18%, then we need to reduce/eliminate federal programs to get the red line down to ~18%. There are a lot of ways to solve the imbalance: check out the Committee for a Responsible Federal Budget for some ideas and a simulator.
The persistent imbalance over the last 40 years may explain why recent efforts at fiscal stimulus appear less effective than hoped. Professor Chinn has previously cited research (from the IMF?) showing that fiscal stimulus is less effective when nations enter recessions with higher levels of publicly held debt.
Rich Berger So does this mean we can mark you down as belonging to the school of adaptive expectations rather than rational expectations?
Ed Hanson You do know that Reagan had a large FICA tax increase, right? You do know that when the Reagan tax cuts were fully implemented the deficit ballooned to 6% of GDP, right? And you do know that your statement:
Looking at those additional curves as compared to other eras would show that the Reagan era tax rate growths brought long lasting high real GDP growth as well as tremendous increased revenues.
is mostly bunk. GDP growth was not particularly outstanding, and revenues as a percent of GDP actually fell under Reagan.
Reagan deserves a lot of blame for the disastrous and ill-considered 1981 tax changes; but by the same token he deserves a lot of credit for the well-designed 1986 tax reform, which largely reversed a lot of the nonsense that was in the 1981 bill. So let’s give two cheers to the Gipper. Unlike Dubya, the Gipper managed to learn from his mistakes.
Slug
Does your head hurt when you have to twist your Keynesian thinking to try to make sense out of what does not make sense in your world outlook.
Just try to get your mind around some basic trends during the Reagan Administration. Not to put too many things for you to think about all at once, but here is a couple of ideas you need to digest.
Marginal tax rates for all tax payers were reduced, greatly. This certainly includes those tax rates on the very rich. Real defense spending went up, in both terms of actual dollars and percent of GDP. I believe that each of these these items in diametrically oppose to what you think should be policy.
But what happened. The country quickly recovered from a deep recession, as deep as one as the start of the last one we are still currently feeling the affects. Inflation which verged on hyper was reversed, and long lasting moderation and reduction resulted. Employment grew, wealth grew, government receipts grew.
Now compare that to the solutions of the current administration, and approved by you. Raise marginal taxes, and put into place several other new and increased taxes on the country. Spend money that the government simply does not have, financed by borrowing and printing. Tremendously increase government control of the private market through regulation. And what do we have now. Increasing unemployment. Even with planned decreases in the defense budget, an increasing national dept spiral that is confounding our elected leaders. Tax receipts that continue to languish. And a measured GDP that is stagnant.
Your policy ideas do not work. Government is a terrible instrument of growth of wealth in the country. You need to recognize this. All we got is the individual, rewarded for labor and risk, to improve the world we live. The government is the problem. Get out of the way, and let people do what they naturally do, improve their own lives the best they can. It works.
This is really too easy. Real GDP during Reagan . You will note that after the clean up of the Carter mess, from 1983-1989 real GDP went up by 4.6% per year.
Let’s see the demand side formula:
A weak currency will improve the economy by increasing exports.
Deficit spending by the governmnet will replace weak consumer spending.
Government investment will replace private sector investment.
An expansive monetary policy will stimulate and economy.
An Expansive monetary policy will create employment.
Greater regulation will better channel production.
Based on this formula we have the greatest economy the US has ever seen. We are off the gold standard, we have massive government spending in stimulus programs and QE1, QE2, QEnew, the currency is falling like a rock.
So the formula says things are great and so you should just ignore the reality of prosperity under supply side policies. That has to be a fantasy. SO,QUITYURBTICHIN and live with it!
Effective tax rates on wealth and corporations are the lowest they have been for sixty years. Please explian with specific examples how Obama has “his boot on” anyone.
Re slug. You do realize that real increases in defense deficit spending is, ahem, keynesian.
What this graph shows, is that there are far too many “federal jobs,payrolls,benefits,and pensions” in relation to the private sector. The private sector is making major cuts, while the federal government continues spending, as if there is no tomorrow. Well tomorrow is today. and if not today. Its 08/1/11 or so. Cut Federal jobs, payrolls, and benefits, Or put all the non-military federal jobs out on bids to the private sector. Allow oil and gas production to start lowing USA oil and gas prices, and the economy will BOOM, more private sector jobs, payrolls, benefits,..lower gas and oil prices, so transportation,food,material, costs go down, prices go down, and everyone is happy,earning money (and THEN paying their taxes) …(except the “treehuggerz” or the “duckscrubbers” who “work” for “government”) they seem never happy with private sector business.
With almost half the country not paying any income tax and a 16% combined rate of unemployment and under employment, the debt problem is clear. Giving fewer handouts and getting people back to work is the answer. Even Obama should know raising taxes in this economic climate will exacerbate unemployment and further compromise GDP growth. No, increasing revenue through tax increases is not the answer. Incentives to invest in our country and not penalizing those who create jobs is key. Continuing to spend and increaing taxes is like saying: The beatings will continue until our moral improves! And by the way, I don’t believe that graph proves revenue increases are the answer, unless you view it with a strong liberal bias.
JPK, Chicago
This analysis is fraudulant. Taxes to GDP go down by definition when GDP is financed by debt. It does not follow logically that we are undertaxed.
If all of you went out tomorrow and bought on credit 3 Ferraris, two new homes and installed a pool your tax to GDP ratio would go down. Are you therefore undertaxed? Think also, your income to GDP ratio would go down. Think you could demand a raise from your boss?
We have financed the denominator in this measure, and some are trying to use it as evidence we should pay more taxes. Terrible “analysis.”
Anonymous from 1983-1989 real GDP went up by 4.6% per year.
Not quite that high (more like 4.4%), but what you’re missing is that Reagan had one year (1984) with very high growth, and that year was dominated by one quarter of spectacular growth. The other 31 quarters of Reagan’s Presidency were ho-hum in terms of growth. Not bad, but not particularly remarkable either. Basically the entire “morning in America” myth is based on one quarter’s worth of very strong growth.
Ed Hanson Marginal tax rates for all tax payers were reduced, greatly.
Marginal tax rates also increased for most taxpayers under Reagan; e.g., FICA taxes increased quite a bit. And don’t forget that lower income folks lost a lot of deductions (e.g., consumer interest) under Reagan. I’m not saying this was a bad thing, only reminding you that people have a tendency to misremember what actually happened under Reagan.
Now compare that to the solutions of the current administration, and approved by you. Raise marginal taxes, and put into place several other new and increased taxes on the country
Did taxes go up under Obama? I don’t think so. He cut the FICA tax and extended the Bush tax cuts. Obama also pushed through the Make Work Pay provisions. And Obama is not arguing for tax cuts during the recovery.
Spend money that the government simply does not have, financed by borrowing and printing.
So you think it would be better if the excess saving just leaked out of GDP as a permanent loss to output? That’s dumb. If people want to save, then someone has to borrow. You can’t have savers unless you have borrowers, and right now only the govt wants to borrow.
Tremendously increase government control of the private market through regulation.
Right. I forgot how well unregulated healthcare markets and unregulated shadow banking worked.
All we got is the individual, rewarded for labor and risk, to improve the world we live. The government is the problem.
Go build a cabin in Montana, but on your trip to the Big Sky Country don’t take those government built highways.
Real defense spending went up, in both terms of actual dollars and percent of GDP. I believe that each of these these items in diametrically oppose to what you think should be policy.
Since I work for DoD I probably have a somewhat more sophisticated view of DoD spending than you seem to think. Over the short run we should increase certain categories of DoD spending in order to better position ourselves for much lower DoD budgets after the economy recovers.
2sb-
Wrong – it was 4.6% compouded from 1/1/1983 to 1/1/1989. Wrong – 1984 was actually lower than the average – 4.5%.
Maybe you should have your wife check your work – you make a lot of errors.
Hilarious that the right wingers here are itching to spin this to their angle. Apparently you guys cant read thhe writing on the wall.
Anyone implying that this graph proves the idiocy of Arthur Laffer is absolutely tripping, or should go to the Quarterly Journal of Economics because it would be the first real evidence proving that hack and his crackpot curve empirically valid. Here’s a hint; it doesn’t. It proves we need to remove the Bush tax cuts if we expect reasonable revenues, and we also need to cut spending equally as substantially.
All I see here is rightys trying to distort the graph so they can feel justified. I can only assume people like Ed, Ricardo (what an apropos handle, Ricardo was a fool) and Richard Berger are so unsettled by the truth these graphs tell, that the years from 2000 to 2008 were presided over by an idiotic, intellectually devoid fool who bankrupted our economy.
So no, this graph does not show that federal payrolls are too high or that taxes need to be lower. This graph shows that we need to let the bush cuts expire (rather than increase them wholesale right now during the weak economy) and get entitlements under control. The only reason a moron would see this any other way is if their idiotic political bias clouds their head, and makes them feel the need to weave grandiose narratives to justify why they are wrong.
Why else would you be coming up with such terrible, terrible, excuses for why 2sb is supposedly wrong? Any economist will tell you that we are in this situation because we started 2-3 capital-heavy “wars” while cutting taxes to outrageously low levels. This is plainly what the data shows. It also shows that because we deregulated and started this free-market recession, we now have even lower revenues than we did before.
Menzie, 2sb, Anon; keep telling the truth. The rest of you; go take an Econ 101 that isn’t taught by Ron Paul and STFU you clueless intellectually-devoid sillies.
Could you please combine the two figures?
I seem to see a relative increase in Federal revenues correlated with the automatic stabilizers for the resessions of ’74, the double-dip of early 80’s, and ’91. Although these relative increases in revenues may follow a downward trend (early 80’s) or a upward trend (mid 70’s and 90’s), I understand some of the fiscal and monetary choices impacting those opposite trends.
If I (or you) could plot your two figures into one figure, we can perhaps begin to integrate the information of automatic stabilizers vs. policy/monetary changes vs. bubbles into our discussions.
Please, add a link to the first figure to Excel or (preferably) post a plot the two figures together.
It would be facinating!
Thanks.
Chris Clayton: You can get revenue and outlay data from the requisite data on a FY annual basis from the hyperlink in notes to Figure 2. The data comes in a spreadsheet.
Has anyone noticed that the spending and revenue tend to move in opposite directions? Note that during almost every year of the Clinton presidency spending went down, and tax revenue went up. Taxes rates were not raised, except at the start. The increased revenue occurred due to strong economic growth. Notice also the dramatic growth in government spending since 2008, rising from 21% of GDP to 25%. This, I think, is keeping tax revenue from recovering. If you want to eliminate the deficit, cut spending to 19% of GDP and tax revenue will rise dramatically.