How could we boost American employment and GDP? One philosophy is to try to do more of what’s already working.
|
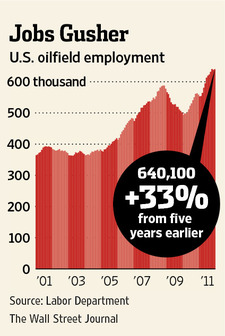
In January 2012, there were 4.7 million fewer Americans working than in January 2007. But one sector that has bucked the trend is oil and gas production. A story in today’s Wall Street Journal notes that if you look at oil and gas extraction and its support activities, oil and gas pipeline construction, and oil drilling and machinery, you’ll find 158,500 more people working today compared to 5 years ago, or a 33% increase.
The article goes on to point out that employment benefits extend well beyond those working in the oil patch itself:
There is no oil and gas production in Idaho, but that doesn’t mean the U.S. energy boom has bypassed this bedroom community west of Boise. Fleetwood Homes of Idaho, a subsidiary of Cavco Industries Inc., has increased production by 25% since last fall at its Nampa factory, hiring 40 workers and adding hours for employees. It is building the extra-insulated “Dakota” model for shipment 1,000 miles east to the Bakken oil field in North Dakota.
And the cheaper natural gas brought on by new drilling methods offers a big competitive advantage to manufacturing firms locating near the energy source:
Last year, Nucor began construction on a new iron upgrader, just a few hundred feet away from the old facility in St. James Parish, La [closed in 2004]. It will cost $750 million to build and create 150 permanent jobs, which the company says will pay an average of $75,000 a year.
What changed? “Shale gas allows that natural gas to be more competitive, and more competitive natural gas enabled us to build this facility in Louisiana instead of building a second facility in Trinidad,” says John Ferriola, Nucor’s president.
I’ve been arguing that even in the midst of a deep recession, it still makes sense to be paying attention to the opportunities available to individual firms to create value added. The goal is not just to “create jobs” but rather to find a way to allow people to make something whose value is greater than the value they place on their own time. Looking at what the government could do to facilitate those opportunities should be on the list of options that the President considers for dealing with America’s ongoing economic challenges.
More STEO:
US crude oil production was up a solid 250 kpbd compared to January 2010. However, Gulf of Mexico (GoM) production was down 310 kbpd during the same period. Production growth was driven by a one-off in Alaska, but more importantly, by US onshore production (ie, shale/tight oil), which was up 443 kbpd. This is quite an impressive performance.
If the GoM can turn around–and it should over the next 18 months or so–and shale oil can keep up the recent pace, then we could see some pretty impressive oil production gains in the next 12-24 months, maybe net as much as 400 kbpd / year. Even on a global scale, that begins to be material.
Now, if the government of Alaska could just get its act together and come up with a workable taxation scheme for the oil industry, US oil production growth could be impressive indeed.
Steven,
Yes, but . . .
My personal preference, where possible, it to use average annual data, since it tends to average out anomalously high–and anomalously low–values.
EIA data show a 2004 (pre-hurricane) production rate of 5.4 mbpd (crude + condensate). After GOM production rebounded in 2009, brining total US production back to 5.4 mbpd, we hit 5.5 mbpd in 2010 and 5.6 mbpd in 2011 (through October).
As I noted the other day, as the (oil) rig count has increased, the net incremental increase per year in crude oil production per rig fell, from 170 bpd per rig in 2010 to 100 bpd per rig in 2011 (through October).
From the point of view of consumers, what is the more important metric, an average net rate of increase of 100 BOPD per drilling rig per year in US crude oil production in 2011, or the annual Brent crude oil price of $111 that we saw in 2011?
If we look at the BP data base (total petroleum liquids), US production rose by 0.3 mbpd from 2004 to 2010, but consumption fell by 1.6 mbpd.
My point is that the dominant trend we are seeing is that the US, and many other developed oil importing countries, are gradually being shut out of the global market for exported oil, as annual Brent crude oil prices doubled from 2005 to 2011, with developing regions like “Chindia” consuming an increasing share of a declining volume of Global Net Exports of oil (GNE).
158000 jobs over five years is about 2670 jobs a month. The US economy needs to grow by 90000 jobs a month to keep up with population growth and at double that rate to reduce unemployment. It is nice to increase domestic production of oil and gas, but it isn’t a game changer in terms of employment.
What is a game changer is that attitudes are changing to “optimism” in the states enjoying the shale boom, as mentioned in the WSJ article. Optimism is a game changer. We need a “can do” spirit not a “do without” manage a declining civilization attitude that seems to be the mantra amongst too many folks.
At the level of the firm, it is indeed correct that doing more of what you do right is an excellent approach. This truth is propounded by Kurt Wright in his classic, Breaking the Rules, and it’s vintage Peter Drucker. Of course developing America’s natural resources is in line with this truth, but as a poster above points out that’s not going to be the game changer.
America’s growth and the jobs that will follow are inhibited at the macro level, specifically by the overt policies and policy omissions of the current administration. Dramatic changes at the policy level are called for if small and mid-size businesses are to shake loose of the uncertainty about the business and regulatory climate that permeates this country. Simply said, the tone in Washington needs to change from anti-business to pro-growth. Otherwise entrepreneurs will (rightly) remain hunkered down husbanding their precious capital and leaving a myriad of nascent new firms stillborn.
We have run out our string on Keynesian fiscal stimulus. Monetary policy is at the limit of its efficaciousness. Neoclassical Keynesian macroeconomics is maxed out and at the margin has become impotent. No wonder a pall is upon the land. A course correction of Queen Mary proportions is what’s called for, and it will not be found in the halls of academic conventional wisdom.
What is necessary at this juncture is fresh thinking and the political will to embark on these specifics: (a) a fresh clearcut policy helping households and residential mortgage holders to more rapidly achieve the deleveraging that will get them back into their comfort zone, (b) an undoing of the anti-business sentiment, (c) directly confronting China on its unfree trade practices including the manipulation of the dollar/yuan rate that has since the mid-90s been responsible for a hollowing out of American manufacturing and its supporting service industries, and (d) relaxation by the Fed and NCUA of regulatory capital constraints on the second tier of the banking system so that community banks and credit unions become more willing to make loans to small and mid-size businesses without having to fear the bank examiners. All of this is of a piece. Think of it as an historically unique four-pronged bone lodged in the throat of the economy, the removal of all parts of the bone being needed before full synergy can be achieved.
The military strategist would not for a moment consider going into battle without the joint operation of ground forces (aiding household deleveraging), armored vehicles (spraying forth pro-growth sentiment), long range artillery (leveling the playing field with China), and air support (rejuvenating the monetary transmission mechanism so front line businesses can go to work). I realize this analogy is far from perfect. However its purpose is a humble one – to enlighten about the need for synergy on more fronts than that of the two conventional ones not-up-to-the-job and manifestly not working.
Jeffrey –
That’s just the point I made on the prior post (Menzie’s): The US is being squeezed out of global markets in a big way.
But US production is, in fact, increasing.
So economics does work. If a commodity is expensive, we’ll use less of it and produce more of it.
This highlights one of the best ways to use that abundant natural gas is returning energy intensive manufacturing to the US to produce for export.
If I may sneak in a related question here. Anybody have an idea of current per barrel costs of extraction for shale oil?
Steven,
No argument of course regarding rising US crude oil production, and based on our export data US crude oil production is even more important than many people think.
However, in my opinion the long term US production decline is not reversed until we exceed the prior annual peak, which for the US would be 9.6 mbpd in 1970.
In other words, until we exceed the prior peak, an increase in production is just a decline in the exponential rate of decline relative to the prior peak.
For some perspective, annual US crude oil production (through 2010):
http://www.eia.gov/dnav/pet/hist_chart/MCRFPUS2a.jpg
Incidentally, note that the average oil well in Texas produced 21 BOPD in 1972 and 6 BOPD in 2010, and the average gas well in Texas in 1972 produced about 900 MCFPD and about 170 MCFPD in Texas in 2010 (Texas RRC). These numbers are probably indicative of the overall sharp decline in average per well production rates that we have seen in the Lower 48.
The US oil industry seems to want to consumers to look at very slowly increasing US crude oil production, as a sign that we don’t have any oil supply problems, and they don’t want consumers to focus on the fact that global crude oil prices doubled from $55 in 2005 to $111 in 2011.
My view of the US economy is that we are experiencing a transformation from an economy focused on “wants” to one focused on “needs,” and the discretionary side of the economy will continue to get crushed.
I outlined my advice for a post-peak economy an an essay called “The ELP Plan,” for Economize, Localize & Produce, which I originally wrote in early 2007. I advised people to “Cut thy spending and get thee to the non-discretionary side of the economy.” I suggested that we would see deflationary trends in the auto, housing and finance sectors, versus generally rising food & energy prices.
Link to ELP Plan article:
http://www.energybulletin.net/stories/2011-08-08/elp-plan-economize-localize-produce
Some additional numbers regarding US oil & gas production:
The average US crude oil production rate in 2011 was about 5.6 mbpd and the average crude oil refinery input in 2011 was about 14.7 mbpd (a peak of 15.5 mbpd in the summer). So, we were reliant on crude oil imports for about 9 mbpd in 2011.
Therefore, for the US not to be reliant on crude oil imports, all we need to is to add another 9 mbpd of crude oil production. In other words, we need to add production that would more or less be equivalent to the peak US production rate of 9.6 mbpd that we saw in 1970.
Note that the average rate of increase in US crude oil production over the past two years was about 0.1 mbpd per year, despite a sizable increase in the number of rigs devoted to drilling for oil.
Incidentally, in an excellent post on The Oil Drum, Art Berman pointed out the discrepancy between EIA data and RRC data regarding Texas gas production (also true for oil). The RRC showed fairly sizable decline in Texas gas production from 2009 to 2010, about 0.4 TCF, while the EIA is showing Texas gas production to be basically flat. Curiously enough, we are seeing a similar gap between the EIA and other data sources, e.g. BP, regarding 2010 Saudi oil production.
Also, Art’s estimate is that to just offset declines in existing natural gas production, the industry has to approximately add the equivalent of all 2010 Texas natural gas production (about 20 BCFPD), every single year.
Breakeven costs for shale/tight oil: Saskatchewan (Canada), shallow Bakken: $25.
Bakken, North Dakora: Probably $65-85 range, but the IRR’s the companies are talking about are in the 30-70% range. So it would appear highly profitable.
To the best of my knowledge, no one has yet tried to calculate full cycle costs for shale/tight oil. Maybe Art Berman will cook something up for us. For now, however, shale/tight oil (unlike shale gas) appears quite profitable.
Jeffrey –
The oil companies are only too aware of the oil supply situation. Why do you think Shell built a $20 bn gas-to-liquids plant in Qatar? Or plonked down $2.2 bn for Alaskan offshore leases? Why do you think BP wants to do viscous at Prudhoe Bay? Why do you think BP was drilling Macondo–known to be a bad well–anyway? Why do you think Statoil is looking for oil in the north Barents Sea? Or BP-TNK looking to develop fields on the remote Yamal Pennisula in north central Russia? Why do you think the Chinese oil companies want to build 5,000 CNG filling stations by 2015? Why is anybody investing in the Canadian oil sands?
Because that’s what we realistically have.
Do you really think the oil companies are so keen on the price versus volume trade-off? They’re getting killed on the downstream side–exactly as peak oil theory would predict.
And guess what, they’re just about to exhaust the consumer surplus on the upstream side. In January, inventory builds were 2.3 mbpd–that’s a lot. Why? Because demand is very soft. It’s catastrophicly weak for the OECD countries, but increasingly thin even for China. Does that say to me that prices are going up? Just the opposite. It says what we’ve been claiming for a long time: that once oil consumption exceeds 4-5% of GDP (depending how you count it), the economy will tend to show mean reversion and reduce consumption rather than paying more. Our calculations suggest that the break price for the US and Europe is around $95 / bbl, for China, around $105-110. So we appear to be at the break point now.
Consider Exxon’s financial performance: Profits are declining even at sky high oil prices. Why? Because costs are increasing at 18% and the carrying capacity of the global economy at 6%. What do you think that will do to capex budgets over time? This is why Chris Skrebowski suggested we might see economic peak oil soon. The year 2012 is entirely possible. If we had an office pool, that’s the year I’d probably pick.
So the oil companies are not so fixed on $110 oil. Like everyone else, they just want to make a profit. Above and below ground constraints are going to make that harder.
As for shale/tight oils: We don’t know how far they will run. The EIA STEO says the revolution is all but over by mid-year 2012. Do I believe that? No. I think we’ll see at least two more pretty spectacular years.
How far does it go? Citi sees shale oil production stabilizing by 2015. CERA see it stabilizing (again, around 2.5 mbpd) in 2020. BP sees that in 2030. I’m inclined to side with Ed Morse over at Citi. I think we see quick growth and then stabilization within a relatively few years, owing primarily to high initial production and subsequent decline rates.
But the results from shale gas are truly spectacular. Conoco has a presentation showing shale gas production going to 45 bcf by 2030. That would be 70% of current domestic production. Will they go that far? I don’t know, but I can tell you the rate of growth has been just unbelievable. On that basis, would I bet against shale oil? Maybe not. Let me withhold judgment for now and let events unfold.
So, overall,we have a mature oil system in which non-shale sources are increasingly difficult to expand. They look pretty peaky, and I personally would not be surprized to see the oil supply roll over this year.
However, we have shale/tight oil production which is new and has been growing rapidly. Today, it is limited to the US and parts of Canada and has been showing very strong growth, but not on a scale to move the global supply outlook. Will this change? Will shale oil be developed broadly elsewhere in the world? One would think so, but I can’t tell you how far or how fast right.
“So economics does work. If a commodity is expensive, we’ll use less of it and produce more of it.”
If you look at gas and oil production in the United States over the last five years, you will see a NEGATIVE correlation between price and production.
Why are you guys so hung up on oil? For the United States, oil is 20th century; natural gas is our 21st century fuel–and not only do we have 100 years supply, but that supply is growing. Unless the Republicans get in the way (the Koch brothers), our oil imports will be falling significantly in the future.
Steven,
Regarding the global oil markets, we are basically arguing over shades of gray, but following is a link taking you to our “Gap” charts, showing the gaps between where we would have been regarding various production/net export metrics at the 2002 to 2005 rates of increase, versus what we actually saw from 2005 to 2010:
http://www.theoildrum.com/node/8729#comment-859013
While it’s true that we have continued to see a very slight rate of increase in global total liquids production (inclusive of low net energy biofuels), we have seen basically flat global crude oil and total petroleum liquids production, with a measurable decline in Global Net Exports (GNE) and in Available Net Exports (ANE).
Regarding the ANE metric, at the 2005 to 2010 rate of increase in the Chindia region’s rate of increase in their net imports as a percentage of GNE, the Chindia region alone would consume 100% of GNE by the year 2030. But again, we appear to just have shades of gray differences here.
Regarding the shale gas plays, I would think that we are going to see some pretty drastic reserve writedowns, especially in the proven undeveloped category. Think of all these companies that have been showing areas between producing gas wells as proven undeveloped, and converting the gas to BOE on a six to one ratio. On a cash flow basis, the ratio this summer could be over fifty to one (global oil prices to one MMBTU, US natural gas).
Also, as Art Berman has pointed out, a big contributor to excess drilling has been the fact that companies can’t afford to get off the shale gas treadmill.
Because of the high decline rates, if shale gas players slow down or stop drilling, they are looking at massive declines in proven reserves. But many companies will be forced to slow or stop their drilling, which will contribute to the large writedowns in proven reserves.
I think that a point that a lot of people are missing is that it is certainly possible, for a while, to show aggregate increasing production, from a group of wells that individually have very high decline rates. A good case history is the DFW Airport Lease, in the Barnett Shale play. The operator drilled about 100 wells. They predicted cumulative production of about 4 BCF per well, with cumulative lease production of one TCF. It looks like the actual cumulative production may be around one BCF per well, with cumulative lease production of about 0.1 TCF. The kicker is that the last data I looked at suggested an accelerating decline rate.
I have noticed, in the panel discussions I’ve witnessed with Art Berman versus an industry cheerleader, the general tendency is for Art to show his work and the numbers regarding specific case histories, while the industry cheerleaders tend to respond with hand waving and borderline ad hominem attacks.
In any case, I’m reminded of the handful of analysts who warned, prior to 2008, about the financial crunch coming, and they were widely derided too, at least initially, e.g., Meredith Whitney, who received death threats, because of her prescient call regarding Citibank.
“How could we boost American employment and GDP? One philosophy is to try to do more of what’s already working.”
Another philosophy would be to reduce our reliance on boom and bust industries.
Stumbling from a busted construction and real estate industry into a booming energy industry provides much-needed jobs for the moment, so there’s clearly a benefit to take under consideration.
Likewise, establishing a bar that opens at 2am next door to a bar that closes at 2am offers the benefit of reducing public drunkenness…for the moment.
BMZ –
High gas prices going into 2008 encouraged a major surge in gas drilling and a wider use of shale gas drilling, which resulted in a large increase in supply and a subsequent drop is price. Now the price is low, and Cheasapeake is looking to shut in 1 bcf per day (about 1.5% of US gas production!).
High oil prices have tended to pull rigs out of gas and into shale/tight oil plays, with a resulting surge in that area, leading to a decline in the price of WTI crude. Oil, of course, is traded globally, while natural gas is not. Thus, the price incentive to drill for oil should continue for some time, allowing for some downdrafts here and there.
The cost of shale gas drilling remains controversial, with Art Berman saying it’s $8-9 / mmbtu, and 70% of operators polled in the Barclays December Survey saying that they would increase gas drilling at $5 / mmbtu–well below Art’s numbers. We may have to wait a full cycle to learn the truth–time may yet prove Art right.
Steven and Jeffery,
When you consider that 90% of all the oil wells ever drilled have been drilled in the Northern Hemisphere what does that say about the potential for oil reserves in the rest of the world? Do you believe that our geological structure is so significantly different from the rest of the world that they do not have similar undiscovered oil reserves?
This is part of the reason I believe that Peak Oil is imaginary paranoia. I have noticed that the Peak Oil advocates have been extremely quiet recently. The oil price drives production and exploration and technical improvements, but only relative to the purchasing power of the dollar.
Steven, if the breakeven costs for shale/tight oil: Saskatchewan (Canada), shallow Bakken is $25 that means that it is headed toward free. In the mid-1990s production costs were around $10 when gold was at $350. Based on today’s debased dollar value that would be equavalent to about a $2.00 cost of production in mid-1990s dollars.
This seems to imply that there will be a significant reduction in production in the near future. Most people will probably be surprised at this statement but oil companies will not be able to make profirs or maintain their stock price at such low levels, especially if usage declines.
JBH, Obama addressed much of those points in his State of the Union address.
I believe him almost as much as I believe Kwame Kilpatrick.
(And I think both you and he are wrong about China.)
Ricardo: “When you consider that 90% of all the oil wells ever drilled have been drilled in the Northern Hemisphere what does that say about the potential for oil reserves in the rest of the world?”
If you exclude Antarctica, which is subject to the Antarctic Treaty, more than 75% of all the land on earth is in the northern hemisphere. Facts are a terrible thing.
Here is another number that will shock you. It is a known fact that employees abuse their benefits by calling in sick on either a Friday or a Monday 40% of the time.
Ricardo,
Consider two case histories, Texas & the North Sea, two regions developed by private companies, using the best available technology, with virtually no restrictions on drilling. Together, they accounted for about 9% of total cumulative global crude oil production through 2005. And following their respective production peaks, we saw very large increases in oil prices.
Texas in particular is interesting. From 1972 to the early Eighties, we saw about a ten fold increase in oil prices, resulting in the largest drilling boom in state history, but Texas crude oil production in 1982 was back to about the same rate as 1962.
In regard to conventional production, what drives the peak profile is the rise and fall of the large oil fields; smaller post-peak fields represent a relatively minor contribution. Following is a graph showing the 1972 Texas peak lined up with the 1999 North Sea peak:
http://i1095.photobucket.com/albums/i475/westexas/Slide1-2.jpg
Based on our mathematical models, North Sea crude oil production in the late Nineties was at about the same stage of conventional depletion that the world was at in 2005. Slowly increasing unconventional production globally has helped, but it has not been sufficient to keep global crude oil production on an upward slope.
What I find astounding is how successful the Cornucopian Crowd has been in persuading people that we don’t have any supply problems, even as global crude oil prices have doubled in six years.
If you will click on the Global crude oil link down the way, you will find the post-2005 global crude oil production graph is remarkably similar to the North Sea graph, from 1996 on. And here is a graph showing North Sea crude production in 1996 lined up with global crude oil production in 2005 (different vertical scales, but very similar production plateaus):
http://i1095.photobucket.com/albums/i475/westexas/Slide3-3.jpg
My approach to this topic has always been quantitative, i.e. what do the numbers show? I suggest that readers take a few minutes to actually look at the charts down the way. Following is my essay on the global petroleum situation:
Recent Crude Oil Prices, Global Production & Net Export Responses, Our Export Model and Two Global Net Export Scenarios
We have seen two annual Brent crude oil price doublings since 2002, from $25 in 2002 to $55 in 2005, and then from $55 in 2005 to $111 in 2011.
In response to the first price doubling, we did of course see a substantial increase across the board in total liquids production (inclusive of biofuels), in total petroleum liquids, in crude + condensate, and in Global Net Exports (GNE) and in Available Net Exports (ANE). GNE and ANE numbers are calculated in terms of total petroleum liquids.
Following is a graph for production, consumption and net exports for the “Export Land” Model (ELM), assuming a production peak in 2000. Note that on the upslope, the rate of increase per year in net exports exceeded the rate of increase in production, but on the downslope, the rate of decline in net exports exceeded the rate of decline in production.
http://i1095.photobucket.com/albums/i475/westexas/Slide1-17.jpg
In response to the second Brent crude oil price doubling (2005 to 2011), we have so far seen a very slow rate of increase in total liquids production (up 0.5%/year from 2005 to 2010), virtually flat total petroleum liquids and and virtually flat C+C production (through 2010), and a 1.3%/year and 2.8%/year respective decline rate in GNE & ANE (through 2010).
Five annual “Gap” charts follow, showing the gaps between where we would have been at the 2002 to 2005 rates of increase, versus the actual data in 2010 (common vertical scale):
EIA Total Liquids (including biofuels):
http://i1095.photobucket.com/albums/i475/westexas/Slide1-18.jpg
BP Total Petroleum Liquids:
http://i1095.photobucket.com/albums/i475/westexas/Slide06.jpg
EIA Crude + Condensate:
http://i1095.photobucket.com/albums/i475/westexas/Slide05.jpg
Global Net Oil Exports (GNE, BP & Minor EIA data, Total Petroleum Liquids):
http://i1095.photobucket.com/albums/i475/westexas/Slide07.jpg
Available Net Exports (GNE less Chindia’s net imports):
http://i1095.photobucket.com/albums/i475/westexas/Slide08.jpg
I would particularly note the difference between the first chart, total liquids, and the last chart, Available Net Exports (ANE).
Following is a graph for production & consumption for the top 33 net oil exporters and for Chindia’s net imports, from 2002 to 2010. As our model predicted, the rate of increase in top 33 net exports (GNE) exceeded the rate of increase in production from 2002 to 2005, but from 2005 to 2010, the rate of decline in net exports exceeded the (very slight) rate of decline in production.
http://i1095.photobucket.com/albums/i475/westexas/Slide09.jpg
If we simply extrapolate the 2005 to 2010 rate of change numbers on this graph, the 2010 to 2020 rate of decline in ANE would accelerate to about 5%/year, and if we extrapolate the other rates of change, but assume a 1%/year production decline rate for the top 33, the ANE decline rate would accelerate to about 8%/year from 2010 to 2020:
0.1%/year Production Decline (2010 to 2020), Top 33 Net Oil Exporters:
http://i1095.photobucket.com/albums/i475/westexas/Slide10-1.jpg
1.0%/year Production Decline (2010 to 2020), Top 33 Net Oil Exporters:
http://i1095.photobucket.com/albums/i475/westexas/Slide11.jpg
I estimate that there are about 157 net oil importing countries in the world. If we extrapolate the Chindia region’s rate of increase in their combined net oil imports, as a percentage of Global Net Exports of oil (GNE), in 19 years just two of these oil importing countries–China & India–would consume 100% of GNE.
I estimate that the current CANE (Cumulative Available Net Exports, post-2005) depletion rate could be on the order of about 8%/year (versus a 2005 to 2010 2.8%/year rate of decline in the volume of ANE). The CANE depletion rate would be the rate that we are consuming the cumulative post-2005 supply of global net exports available to importers other than China & India. Based on a simple model and based on actual case histories, note that it is common for the initial depletion rate to exceed the initial annual rate of decline in net exports.
In round numbers, I estimate that the remaining cumulative supply of (net) exported oil available to importers other than China & India is falling at an annual rate that is about three times the rate that the annual volume of (net) exported oil available to importers other than China & India is falling.
Think of it this way. Let’s assume you have $55,000 in the bank and you withdraw $10,000 the first year, $9,000 the second year, $8,000 the third year and $7,000 the fourth year. The rate of decline in annual withdrawals is 12%/year, but the cash balance in the account is falling at 25%/year. Note that in simple percentage terms, after four withdrawals the withdrawal rate was down by only 30% ($10,000 to $7,000), but the cash balance in the account would have fallen by 62% ($55,000 to $21,000). The annual withdrawal rate is analogous to annual net oil exports and the cash balance in the account at the end of a given year would be analogous to remaining post-peak Cumulative Net Exports.
yes, looking at what govt could do (or not do) encourage projects would be fantastic. not just in energy, but also in mining, agriculture, and other basic industrial sectors. unfortunately we have a regulatory scheme built upon excessive nimby-ism and designed to slow projects like keystone at every turn.
Ricardo (emphasis added): “When you consider that 90% of all the oil wells ever drilled have been drilled in the Northern Hemisphere what does that say about the potential for oil reserves in the rest of the world? Do you believe that our geological structure is so significantly different from the rest of the world that they do not have similar undiscovered oil reserves? This is part of the reason I believe that Peak Oil is imaginary paranoia. I have noticed that the Peak Oil advocates have been extremely quiet recently.”
Again, it helps to look at what the numbers actually show, particularly the chart down the way showing annual US crude oil production:
Some thoughts on US crude oil production
The average US crude oil production rate in 2011 was about 5.6 mbpd and the average crude oil refinery input in 2011 was about 14.7 mbpd (a peak of 15.5 mbpd in the summer). So, we were reliant on crude oil imports for about 9 mbpd in 2011.
Therefore, for the US not to be reliant on crude oil imports, all we need to is to add another 9 mbpd of crude oil production. In other words, we need to add production that would more or less be equivalent to the peak US production rate of 9.6 mbpd that we saw in 1970:
http://www.eia.gov/dnav/pet/hist_chart/MCRFPUS2a.jpg
Or to put it another way, all we need to do is to add the equivalent of Saudi Arabia’s 2005 crude oil production rate. However, some of the shale promoters are suggesting that this is possible by 2020, with the right policies.
Note that the average rate of increase in US crude oil production over the past two years was about 0.1 mbpd per year, despite a sizable increase in the number of rigs devoted to drilling for oil.
If we expand our analysis to the major net oil exporting countries in the Americas and the Caribbean, there are seven of them: Venezuela, Canada, Colombia, Mexico, Argentina, Ecuador, Trinidad & Tobago. Their combined net oil exports in 2005 were 6.0 mbpd, and their combined net exports were 4.8 mbpd in 2010, down 20% in only five years (BP, total petroleum liquids).
Again, one has to hand it to the Cornucopian Crowd. They have been largely successful in convincing consumers not to believe “Their lying eyes.”
(Incidentally, if you were looking for Brazil, they are a net importer of petroleum liquids, with a recent pattern of increasing net petroleum imports.)
Joseph,
For your edification.
Asia 29.5%
Africa 20.4%
North America 16.5%
South America 12.0%
Antarctica 9.2%
Europe 6.8%
Over 80% of the land area of the world is outside of North America.
Australia 5.9%
Jeffrey,
Thanks for taking the time to respond in such detail.
I agree that there is a Cornucopian crowd that believes in infinite oil. These people usually have a belief that the earth is regenerating oil. But there is another group of alarmists who have an illusionary paranoia about peak oil.
If over 80% of the world’s land mass above the oceans has no yet been explored the potential for future oil supplies is significant. This land mass has largely been unexplored because of political constraints. Any oil deposits discovered revert to the government and there is disincentive to invest in exploration.
My point is that politics drives the price of oil much more than supply. You are absolutely correct about the price of crude increasing dramatically since 2000, but world currencies have also lost value in the same proportion relative to gold. The depreciation of currenies has been a very significant driver in the price of oil. Since the inflation of the 1970s when OPEC was educated on how monetary policy destroyed their oil wealth, they have been very diligent in watching the ratio of oil to gold. They will not lose purchasing power again.
My point is that energy will take care of itself if governments will get out of the way, but governments know that energy is critical to society so it will always inject itself into energy decisions, the better to extort from the masses.
Ricardo,
Not to belabor the point, but you were asserting that the North American case history refuted Peak Oil arguments. I posted the link up the thread showing the clear peak that we saw in US crude oil production in 1970.
There have been what are, in the grand scheme of things, some minor restriction on drilling in the US, so let’s look at the Texas & North Sea case histories–two regions developed by private companies, using the best available technology, with virtually no restrictions on drilling.
In other words, Peaks Happen:
http://i1095.photobucket.com/albums/i475/westexas/Slide1-2.jpg
Based on our mathematical models, global conventional production in 2005 was at about the same stage of depletion at which the North Sea was at in 1999.
Despite slowing increasing unconventional production, global crude oil and total petroleum liquids production stopped growing in 2005. We have seen a slight increase in total liquids production, inclusive of low net energy biofuels. However, we have seen measurable and ongoing declines in net exports (GNE & ANE).
I don’t how many ways I can state that at Chindia’s current rate of increase in their net oil imports as a percentage of Global Net Exports (GNE), Chindia’s combined net oil imports alone could consume 100% of GNE in about 19 years, leaving nothing for the other 155 net oil importing countries.
John Hofmeister in early 2008:
http://www.theoildrum.com/node/3760
“We will peak some day, but it won’t be because of a lack of oil.”
John Hofmeister Discovers the “Chindia Factor” On CNBC this morning:
I just witnessed a jaw dropping moment on CNBC. Hofmeister is predicting $5 gasoline in the US by the end of the year. He said that rapidly increasing demand from the developing countries, especially China & India, is far outpacing the very slow net rate of increase in US crude oil production.
Ricardo: Over 80% of the land area of the world is outside of North America.
Ricardo, your previous statement was that 90% of wells were in the Northern Hemisphere. The northern hemisphere and North America are not the same thing, no matter your jingoistic beliefs.
You expressed shock that 90% of wells are in the northern hemisphere, implying that there are vast unexplored areas in the southern hemisphere. I pointed out that it is not really that surprising when you consider that three-fourths of land area (excluding Antarctica) is in the northern hemisphere.
The fallacy in your original statement is along the lines of expressing shock that employees call in sick 40% of the time on Fridays or Mondays.
CNBC video link to Hofmeister interview:
http://video.cnbc.com/gallery/?video=3000072422
Hofmeister:
“What’s really unprecedented, Carl, is the fact that developing countries, especially China and India, have this insatiable need for more oil, and that has not been taken into account as we’ve thought about public policy in this country. So while we may be producing a bit more oil in this country, and while demand is down a bit, on a global basis I’m afraid we face a continuing onslaught of prices creeping ever higher. I hope I’m wrong in this. I’d love to be wrong, but we saw last year’s record gasoline prices through the course of the year, and we’re seeing the same phenomenon starting out this year, and I’m afraid it’s just creeping up and creeping up, and in the meantime you have refineries closing on the east coast because they can’t get the margin they need to stay open.”
ANE Chart: http://i1095.photobucket.com/albums/i475/westexas/Slide08.jpg
Anon,
My original comment about “Northern Hemisphere” was a typo. It should have been North America. Sorry.
About 90% of the oil wells drilled have been drilled in North America. That is because the governments in North America have not significantly confiscated oil profits until recently.
I think the pace of oil production could be increased in many countries, including
– the United States (Alaska, some Federal lands)
– Saudi Arabia
– Iraq
– Brazil
– Venezuela
– Iran
– parts of Africa
– Russia
– Nigeria
So, yes, in principle, production could rise by a meaningful amount. But will all these areas do so at the same time? Unlikely. The gradual decline of non-OPEC production facilitates OPEC acting as a true cartel. Venezuela has 2 mbpd of heavy oil upgraders planned. Do you think Chavez will get them built? Closer to home, Alaska can’t get its act together to reverse the decline of production there. Even Iraq, which should be able to produce at Saudi rates (ie, around 10 mbpd instead of 2.3 mbpd) is really struggling to increase output.
So, yes, in principle, there’s plenty of resource. As a practical matter, the industry is struggling just to hold current output levels.
Jeffery,
I do not deny that there are peaks in any production. There have been peaks in IPods and IPhones and even Beany Babies. My point is that in an economy where price signals are not distorted producers reduce the peaks.
But a peak will not bring down an economy. There are always alternative goods and services that will take the place of those priced out of normal service. Oil is no different. If there is a point where oil supplies become peak becasue they are depleted world wide another souce will move to take the place of oil. But the fact that there is so much unexplored and so unexploited land where oil could be found a normal extrapolation would say that such a time will be centuries in the future.
Rather than fretting over peak supply we should be working toward maximum production. If we produce now rather than later we gain the benifits of compound interest as the goods are produced now rather than later. Current goods are of greater value than future goods.
Keynes was concerned about hoarding but the ultimate in foolish hoarding is the restriction on energy production.
How could we boost American employment and GDP? One philosophy is to try to do more of what’s already working.
I hear you, but couldn’t the same have been said about the internet tech bubble boom in the 1990s and the real estate boom in the 2000s? I don’t think you want to find yourself arguing for an oil & gas led boom of the 2010s. We saw how well those first two boom led expansions turned out. What we probably want is a balanced growth strategy.
it still makes sense to be paying attention to the opportunities available to individual firms to create value added. The goal is not just to “create jobs” but rather to find a way to allow people to make something whose value is greater than the value they place on their own time.
This is really the heart of the issue. Unfortunately, in the case of oil & gas “value added” isn’t quite as straightforward as it is with other commodities like cars, wheat, iPhones, etc. Oil & gas are (at least in principle) exhaustible resources, so producing as much as possible as quickly as possible does not maximize value added over the long run. I’m not at all sure that the market price of gas & oil reflects the fact that these resources are exhaustible. Part of the problem is that even though the amount of oil & gas is finite, the day of reckoning is well beyond the time horizons of the current generation representative agent. I’m thinking of that Tea Party retiree who we see driving his gas guzzling RV down the interstate (with left turn signal blinking). With one foot in the grave and the other on a banana peel, that representative agent is clearly not properly discounting the future. Put another way, we really cannot say that pumping more oil from the ground adds value unless we also account for the fact that a barrel out of the ground today is one less barrel out of the ground tomorrow. What’s needed is a better way to account for resource extraction in our NIPA procedures. To echo Hicks’ maxim, the right way to think about income is to ask how much can you consume today without adversely impacting how much you will be able to consume tomorrow. Until we can answer Hicks’ point I don’t think we can definitively say that pumping more oil adds value over the long run.
To quote Dickens, “It was the best of times, it was the worst of times.”
It’s really the best of times for US oil producers–flat global crude oil production, declining Global Net Exports (GNE), with Chindia consuming an increasing share of a declining volume of GNE, all leading to high global crude oil prices–while US producers are able to show increasing crude oil production. But it was the worst of times for US consumers, as global crude oil prices doubled in six years.
Following a link to what is, IMO, a brilliant essay by Kurt Cobb that shows the entire economy being supported by the food & energy producers:
http://www.energybulletin.net/node/32718
Upside Down Economics
The problem I foresee is that if food & energy (especially oil) producers are the only healthy portions of the US economy, what happens as consumers become increasingly angry at rising food & energy prices, especially oil prices, as they compare rising gasoline prices to the promises from the oil industry* that we don’t have to worry about supply problems for decades to come?
Having said that, my “ELP Plan” advice from five years ago was as follows, “Cut thy spending and get thee to the non-discretionary side of the economy,” but I wonder if the “Haves” are increasing defined as the net food & energy producers and the “Have-nots” are increasingly defined as the net food & energy consumers, what happens to society in future years?
The alleged comment by Marie Antoinette to “Let them (hungry French people) eat cake,” didn’t end so well for her.
*ExxonMobil Advertisement in New York Times, June 2, 2006:
“Contrary to the theory, oil production shows no signs of a peak . . . Oil is a finite resource, but because it is so incredibly large, a peak will not occur this year, next year, or for decades to come”
Steven,
In the interest of full disclosure, it seems likely that the total annual EIA data for 2011 are going to show a per rig per year increase in net US crude oil production in 2011 that will be comparable to 2010, in the range of about 170 bpd per rig per year. I was using 100 bpd per rig per year based on annual 2011 data through October.