The magic asterisk, that is (With apologies to Bruce Lee [0] and David Stockman). How the circle can be squared, in the Romney tax plan: assume a massive supply side response! [1]
Figure 1 shows exactly how Govenor Romney’s math can add up.
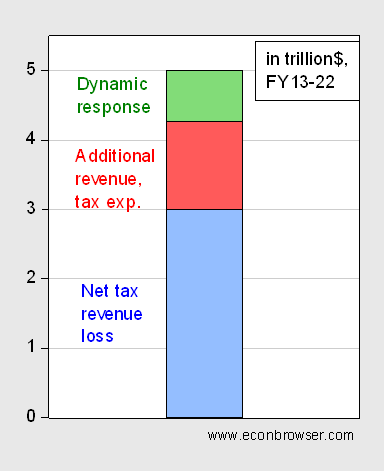
Figure 1: Total revenue loss from individual tax rate reduction, corporate tax reduction, ending capital gains and dividend tax elimination for incomes below $200K, ending AMT and estate tax = $5 trillion, FY2013-22; additional revenue from eliminating tax expenditures, but allowing individual deductions up to $25K (red bar), dynamic macroeconomic response according to Mankiw-Weinzerl (2006) model extrapolated from TPC (green bar), and net tax revenue loss (blue bar). Source: For total tax revenue loss, and additional tax revenue from eliminating deductions, Center for a Responsible Federal Budget; and for dynamic response, TPC, pp. 14-15, extrapolated to FY2013-22 loss.
Even allowing for a dynamic response due to lower taxes, somehow there is a $3 trillion missing, in order to achieve revenue neutrality in the tax plan. Thus, the magic asterisk in this case must involve praying for divine intervention, and a growth spurt that yields additional tax revenue equal to the size of the blue bar(!).
If the Governor were to eliminate all deductions, then the degree of “magic-ness” of the asterisk is reduced, by about $700 billion, to a mere $2.3 trillion.
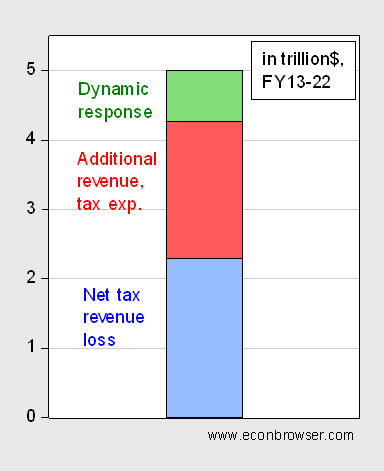
Figure 2: Total revenue loss from individual tax rate reduction, corporate tax reduction, ending capital gains and dividend tax elimination for incomes below $200K, ending AMT and estate tax = $5 trillion, FY2013-22; additional revenue from eliminating all tax expenditures (red bar), dynamic macroeconomic response according to Mankiw-Weinzerl (2006) model extrapolated from TPC (green bar), and net tax revenue loss (blue bar). Source: For total tax revenue loss, and additional tax revenue from eliminating deductions, Center for a Responsible Federal Budget; and for dynamic response, TPC, pp. 14-15, extrapolated to FY2013-22 loss.
So, the next time you hear Governor Romney assert that the numbers add up, ask exactly how much of the adding up is attributable to the supply side response.
Menzie In Mankiw’s model he divides the dynamic response between capital investment and labor. He also assumes a neo-classical model…which is to say he assumes away existing slack in the economy. I’m hoping someone can explain how these dynamic responses work (or don’t work) when the economy is already sitting on excess capital and demand for labor is so weak that we are several years away from full employment. The only dyanamic resonse I can see about Romney’s tax cuts would come from the aggregate demand side; but in that case why not increase spending and get more fiscal bang for the buck?
Wait a minute.
Isn’t the author of this blog supporting President Obama, who strangled Simpson-Bowles in its crib, and who has never proposed anything close to a path to fiscal sustainability?
Is there some kind of double standard going on here?
Menzie
Although your econometric posts can be extremely complicated, your political post remain simplistic, but that is okay because others can play the same game. So lets examine another simple model to evaluate a Romney tax plan compared to the results of Obama plans.
Start with a simplified figure for GDP at the start of the next Presidential term, 16 trillion. Now use a simple annual growth equation P = C(1 + i)^10 (i – annual growth, for ten years).
Next the approximate average growth under the Obama policy of 2%, so assume it will remain. The above equation results in a GDP of 19.5 trillion after the ten years.
Now lets assume that the Romney plan can achieve 4% GDP growth as demonstrated by past similar tax policies of Kennedy-Johnson or Reagan. Above equation results in a GDP of 23.7 trillion after the ten years.
It would be easy to stop at that and ask which result you would prefer, but I assume like Obama you are more interested in perceived fairness than wealth building.
So lets you those numbers to produce a Federal budget. Obama seems to like the budget to be 22% of GDP.
19.5 * 0.22 = 4.29 T
But to achieve that same Federal budget under the Romney assumption
4.29 / 23.7 = .181 0r 18.1% of GDP.
Menzie, growth policies are not insignificant as your post implies. They result in a richer US, a higher achievable Federal budget, and each individual able to retain more of what they earn.
“who strangled Simpson-Bowles in its crib?”
Some guy named Ryan voted against it?
I have read there was no committee report. The B-S co-chairs published theirs but it was not accepted by the whole committee.
One could say it, The B-S Committee, was designed to fail. Who knows?
Obama may have strangled it in the crib, but Ryan killed it in utero.
Ste
Ed Hanson: You are free to assume 4% growth (and smoke whatever you wish in order to come to that conclusion). I can assume I will win a Nobel Prize in economics. Assuming it doesn’t make it plausible. But I welcome your documentation of the model that will yield 4% growth in response to the tax cuts indicated in the Romney plan (insofar as we know).
By the way, the econometrics are imbedded in the numbers, if you had read the TPC report, and the references to the studies.
Menzie
The economy will grow faster with permanent across the board tax rate cuts than it will with tax rate increases and temporary tax cuts for some. Reliance on short term Phillips curve spending and money creation is just, that short term.
I will stand by my 4% assumption. It certainly has history behind it. Besides the two periods I mentioned above, the Harding-Coolidge tax rate reductions also lead to my conclusion.
How deep is your historic memory. Does it go as far as pass the stimulus and unemployment will stay below 8%?
Menzie, policies close to what you would recommend have been tried in this administration, the results were putrid. Slow growth, high unemployment numbers, very low work force percentage, huge deficits as far as the eye can see, as well as the highest poverty rate in decades.
I suggest instead of questioning the cause of my assumptions, you look closer at your own. While it can be normal to make mistakes, it is unfortunate not to learn from it. A professor of your stature should have no problem initiating a correspondence with a real Nobel Prize winner, Robert Mundell. In the past he has shown great patience discussing his supply-side knowledge with those who would listen. I will make the assumption that you can listen.
2slugbaits: Typically, these public finance models are assessed at full employment — so you have to pretend you are judging things at full employment. You are right that reality would likely have the important effects come from the demand side over the horizons mentioned.
Thing I’d like to see is people, particularly candidates and winners, put up some collateral for their promises. We’re inundated with nonsensical numbers (that believers seek to justify but that’s what believers do). The solution is to create actual penalties. So if Romney is elected, then I think we should as a nation agree to his plans and then if they generate a huge deficit and slow growth he has to give up his fortune. Or leave the country. Or have a pre-written resignation accepted. There has to be a consequence for lying other than thinking maybe God will judge the person harshly in the afterlife (and believers are kings of “ends justify means” thinking so they believe lies are ok).
Think about how to make real consequence. I’m sick of the pathetic lying.
BTW, my favorite truly awful ad is for some race in New Hampshire which I get ads for on TV. Don’t even know what it’s for but the ad says X lives in a half million dollar house and pays no real estate taxes but wants NH people to pay more in taxes. I was really curious after seeing this thing 100 times: how can a person own a home and not pay taxes on it? Answer: found in the Concord NH Monitor – their local paper – that she doesn’t own the home, that it’s owned by the school where her husband is headmaster (Exeter) and thus, of course, the school pays whatever taxes may be due on it and she pays the rental value as income.
Menzie, what we saw in the final debate is, Romney lying about what he would do, and Obama lying about what he did do. Should I stay tuned for tomorrow’s devastating critique of Obama’s record? Or shall we just cue the crickets? What is the end game and long term effects on young people of QE to infinity? When Greece meets printing press, what does history show will happen? Seriously, Menzie. You have an obligation to the kids in your clssses and the parents who partly pay your bills to be a little less transparently in the tank for the “O”.
EdH,
Great post! Menzie is skewered on his on Sudoku!
Remember that Menzie is an adherent to the new normal. He is skeptical that growth can average 4% per year (in a Keynesian world he is probably right).
I found these numbers for US GDP growth by decade from 1800-2000. Pretty interesting. It appears the new normal is closer to the old recession.
1800: 3.6
1810: 3.1
1820: 4.1
1830: 4.2
1840: 5.1
1850: 6.4
1860: 3.3
1870: 5.7
1880: 5.2
1890: 2.9
1900: 2.4
1910: 3.4
1920: 4.2
1930: 2.0
1940: 5.8
1950: 3.7
1960: 5.1
1970: 3.7
1980: 3.5
1990: 3.3
1996-2006: 3.4
1800-2000: 4.1
Both Ed H and anonymous have asserted, contrary to evidence, that lower tax rates would result in higher growth. This is, of course, a form of question begging, but a particularly pathetic form. Normally, when begging a question, you try to sneak the conclusion into the assumption in an unfalsifiable way. In this case, the assumption has already been falsified. The evidence simply isn’t there to claim that tax cuts from current levels will provide ANY increase in the pace of economic growth. Ed’s overstep, assuming that a tax cut from current low rates could double the pace of growth, seems better designed to draw laughter than agreement. Makes me wonder whether “Hanson” is a nom de plume for Axelrod.
Thing I’d like to see is people, particularly candidates and winners, put up some collateral for their promises.
Great idea Jonathan. Can we make it retroactive to January 2008? 😉
Tear down Romeny’s plan, but show me an Obama plan, other than the outrageous plan rejected by his own party, that supports the level of spending he proposes while at the same time balancing the budget in 10 years, all without raising taxes on the middle class.
“US is the Bright Spot”
http://www.calculatedriskblog.com/2012/10/the-us-bright-spot.html
Hmmm. Let us see. What has changed in the US compared to other countries in the last year? Ummm, maybe oil production is up 1 mbpd?
Could be a very “Interesting” election. I’ve been reading about the possibility of an Electoral College tie (269 to 269, 270 needed to win). In the event neither candidate gets 270, the House picks the President, the Senate picks the VP. So, in the event of a tie, we might see a Romney/Biden administration. However, talk about one person having an effect.
In the event of a tie, one “Faithless Elector” could swing the entire election to either candidate.
Some links:
Fivethirtyeight blog:
http://fivethirtyeight.blogs.nytimes.com/2012/10/23/oct-22-ohio-has-50-50-chance-of-deciding-election/#more-36534
Hoping election doesn’t end in Electoral College tie:
http://www.thedailyjournal.com/article/20121022/OPINION02/310220021
Faithless Electors:
http://en.wikipedia.org/wiki/Faithless_elector
Anonymous got his talking points and he/she’s sticking with them.
Same thing happens all say on TV. A rabid John Sununu or Rudy Guiliani backs up the dumptruck of discredited talking points, spews them all out, and then wth can you do about that but maybe pick one up by the corner and try to shed some light on it. Here’s one of my favorites:
“How deep is your historic memory. Does it go as far as pass the stimulus and unemployment will stay below 8%?”
Right. Great stuff. So yes, a stimulus too small and too oriented towards … TAX CUTS … and replacement spending for state contraction doesn’t fix what becomes later known as the Great Recession. Extention of the Bush tax cuts in total, the payroll tax cuts, the tax cuts of the stimulus, our whole response loaded up on the tax cut side and we get tepid growth numbers and tepid employment numbers. No surprise, we had this same result during Bush II!
So what about your historic memory? Sounds like a bad case of Romnesia to me.
I am beginning to think Ricardo is anne from Mark Thoma’s blog.
Apparently Ricardo didn’t notice that according to his own figures, GDP growth was *much* higher in the ‘Keynsian era’. 1940: 5.8, 1950 3.7, 1960: 5.1, 1970: 3.7.
Post Ronald Reagan: 3.4%
In the aftermath of the Bush II tax cuts, which are still in effect, we have the worst decade since the Great Depression. Any reasonable person could only conclude that cuts in top marginal tax rates are totally swamped by other effects. Of course, Hanson and Ricardo won’t conclude that because they just know it isn’t true no matter what the real world data shows.
Who is Mark Thoma?
Ricardo: It would be useful to know where your series comes from. I could not replicate the decadal GDP annual growth rates, using Measuring Worth series (Johnston-Williamson), nor BEA series for the more recent period. In general, post 1900, I obtain lower growth rates.
Something else interesting about Ricardo’s series; there was no US income tax at all from 1895 to 1913 and according to Ricardo, that period had the slowest GDP growth in US history. Again, if all one had to go on was Ricardo’s series, one would have to conclude that the strongest GDP growth occurs when top marginal rates are in the range of 70% to 90%.
Robert W,
Of course, we don’t need Ricardo’s series. Growth data of known origin also show that periods of high taxation in the US are also periods of high growth, while periods of low taxation are periods of low growth. That’s what makes assertions by Ricardo, Ed H and the anonymous guy who sides with Ed H so ridiculous. They are arguing that bleeding the patient will produce better health. They will argue that taxation is analogous to bleeding, but that isn’t what the evidence shows.
Menzie,
Thanks for the link. I used the Annualized Growth Rate calculator to determine the following.
US Growth Rate 1800-2000
Nominal GDP 5.10%
Real GDP 3.73%
US Growth Rate 1900-2000
Nominal GDP 6.38%
Real GDP 3.33%
US Growth Rate 1950-2000
Nominal GDP 7.30%
Real GDP 3.50%
US Growth Rate 1970-2000
Nominal GDP 7.82%
Real GDP 3.27%
I think EdH would live with a 3.7% growth rate. It is instructive that the farther the US got from a gold standard the broader the gap between Nominal GDP and Real GDP became. Inflation anyone.
But if you want to see one that is really eye popping check this out while the US was on the gold standard without a central bank for most of the period.
US Growth Rate 1800-1900
Nominal GDP 3.84%
Real GDP 4.13%
Modern monetarist eyes would say this was horrible because it demonstrates deflation, but in truth it demonstrates the miracle of innovation and technological improvement. Real GDP at 4.13%?! I know EdH will live with that.
So what do you want? A new normal growth rate below 2% or a gold standard growth rate of 4.13%. LOL!!
The Obama Plan is Here! The Obama Plan is Here! (Hat tip to Steve Martin in “The Jerk” shouting “The new phone books are here!”)
The President’s plan will build on that success, creating 1 million new manufacturing jobs by 2016.
But, as 2slugs notes, there is little demand for labor –
I’m hoping someone can explain how these dynamic responses work (or don’t work) when the economy is already sitting on excess capital and demand for labor is so weak that we are several years away from full employment.
…his plans to expand domestic energy production will support more than 600,000 jobs in the natural gas sector alone.
I wonder if Obama has factored in the EPA’s anti-fracking inquisition on states rights to monitor fracking? Actions speak louder than words.
Growing Small Businesses.
Obama copy-catting Romeny. Did you notice Obama glancing at Romney’s note pad every time Romney wrote something during the debate? I am surprised Obama wasn’t wearing a baseball cap to hide his eyes while “scoping” Romney’s notes!
Obama will strengthen our schools by recruiting 100,000 math and science teachers, training 2 million workers for real jobs at community colleges, and cutting tuition growth in half.
More teachers does not equal better schools and according to 2slugs there isn’t enough demand for labor to add all these “real” jobs. I think Obama used the term “real” job to differentiate then from the pretend jobs that were created or saved in the stimulus packages.
Cutting The Deficit By More Than $4 Trillion I believe that came from his legislation that his own party rejected. But, how would Obama accomplish this massive cut? Well…By eliminating special loopholes and tax breaks that benefit big business and the wealthiest – as part of a balanced deficit reduction plan that also cuts spending we can’t afford
Really? Tax the wealthy and cut spending “we can’t afford”? That adds up to a $4Trillion cut? I wonder what the President thinks we can’t afford? No middle class tax increase? How? Where are the cries for more details like there were for Romney?!
There are more claims without details to back them up at Politico – http://www.politico.com/news/stories/1012/82773.html
All in good fun my friends. Just pointing out the hypocrisy.