Here’s the introduction to a new paper I just finished:
This year the oil industry celebrated its 155th birthday, continuing a rich history of booms, busts and dramatic technological changes. Many old hands in the oil patch may view recent developments as a continuation of the same old story, wondering if the high prices of the last decade will prove to be another transient cycle with which technological advances will again eventually catch up. But there have been some dramatic changes over the last decade that could mark a major turning point in the history of the world’s use of this key energy source. In this article I review five of the ways in which the world of energy may have changed forever.
Below I provide a summary of the paper’s five main conclusions along with a few of the figures from the paper.
1. World oil demand is now driven by the emerging economies.
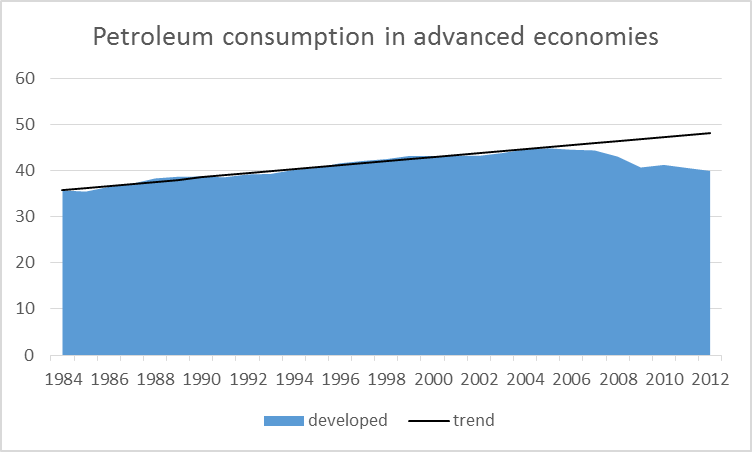
Petroleum consumption in the U.S., Canada, Europe and Japan, 1984-2012, in millions of barrels per day. Black: linear trend estimated 1984-2005. Data source: EIA. Figure taken from Hamilton (2014).
2. Growth in production since 2005 has come from lower-quality hydrocarbons.
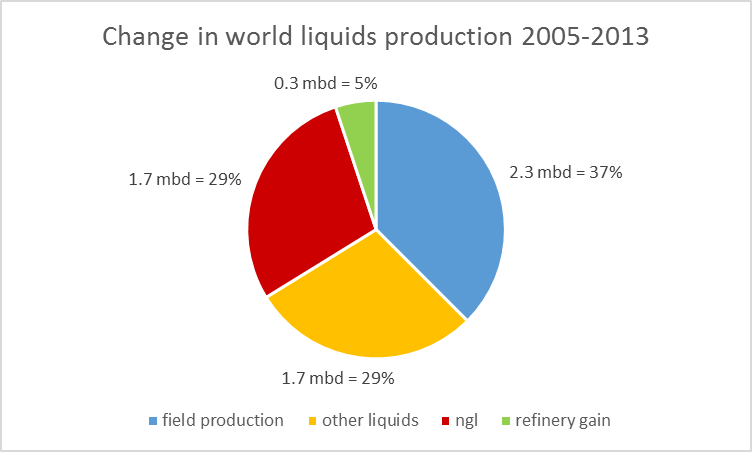
Amount of increase total liquids production between 2005 and 2013 that is accounted for by various components. Data source: EIA. Figure taken from Hamilton (2014).
3. Stagnating world production of crude oil meant significantly higher prices.
![Prices of different fuels on a barrel-of-oil-BTU equivalent basis (end of week values, Jan 10, 1997 to Jul 3, 2014). Oil: dollars per barrel of West Texas Intermediate, from EIA. Propane: FOB spot price in Mont Belvieu, TX [(dollars per gallon) x (1 gallon/42 barrels) x (1 barrel/3.836 mBTU) x 5.8], from EIA. Ethane: FOB spot price in Mont Belvieu, TX [(dollars per gallon) x (1 gallon/42 barrels) x (1 barrel/3.082 mBTU) x 5.8], from DataStream. Natural gas: Henry Hub spot price [(dollars per mBTU) x 5.8], from EIA. Figure taken from Hamilton (2014).](https://econbrowser.com/wp-content/uploads/2014/07/iaee3.png)
Prices of different fuels on a barrel-of-oil-BTU equivalent basis (end of week values, Jan 10, 1997 to Jul 3, 2014). Oil: dollars per barrel of West Texas Intermediate, from EIA. Propane: FOB spot price in Mont Belvieu, TX [(dollars per gallon) x (1 gallon/42 barrels) x (1 barrel/3.836 mBTU) x 5.8], from EIA. Ethane: FOB spot price in Mont Belvieu, TX [(dollars per gallon) x (1 gallon/42 barrels) x (1 barrel/3.082 mBTU) x 5.8], from DataStream. Natural gas: Henry Hub spot price [(dollars per mBTU) x 5.8], from EIA. Figure taken from Hamilton (2014).
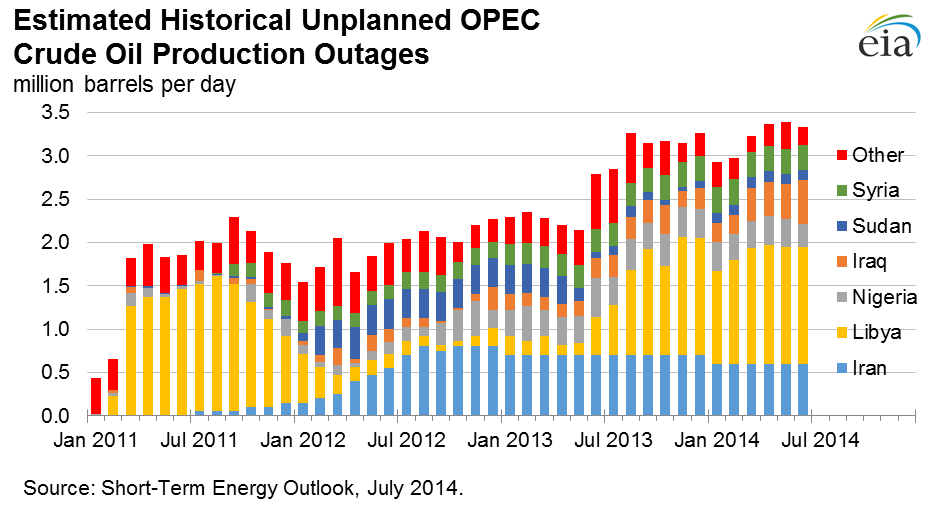
Global oil supply disruptions, Jan 2011 to June 2014. Source: constructed by the author from data provided in EIA, Short-Term Energy Outlook. Figure taken from Hamilton (2014).
5. Geological limitations are another reason that world oil production stagnated.
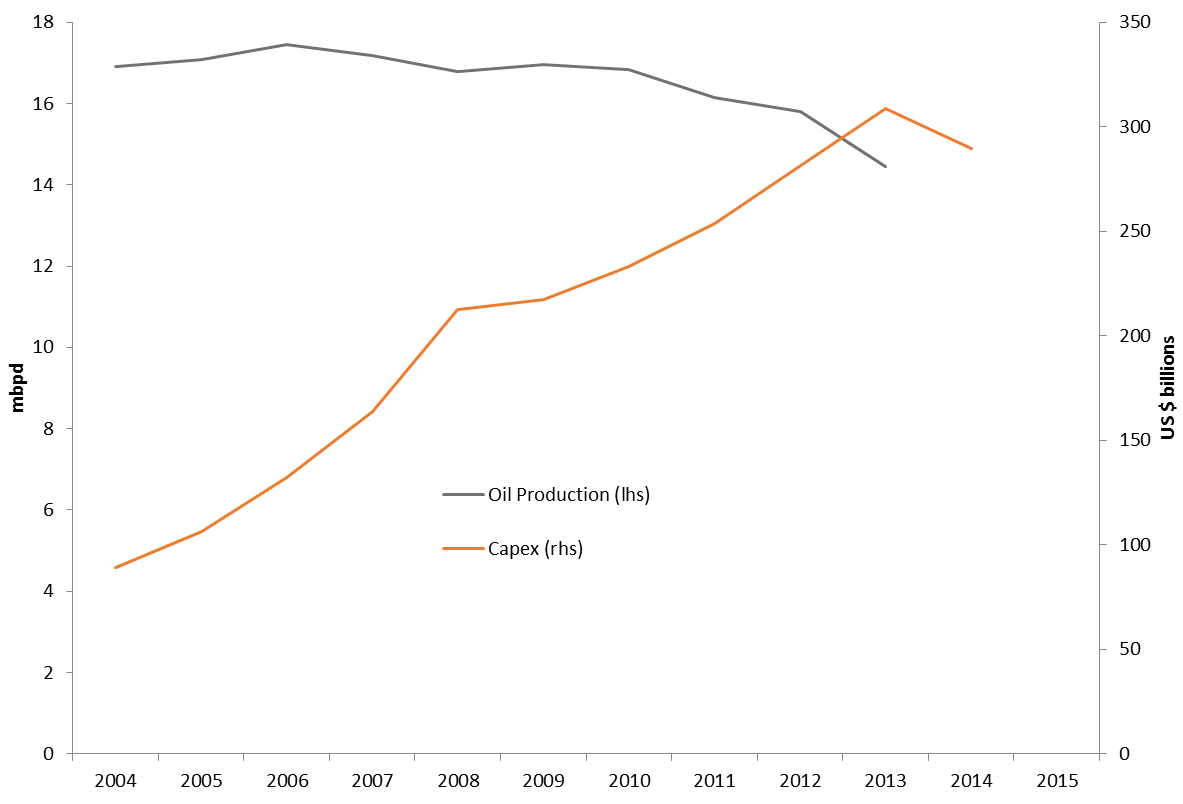
Total oil production and capital expenditures for the major international oil companies, 2004-2013. Includes XOM, RDS, BP, CVX, STO, TOT, PBR, PTR, ENI, REP, and BG. Source: updated from Kopits (2014). Figure taken from Hamilton (2014).
And here is the paper’s conclusion:
Although the oil industry has a long history of temporary booms followed by busts, I do not expect the current episode to end as one more chapter in that familiar story. The run-up of oil prices over the last decade resulted from strong growth of demand from emerging economies confronting limited physical potential to increase production from conventional sources. Certainly a change in those fundamentals could shift the equation dramatically. If China were to face a financial crisis, or if peace and stability were suddenly to break out in the Middle East and North Africa, a sharp drop in oil prices would be expected. But even if such events were to occur, the emerging economies would surely subsequently resume their growth, in which case any gains in production from Libya or Iraq would only buy a few more years. If the oil industry does experience another price cycle arising from such developments, any collapse in oil prices would be short-lived.
My conclusion is that hundred-dollar oil is here to stay.
can emerging economies continue to grow at $100 barrel oil? or will they need to explore other options which are more reliable and cheaper in the long run than the current prospects of oil? if what you imply is true, and oil will only rise in trend long term, it probably opens the door to non-oil sources for the emerging markets. unless you can justify an emerging market can continue to grow under increasing energy costs. or demand from advanced economies drops enough to assist the emerging market growth.
What has happened is clear. Normalized liquids consumption for China, India, (2005) Top 33 Net Oil Exporters and the US from 2002 to 2012, versus annual Brent crude oil prices:
http://i1095.photobucket.com/albums/i475/westexas/Slide14_zpsb2fe0f1a.jpg
China was up to 204% of 2002 consumption in 2013 (India and the Top 33 also showed increases). The US also showed an increase, up to 96% of the 2002 level, but US consumption remained well below both the 2002 and 2005 levels.
What is less clear is what will happen, and what I call the $64 Trillion question is what happens from 2012 to 2022, and in future years, but it would appear that we continued to slide, in 2013, toward a point in time that we cannot arrive at, i.e., when China & India alone would theoretically consume 100% of GNE. At the 2005 to 2012 rate of decline in the GNE/CNI Ratio, China and India only would theoretically consume 100% of GNE in the year 2030, theoretically leaving no net oil exports available to about 155 net importing countries.
In any case, here is the problem: Given an inevitable ongoing decline in GNE, unless the Chindia region cuts their consumption of GNE (their net imports of oil, CNI) at the same rate as the rate of decline in GNE, or at a faster rate, the resulting ANE decline rate will exceed the GNE decline rate and the ANE decline rate will accelerate with time (on a year over year basis).
ANE–the volume of Global Net Exports of oil available to importers other than China & India–has already fallen from 41 mbpd in 2005 to 35 mbpd in 2012 (and I estimate it was down to between 33 and 34 mbpd in 2013).
Some definitions:
Net Exports = Production of total petroleum liquids + other liquids less total liquids consumption (EIA data base)
Global Net Exports (GNE) = Combined net exports from (2005) Top 33 net oil exporters, total petroleum liquids + other liquids (EIA)
Available Net Exports (ANE) = GNE less Chindia’s Net Imports (CNI)
And in support of Chart #2 above, a copy of my reply to the previous article follows. Note that field production above means crude + condensate (C+C).
Did Global Crude Oil Production* Peak in 2005?
*45 and lower API gravity crude oil, not crude + condensate
In my opinion, it is very likely that actual global crude oil production (45 or lower API gravity crude oil) peaked in 2005, while global natural gas production and associated liquids (condensates & natural gas liquids) have so far continued to increase.
I’ve always thought it odd that when we ask for the price of oil, we get the price of 45 or lower API gravity crude oil, but when we ask for the volume of oil, we get some combination of crude oil + condensate + NGL (Natural Gas Liquids) + biofuels + refinery gains.
This is analogous to asking a butcher for the price of beef, and he gives you the price of steak, but if you ask him how much beef he has on hand, he gives you total pounds of steak + roast + ground beef. Shouldn’t the price of an item directly relate to the quantity of the item being priced, and not to the quantity of the item plus the quantity of (partial) substitutes?
In any case, the closest measure of global crude oil production that we have is the EIA data base that tracts global Crude + Condensate (C+C). In regard to this data base, a key question is the ratio of global condensate to C+C production. Unfortunately, we don’t appear to have any global data on the Condensate/(C+C) Ratio. Note that when the EIA discusses “crude oil” they are talking about C+C.
Insofar as I know, the only complete Condensate/(C+C) data base, from one agency, is the Texas RRC data base for Texas, which showed that the Texas Condensate/(C+C) ratio increased from 11.1% in 2005 to 15.4% in 2012. The 2013 ratio (more subject to revision than the 2012 data) shows that the 2013 ratio fell slightly, down to 14.7%, which probably reflects more focus on the crude oil prone areas in the Eagle Ford. The EIA shows that Texas marketed gas production increased at 5%/year from 2005 to 2012, versus a 13%/year rate of increase in Condensate production. So, Texas condensate production increased 2.6 times faster than Texas marketed gas production increased, from 2005 to 2012.
The EIA shows that global dry gas production increased at 2.8%/year from 2005 to 2012, a 22% increase in seven years. If the increase in global condensate production only matched the increase in global gas production, global condensate production would be up by 22% in seven years. If global condensate production matched the 2005 to 2012 Texas rates of change (relative to the global increase in gas production), global condensate production would be up by about 67% in seven years.
In any case, we don’t know by what percentage that global condensate production increased from 2005 to 2012. What we do know is that global C+C production increased at only 0.4%/year from 2005 to 2012. In my opinion, the only reasonable conclusion is that rising condensate production–a byproduct of natural gas production–accounted for virtually all of the increase in global C+C production from 2005 to 2012, which implies that actual global crude oil production –from crude oil reservoirs–was flat to down from 2005 to 2012, as annual Brent crude oil prices doubled from $55 in 2005 to $112 in 2012.
The following chart shows normalized global gas, NGL and C+C production from 2002 to 2012 (2005 values = 100%).
http://i1095.photobucket.com/albums/i475/westexas/Slide1_zps45f11d98.jpg
The following chart shows estimated normalized global condensate and crude oil production from 2002 to 2012 (2005 values = 100%). I’m assuming that the global Condensate/(C+C) Ratio was about 10% for 2002 to 2005 (versus 11% for Texas in 2005), and then I (conservatively) assume that condensate increased at the same rate as global gas production from 2005 to 2012, which is a much lower rate of increase in condensate (relative to the increase in gas production) than what we saw in Texas from 2005 to 2012.
http://i1095.photobucket.com/albums/i475/westexas/Slide2_zpse294f080.jpg
Based on foregoing assumptions, I estimate that actual annual global crude oil production (45 or lower API gravity crude oil) increased
from about 60 mbpd (million barrels per day) in 2002 to about 67 mbpd in 2005, as annual Brent crude oil prices doubled from $25 in
2002 to $55 in 2005.
At the (estimated) 2002 to 2005 rate of increase in global crude oil production, global crude oil production would have been up to
about 90 mbpd in 2013.
As annual Brent crude oil prices doubled again, from $55 in 2005 to an average of about $110 for 2011 to 2013 inclusive, I estimate
that annual global crude oil production did not materially exceed about 67 mbpd, and probably averaged about 66 mbpd for 2006 to
2013 inclusive.
Jeffrey, if possible, perhaps you could show data in per capita terms, as this is a critical factor when examining overall systemic net exergetic stock and flows at scale and change rates, i.e., a more comprehensive measure of an economy’s capacity to sustain (or not) the necessary work to support a given population.
Thanks.
Here’s the Wikipedia entry on global population trends:
http://en.wikipedia.org/wiki/World_population
It would appear that the net increase in global population from 2005 to 2013 was from about 6.6 billion to 7.2 billion (a 1.1%/year net rate of increase). Basically, in the four year time periods between US presidential elections, the net increase in global population is approximately equivalent to current US population.
Based on the seven year 2005 to 2012 rate of decline in the (2005) Top 33 net exporters’ ECI Ratio (3.75 to 3.26, a rate of decline of 2%/year), I estimate that post-2005 Global CNE (Cumulative Net Exports) were about 538 Gb, with about 113 Gb (21%) having been shipped from 2006 to 2012 inclusive. I estimate that remaining post-2005 Global CNE were down to about 76% at the end of 2013.
So, I estimate that as the global population increased by 9% from 2005 to 2013, we burned through about one-fourth of the total remaining volume of Global Net Exports of oil.
Incidentally, I estimate that the rate of depletion of our remaining supply of Global CNE accelerated from about 3.0%/year in 2006 to 3.8%/year in 2013.
Thank you, sir.
Since 2005, world “total oil supply” is down 3% per capita: http://tinyurl.com/mmaw5kr
Crude + C is down 6% per capita: http://tinyurl.com/mu8fkay
World real GDP per capita has grown 1%/year since 2005 (half the long-term rate) and 0.6%/year since 2007 (30% of the long-term rate):
http://data.worldbank.org/indicator/NY.GDP.PCAP.KD/countries?display=graph
But in PPP terms, growth has been at 1.9%/year since 2008, albeit HEAVILY skewed by growth in China vs. growth near 0% for 65-70% of world GDP:
http://data.worldbank.org/indicator/NY.GDP.PCAP.PP.KD/countries/1W-CN-US-XC-JP-BR?display=graph
US refineries are running all out: http://www.eia.gov/todayinenergy/detail.cfm?id=17251
China uses a lot of coal:
Chart: http://www.eia.gov/countries/analysisbriefs/China/images/total_energy_consumption.png
Perhaps, the U.S. should be using more:
Chart: http://barryonenergy.files.wordpress.com/2013/06/figure-1a.jpg
Clean coal technologies:
http://americaspower.org/clean-coal-technologies
Coal is expensive: occupational health costs, CO2, sulfur/acid rain, mercury in food, water consumption, adding up to $.18 per kWh ($345B/year):
“The United States’ reliance on coal to generate almost half of its electricity, costs the economy about $345 billion a year in hidden expenses not borne by miners or utilities, including health problems in mining communities and pollution around power plants, a study found.
Those costs would effectively triple the price of electricity produced by coal-fired plants, which are prevalent in part due to their low cost of operation, the study led by a Harvard University researcher found.
“This is not borne by the coal industry, this is borne by us, in our taxes,” said Paul Epstein, a Harvard Medical School instructor and the associate director of its Center for Health and the Global Environment, the study’s lead author.
“The public cost is far greater than the cost of the coal itself. The impacts of this industry go way beyond just lighting our lights.”
http://uk.reuters.com/article/2011/02/16/us-usa-coal-study-idUKTRE71F4X820110216?rpc=401&feedType=RSS&feedName=environmentNews&rpc=401
or here’s the link to the pay-wall-protected version if desired: http://onlinelibrary.wiley.com/doi/10.1111/j.1749-6632.2010.05890.x/full
These costs are large even if you don’t accept that Climate Change is costly – the cost table on page 92 (20 of 26) includes 3.06 cents for CO2, only 17% of the total.
———————————————————————————————————————
Two new Carbon Capture and Sequestration (CCS) plants are demonstrating that CCS is extremely expensive.
The first is in Saskatchewan. It’s expected to cost $1.2B, and have a nominal capacity of 110MW. The second, in Mississippia, is called Boundary Dam. Bounday Dam will cost about $5 (up from the initial estimate of $2.4B) for a capacity of 565MW.
If we assume an average utilization of 75% (a little higher than the industry average) we get an overall cost per average Watt of $12.25. If we assume 7% interest and a 30 year life, that gives us a cost for capital alone of 11.3 cents per kWh.
These plants are selling their CO2 output for Enhanced Oil Recovery (EOR), but that’s not scalable to a large number of plants: the market for EOR could absorb only two or three percent of coal CO2, and long distance movement of CO2 for this purpose would be very expensive.
The article suggests that the IPCC is pushing for biomass with CCS, but I strongly suspect it makes much more sense just to grow biomass and bury it, rather than trying to capture the carbon with CCS. That’s after we move to low-CO2 generation first, of course – it’s always easier to just not emit CO2 than it is to capture and sequester it.
http://www.technologyreview.com/news/527036/two-carbon-trapping-plants-offer-hope-of-cleaner-coal/
Electric cars, and many countries, will need coal.
More demand for natural gas, including natural gas vehicles, will raise natural gas prices.
Coal May Pass Oil As World’s No. 1 Energy Source By 2017, Study Says
NPR
December 18, 2012
“Despite a slowdown in U.S. consumption, coal is poised to replace oil as the world’s top energy source — possibly in the next five years, according to the International Energy Agency. The rise will be driven almost entirely by new energy demands in China and India, the IEA says.
Together, China and India will account for more than 90 percent of the rise in demand for coal over the next five years, according to the IEA.
The agency predicts that coal’s growth trend will hold everywhere in the world except the United States, where it says the wide availability of cheap natural gas brought a decline in coal demand.
By 2017, the IEA also expects India to surpass the U.S. as the world’s second-largest coal consumer.
Europe’s coal consumption is also rising…demand for coal has surged as a result of sky-high natural-gas prices in international markets and declining output from nuclear power as Germany phases out its fleet of reactors.”
http://www.npr.org/blogs/thetwo-way/2012/12/18/167546881/coal-may-pass-oil-as-worlds-no-1-energy-source-by-2017-study-says
Electric cars, and many countries, will need coal.
Not really. Replacement of the entire US fleet of passenger vehicles would only increase electrical consumption by about 20%. Over 30 years, that’s only .7% per year. That’s really easy to supply with wind and solar. Or natural gas or nuclear.
More demand for natural gas, including natural gas vehicles, will raise natural gas prices.
Could be. Given that NG is much cleaner than coal, I don’t really see why that’s a problem.
Coal May Pass Oil As World’s No. 1 Energy Source By 2017, Study Says
Yes, the world has a lot of coal. That’s not a good reason to use such an expensive, risky, dirty energy source.
NG, you give all of these examples but never a link…Why is dat?
“Coal is expensive: occupational health costs, CO2, sulfur/acid rain, mercury in food, water consumption, adding up to $.18 per kWh ($345B/year):”
“Not really. Replacement of the entire US fleet of passenger vehicles would only increase electrical consumption by about 20%.”
My understanding, is that there is not enough production capacity to fuel
300 millions vehicles on a daily bases..
And have you figure the risky pollution cost in doing so? Of course not since you
are an Enviro.
never a link
I gave the link for this quote: “Coal is expensive: occupational health costs, CO2, sulfur/acid rain, mercury in food, water consumption, adding up to $.18 per kWh ($345B/year):” above. Here it is again:
http://uk.reuters.com/article/2011/02/16/us-usa-coal-study-idUKTRE71F4X820110216?rpc=401&feedType=RSS&feedName=environmentNews&rpc=401
or here’s the link to the pay-wall-protected version if desired: http://onlinelibrary.wiley.com/doi/10.1111/j.1749-6632.2010.05890.x/full
My understanding, is that there is not enough production capacity to fuel 300 millions vehicles on a daily bases.
Ah, I’m glad you asked. Sometimes I like to wait until people ask, so that I know they’re listening. Here we go:
2.9 trillion vehicle miles traveled per year x
.3 kWhs per mile =
about 1 trillion kWhs. divide by 8760 hours per year = 99 gigawatts. That’s about 22% of the US average of about 450GW.
the risky pollution cost in doing so?
Well, best to get it from wind, solar or nuclear. Coal would be about as bad as oil, but NG would be rather better.
Of course not since you are an Enviro.
Thinking in terms of “you” vs “us” will make you not think very well. Best to just take things with a little more detachment.
U.S. Department of Energy:
“…Sounds like coal is a dirty fuel to burn. Many years ago, it was. But things have changed. Especially in the last 20 years, scientists have developed ways to capture the pollutants trapped in coal before the impurities can escape into the atmosphere. Today, we have technology that can filter out 99 percent of the tiny particles and remove more than 95 percent of the acid rain pollutants in coal.”
http://www.fossil.energy.gov/education/energylessons/coal/index.html
Two new Carbon Capture and Sequestration (CCS) plants are demonstrating that CCS is extremely expensive.
The first is in Saskatchewan. It’s expected to cost $1.2B, and have a nominal capacity of 110MW. The second, in Mississippia, is called Boundary Dam. Bounday Dam will cost about $5 (up from the initial estimate of $2.4B) for a capacity of 565MW.
If we assume an average utilization of 75% (a little higher than the industry average) we get an overall cost per average Watt of $12.25. If we assume 7% interest and a 30 year life, that gives us a cost for capital alone of 11.3 cents per kWh.
These plants are selling their CO2 output for Enhanced Oil Recovery (EOR), but that’s not scalable to a large number of plants: the market for EOR could absorb only two or three percent of coal CO2, and long distance movement of CO2 for this purpose would be very expensive.
The article suggests that the IPCC is pushing for biomass with CCS, but I strongly suspect it makes much more sense just to grow biomass and bury it, rather than trying to capture the carbon with CCS. That’s after we move to low-CO2 generation first, of course – it’s always easier to just not emit CO2 than it is to capture and sequester it.
http://www.technologyreview.com/news/527036/two-carbon-trapping-plants-offer-hope-of-cleaner-coal/
“America has more coal within its borders than any other country with over 260 billion tons of coal reserves. America’s recoverable coal reserves has the energy equivalent of 900 billion barrels of oil, more than the Middle East’s known oil reserves.
http://americaspower.org/america-powered-worlds-largest-supply-coal
As I said above: yes, the US has a lot of coal. That’s not a good reason to use such an expensive, risky, dirty energy source.
Energy is needed to produce GDP.
And, fossil fuels raised living standards dramatically, along with raising life expectancies substantially.
Moreover, fossil fuels are much cleaner today than in the past, and they’ll be cleaner in the future.
Until there’s a practical (rather than a propaganda) alternative, oil, natural gas, and coal will be the bulk of our energy usage.
Energy is needed to produce GDP. And that energy can come from many sources. Of course, the US could easily cut it’s oil consumption in half with efficiency – that’s far cheaper than $100 oil.
fossil fuels raised living standards dramatically And whale oil produced a nice flame. But, both are obsolete.
fossil fuels are much cleaner today Not really. What specific pollutants do you have in mind?
Until there’s a practical (rather than a propaganda) alternative, If wind, solar and nuclear aren’t practical, why is our biggest competitor, China, building more of all of them than us or anyone else?
Nick G said “but I strongly suspect it makes much more sense just to grow biomass and bury it”
The best would be to extract some energy through pyrolysis and then bury the biochar through integrating it into cropland. This is effectively burying coal with a bonus of enhancing soil.
I do recall seeing a paper some years back that unfortunately showed that even that won’t scale enough to be more than one of many wedges to bring atmospheric carbon back down, but it is a start.
extract some energy through pyrolysis
Wouldn’t that extract some carbon? Why not maximize the carbon sequestration, and just bury sawdust/chips or other shredded biomass?
I would not call the massive intervention by SA/Kuwait/UAE in 2008 to be minor! Look at the percent of their volume withheld and the price change created. That is textbook cartel behavior. You continue to fail to quantify cartel impact. [Oh…and it is very funny how it occurred after your white paper saying OPEC did not drive prices, depletion did.]
The real story is that we are running out of cheap oil, OUTSIDE of Arabia. There is a huge amount in there and if we had atomistic free competition within the borders of Arabia, world price would crash. The futures curve being backwarded shows that current price is elevated above the natural Hotelling rule level.
Oh…and why not make a cost curve of all the world’s oil? Try. It would be an interesting analysis, even if non-trivial and prone to error. It at leasts drives thinking about segments of supply. Why didn’t you predict the shale oil from 100? (it is substantial, moves the needle, and has prevented 150-200/bbl pricing). Is there another segment that comes on line at 150? I don’t know. But you should try to think about it.
Nony: (1) In your view, why is Saudi Arabia spending so much more on drilling but not producing any more oil? (2) If you take the output of Saudi Arabia as given, how is your assessment of the situation different from the one I offer?
why is Saudi Arabia spending so much more on drilling but not producing any more oil?
I’d like to see that data – that would be a great topic for another post. This post just deals with the major oil companies, which only have access to a fraction of oil production and reservers. It would be nice to look at the national oil companies.
And Saudi net oil exports have (so far) been below their 2005 rate of 9.1 mbpd (total petroleum liquids + other liquids, EIA) since 2005.
As annul Brent crude oil prices rose from $25 in 2002 to $55 in 2005, Saudi Arabia increased their net exports from 7.1 mbpd in 2002 to 9.1 mbpd in 2005. At this rate of increase, their net exports would have been at about 18 mbpd in 2013.
As annual Brent crude oil prices doubled again, from $55 in 2005 to the $110 range for 2010 to 2013 inclusive, Saudi net oil exports have been below the 9.1 mbpd for 8 straight years. Based on BP consumption data and EIA production data for 2013, Saudi net exports were about 8.5 mbpd in 2013, versus 9.1 mbpd in 2005.
Following is a chart showing normalized Saudi production (total petroleum liquids + other liquids), net exports, ECI Ratio (ratio of production to consumption) and estimated remaining post-2005 CNE (Cumulative Net Exports) by year:
http://i1095.photobucket.com/albums/i475/westexas/Slide21_zps74c9ebac.jpg
I estimate that Saudi Arabia has shipped, in only seven years, about 37% of their post-2005 CNE. This method of estimating post-export peak CNE was too optimistic for the Six Country Case History (combined net exports from the major net exporters , excluding China, that hit or approached zero net exports from 1980 to 2010).
James:
To take your question seriously. I would have to look at the details of those numbers and analyze them to give you a response. I don’t have them at my fingertips.
I still think you fail to deal seriously with the major criticism I have for you (and have had for years). Indulge me in a thought experiment: Arabian production is host to a fractionated market of independent producers. What does your gut tell you about what would happen?
“Today you’d pay four times as much to buy a BTU in the form of oil compared to natural gas.”
A very solid paper, and well written. I want to hear more about the implications of that sentence.
One implication is that oil is obsolete for the majority of it’s current applications, especially 80% of ground transportation.
Electricity costs about 1/3 as much as oil for powering vehicles.
If the US chooses not to permit more than one LNG export plant, then yes, within the US there will inevitably be a huge turn towards electric vehicles. The electric car industry is really all about centrally burning natural gas and using electric power as a distribution medium.
Though the efficiency of the process is obviously not yet nearly good enough to achieve that 1/3 price ratio you’re claiming.
The average US car gets 22MPG. At $3.75/gallon, that’s 17 cents per mile.
The average EV gets 3 miles per kWh. At 12 cents per kWh, that’s 4 cents per mile. Less than 25% of the average US conventional car.
There are a lot of sources of electricity, including wind, solar and nuclear. Any and all of those would work, though nuclear does seem to be stagnating, due to it’s unique risks.
At the moment NG is very cheap (not including GHG emissions). That could change – wind and solar have very nicely stable costs.
Tom The electric car industry is really all about centrally burning natural gas and using electric power as a distribution medium
Perhaps, but it’s not immediately obvious to me why it would necessarily have to be that way. Electric cars would seem like a good fit for decentralized electric power generation because you have a fair amount of discretion as to when you want to recharge the batteries; i.e., it doesn’t have to be tied in with baseload.
It’s about big power plants burning natural gas because of the far lower price of natural gas and the economy of scale of big plants. If gas goes higher than current oil prices on an energy equivalence basis then you’ll see coal and nuclear revive. If you think wind and solar have great prospects you don’t know their economics.
Also a nice fit with wind and nuclear, which have a bigger share of night time power production.
If gas goes higher than current oil prices on an energy equivalence basis then you’ll see coal and nuclear revive.
Heck, gas only needs to higher than coal. We saw that to some extent recently, when gas prices rose a bit.
If you think wind and solar have great prospects you don’t know their economics.
And what economics are those? Wind is cheaper than new coal, in the US. It’s cheaper than old coal, if you just figure in a little of the indirect cost of coal. See my comment above: https://econbrowser.com/archives/2014/07/the-changing-face-of-world-oil-markets#comments-183556
Solar has reached grid-parity in many places (just google “solar power australia”), and it’s cost continues to plunge.
Nuclear, of course, has substantial risks but it’s still better than coal.
Excellent piece.
One factor that could drive down oil prices, at least temporarily, are steep US excise taxes on oil.
That would signal a credible policy commitment to conservation, something the US is currently lacking despite lots of waffling.
James is a nice guy and probably a beloved prof. Reasonably smart and a good communicator. I’m sure he is popular with students and such. Sort of a Mankiew (sp?) or DeLong type.
And I’m sure he’s seen the basics and I’m sure has taught intro micro. But for some reason, I don’t see him having internalized all the concepts. And definitely don’t see him analyze industries the way a solid analyst from Goldman or McKinsey (not the public facing ones) would disaggregate the issues. Maybe he’s a closet macro economist? (They are not as good as classical micro guys.)
I just think the guy could do a better job if he went and studied some classical commodity industries and did some more serious papers. Not this really light stuff on depletion that basically acts like people have never thought about it.
I don’t know, Nony. My work has been cited in 38,000 other academic studies. How about yours?
~400 (and not in econ, technical topic and did not stay in academia past grad school.)
You still are trying to write about an industry without showing demand and cost curves. Yeah, you’re popular and set in what you do. But I’ve worked with other very popular Ph.D. economists too. Very solid micro guys. Understand both the theory and practice of looking at industry case studies.
I know it stings, but I’m serious and not just trolling you. I don’t get the vibe from you that I have from really solid, sharp micro economists. And then when you have people in the comments with triangles of doom and ELMs and the like? Sheesh. Kopits is a good guy and has cool insights to contribute…but he also often seems not to know the basic econ 101 ideas.
Nony: I’m curious to see the link to the 400 studies that you claim have cited your work.
Why? I already said they’re nothing do with economics. And I never even tried to get into a cite-count muscle-size comparison. That was all you. ~400 not small enough? It’s 1% of yours. Tiny, tiny. 😉
P.s. I just went through the incredibly nerdy process of cutting and pasting the names of my old papers into Google scholar, looking how many cites there were for each, and filling out a flipping Excel spreadsheet. 10 pubs, 415 cites. ~400 swag not far off. 🙂
Nony: Every other factual claim you’ve made here has proven to be completely false. I for one do not believe this one either. 400 citations in Google Scholar is a much bigger achievement than I believe you are capable of, based on the lack of intellectual content in anything you have contributed in these comments. How many articles do you claim to have written? Please provide a link to just one or two that actually have some citations in scholar.google.com, in support of your claim that there are 400 such citations that could be found there. Otherwise, please abandon your pompous posturing here.
Professor Hamilton, I find your reply disingenuous and disturbing.
Hans: Whatever word it is you’re looking for, it’s clearly not “disingenuous”.
Jim is the pre-eminent macroeconomist covering oil markets. That’s why the International Energy Economists Association singled Jim out for his contributions to the field just a few weeks ago. There are others in this top group: Lutz Killian, Michael Kumhof of the IMF (vastly under-appreciated), Dermot Gately (now retired) and probably me (although I am not a professional economist). These are economists, not commodity analysts. Neither the IEA nor EIA has anyone at this level; nor do the oil companies. Nor does CERA (IHS) or PIRA.
As regards Goldman: They are clearly at sea with regards to their thinking about oil markets.
Here’s Jeff Currie, Head of Global Commodities Research at Goldman Sachs, from a July 22 note:
“Over a decade ago, there were two types of supply constraints: 1) technological constraints that prevented engineers from accessing oil they knew existed, such as shale, oil sands and ultra-deepwater and 2) political constraints such as exorbitantly high taxation in Russia, bans on foreign investment into the oil sector in places like Mexico and Saudi Arabia, bans driven by environmental goals, and outright civil unrest that made investment too risky. Either the technology or the politics had to change in order to create new supply. Think of it as a race between the engineers and politicians.
As it turned out, the engineers won.”
In natural gas, this may be true, at least in the US. And even that you have to take with a grain of salt. In the late 1990s, nat gas averaged around $2.20 / mmbtu, which should be about $3 in today’s money. Nat gas is $3.80 today. Engineers did not make natural gas cheaper in real terms, compared to the pre-2000 era. Not even in the US.
As for oil, if engineers were so successful, why have E&P costs been rising at an 11% pace after allowing for technological improvement. The engineers are not losing, they’re getting creamed, when we consider the economics of the industry as a whole. Nor is it clear that shale oil is cheap. Bernstein (who are much better analysts than the Goldman team right now) calculate the marginal shale barrel in the US at $111. WTI today was at $102.
The politicians are not throwing in the towel because the price of oil has collapsed. They are throwing in the towel because their vaunted engineers have been unable to control E&P costs. Jeff knows that. It’s in Goldman’s own reports. But he doesn’t understand the logic. Goldman doesn’t use a supply-constrained model. If you try to explain what’s going on with a demand-constrained approach, you end up with rather tortured arguments, much along the lines of Jeff’s.
If you use a supply-constrained model, it’s pretty simple. Once you get to the carrying capacity price, price increases depend on increases in purchasing power, not marginal cost. If you’re an exporting petro-state (with an NOC), you’ll be facing the same cost pressures facing the IOCs, ie, your costs will be rising faster than your revenues. If you want to increase net revenue, you have to increase production (exactly the opposite of the 2003-2011 period, when the overwhelming share of revenue increases came from increased selling prices ). Hence the pressure to open up access to heretofore closed or restricted economies (a point I make during the Q&A of my Feb. Columbia University presentation). OPEC and other exporters will need increased production to increase revenues. You should not, however, assume that production in these places is easy to increase in the short, or even medium, term.
So, if you’re thinking that Jim is somehow on the periphery of the professional debate, you’d be wrong. On the academic side, he is literally at the heart of it.
I have a how shall we say somewhat different experience with Goldman and especially McKinsey, but if there’s a particularly good report by either of them you think we should read, please point us to it or post it. If you try and claim you’ve got some great piece you can’t share I’m going to laugh.
Obviously Jim hasn’t written the be-all end-all of analyses of the global oil industry, nor does it look like he set out to. Your point about the possibility that the Gulf Arab oil cartel will break up and, what the heck, dissolve national oil companies and invite in all and sundry, could be worth considering in a more completist work as a highly unlikely but theoretically possible downward price risk.
But keep in mind the Gulf Arab countries aren’t just propping up the current price, they’re also conserving some wealth for the longer run. Sure they could knock down the price some for a while if they wanted. Estimates differ over how much lower for how much longer, and nobody really knows. But whatever their resources are, speeding up exploitation would only bring forward output and the day when their output begins to irresistably decline. To really change the long-term outlook, they’ve got to find more resources, or secretly have a lot more than they’ve been acting like they have.
I don’t have any super McK/GS studies (secret or otherwise). That wasn’t my point. My point was more about analytical approach, that you would just get from a good analyst disaggregating a problem. And, yeah, I’ve had bad experiences with both also. Not here to pump them. [Or pump myself with 1% of his citations and with no econ degrees.] If anything, my point is more that you DON’T have to have 40,000 citations and a tenured saltwater faculty position to understand basics of supply and demand industry analysis. I’m really reacting to something in how Jim looks at stuff that is not econ 101. Maybe it’s the macro versus micro (micro really is better).
Oh…and ignoring the cartel is really ignoring what is at least a big POTENTIAL factor in the price of oil. A dismissive sentence or two is insufficient analysis. It’s like ignoring steroids when looking at home run numbers.
Indulge me in the thought experiment. Saudi Arabian oil produced by a large number of atomistic producers in free competition. Do you really think their would be no price impact? Would it go up (lack scale)? 😉 I don’t think so. Your “Bayesian betting, money on the line, gut” tells you it would crash. Doesn’t it. 🙂
Oh…and as far as “conserving wealth” for later. Look at Hotelling’s insight. James knows it. It’s a trivial insight (if you think about it as arbitrage instead of all the complicated math). If you have a depleting resource, price mechanism will naturally compensate you for future scarcity. You don’t have to ration.
And the idea of rationing for future generations is actually very unusual in practice. Most autocrats and politicians, if anything do the opposite! All their incentives are for dealing with the here and now.
A much simpler explanation is that OPEC is interested in the monopolists revenue maximizing price. Right out of the textbook.
Oh….and if you think I’m full of it, look up Hotelling and then check out how the futures curve is backwarded. James needs to address that. It’s a fundamental issue.
Small example, but how relevant is the majors’ capex versus production to the overall industry? Yeah, it’s insight…it’s something. It’s probably even something showing something about the overall problem. I’m not saying don’t cite it…good analysis. But also don’t stop there.
It’s 10% of the industry and with notable differences than NOCs or US LTO independents. Heck, I think some capital in Venezuala or Mexico are severely needed. They have “milked the cow”. Need investment. Shouldn’t you at least discuss countries like that qualitatively? A shrewd analyst would.
P.s. The Kopits state by state charts used to just say ND for recent peaks. Now we have Colorado ( a substantial producer too). It is not out of the realm of possibility that the #1 state, Texas will repeak also. Headed that way. (Would have been crazy talk to TODsters a fw years ago!)
http://media.peakprosperity.com/images/1-OPEC-Crude-Oil-Production%202005-2012.png
Look at what happened in 2008-2009. That was cartel action. Plot the price on there. Look which countries cut production. It’s a smoking gun.
Nony: Please note: (1) the OPEC production decline comes after the price of oil began to decline. It was an effort to keep prices from falling more steeply, it was not the cause of prices increasing in 2007 and 2008. (2) Your graph is the identical data as that shown in Figure 10, Panel A of my paper, except that (a) my graph extends back to Jan 1973 and goes all the way up to March 2014, whereas yours only covers the period Jan 2005 to Feb 2012; and (b) the vertical axis on my graph begins at zero, that on yours does not. The consequence of (a) and (b) is that my way of reporting the data conveys both scale and long-term perspective, which are in fact the issues under discussion here. (3) I acknowledge in the paper that the OPEC cut in 2008-2009 was a deliberate effort to stabilize the price, but nevertheless conclude that other factors account for the quintupling in the price of oil since 2001. (4) You still have not responded to the evidence in Figure 11 of the paper.
James:
1. I agree the 147 was not from the cartel. Was not my point to say every change is from them. Just that they have real impact, so you need to look at them. Much, much more than you do.
I’m aware that the intervention was done in reaction to the price decline. My point is that it was an intervention and did have an impact. Huge one. That is both cartel action and efficacy of cartel action. Smoking gun.
Once, you see that, it calls into question the whole “can’t pump to stop oil prices going up” meme. Doesn’t it? Several years ago, we had the price rise above 40 and the Arabs couldn’t stop it. Then it drops to 40 and they intervene massively to prop up price. I think there was some “don’t throw me in the briar patch, Brer Fox” when that price went up in early 2000s. They are just fine with 100/bbl and intervened to support it when it was coming down (and Hotelling theory would say it should not come down, should not crash…even big temporary demand crashes should be arbitraged to future scarcity and thus hold price up…)
2. That was the best I could find, quick on the net (graphic). I won’t apologize for the timing…since what is in discussion is the 2008 intervention. I agree that we should have a true zero. (But come on, man. That’s not addressing the real micro issues: cartels, Hotelling, etc. Oh…and I got sneered at by your co-blogger when I asked for a true zero graph). In any case, the change from ~40 to ~90 is like a doubling. It sure shows cartel impact on any scale. That’s “market power”, “rational competition” or any other euphemism that my company lawyer tells me to avoid to not get into FTC trouble.
3. I saw that you acknowledged it. It’s just not digging into a big factor. [And I can’t constrain my glee with how that “smoking gun” intervention contradicts your previous white paper’s main point. Funny how you changed it once when price crashed. Then price went up again real fast with the intervention…I guess at that point, you threw up your hands to update your paper every time events moved the evidence. ;)]
4. [Just looking at it.] I agree that figure 11 shows more effort needed to get ME oil. If you look at production/rig count, I bet it’s still lots better than the US. And I bet marginal cost of next barrel is lower (and in a free competition market, it would be equal). I’d also love to see it broken up by country (just for the insight).
P.s. I think it’s a little rich for you to say I ignore your points, when you ignore mine. [Hotelling, Hotelling.] Heck…I even answered the citation question. 🙂
Nony:(1) Monthly OPEC production fell from 33.7 mb/d in July 2008 to 30.4 mb/d in Feb 2009. Over this same period, monthly WTI fell from $133 to $40. OPEC production increased from 30.4 mb/d in Feb 2009 to 31.2 mb/d in Jan 2010, during which WTI increased from $40 to $78. This is your smoking gun?
The only gun I see here is yours, and it is shooting ill-informed blanks in every direction.
(2) No, the best graph you could find was Figure 10 in the paper you came here to sneer at.
(3) You obviously didn’t read the discussion of OPEC, Hotelling, or anything else in this paper, either.
I read them and they were not sufficient. Honest, I have referred to ‘your 2008 white paper’ before. So the idea that I hadn’t seen it is strange.
Yes, it is a smoking gun. They dropped production when price started dropping! 31.2<<33.7. Look at the specific players and how they cut production. That was a clear act of market power. A free competitor does not drop production the way SA, KUW, and UAE did.
Incidentally, in regard to ELM (Export Land Model), could you identify any errors in the following mathematical observations?
Also, as you know I introduced the ELM concept in a brief article in early 2006, focused on the top three net oil exporters at the time (Saudi Arabia, Russia and Norway).
Following is the concluding paragraph from the article (emphasis added):
http://www.theoildrum.com/node/984
Granted, Saudi and Russian production did not turn out exactly as predicted, but Saudi net exports started declining in 2006 (remaining below the 2005 rate for eight straight years), and Russian net exports stopped increasing in 2007 (ranging between 6.9 and 7.2 mbpd since 2007). And as expected, Norway’s net exports continued to decline.
And following is a chart showing the 2002 to 2012 data for the (2005) Top 33 net oil exporters, what I call Global Net Exports of oil (GNE).
In early 2006, we didn’t even have complete 2005 data, but in retrospect, at the rate of increase in GNE from 2002 to 2005 (from 39 mbpd in 2002 to 46 mbpd in 2005), as annual Brent crude oil prices doubled from $25 in 2002 to $55 in 2005, GNE would have been at about 66 mbpd in 2012, versus the actual value of 44 mbpd, as annual Brent crude oil prices doubled again, from $55 in 2005 to $112 in 2012:
http://i1095.photobucket.com/albums/i475/westexas/Slide1_zps3161a25b.jpg
I am now estimating that in only 8 years we have already burned through about one-fourth of the post-2005 global supply of Cumulative Net Exports of oil (CNE). As noted elsewhere, this method of estimating CNE was too optimistic for the Six Country Case History.
James Hamilton in mid 2013:
“But Texas production in 2012 (at 2MM bpd) was still 1.4 mb/d below the state’s peak production in 1970, and I haven’t heard anyone suggest that Texas is ever going to get close again to 1970 levels.”
We’re now at 3MM bpd. Does 3 count as “close” to 3.4??? In any case, if the 2% growth rate continues, it will not just be “close” but pass the record around DEC2014.
And this was not some crazy black swan, James. The trend was well underway for several years. But you talked it down. Maybe a little lack of detachment?
The Texas RRC puts the 1972 Texas (crude oil only) peak at 3.5 mbpd.
The EIA’s estimate for Texas Crude + Condensate (C+C) production for the first four months of 2014 was 2.9 mbpd. The Texas RRC put the Condensate to C+C Ratio at a little over 15% in 2012 and a little less than 15% in 2013, and I think recent data confirm a decline in the ratio, probably as a result of operators shifting to more crude oil prone areas in the Eagle Ford Play. In any case, if we use an estimate of 13% for the current Texas Condensate/(C+C) Ratio, it suggests that Texas crude oil only production in the first four months of 2014 was about 2.5 mbpd, versus 3.5 mbpd in 1972.
Regarding total US C+C production, at a given gross decline rate from existing production, the greater the production, the greater the production decline from existing wells. Of course, the gross underlying US decline rate has probably increased too since 2008.
Let’s assume that the gross underlying US decline rate from existing oil wells was 5%/year in 2008 and 10%/year in 2014. And let’s assume that the 2014 US C+C production averages 8.6 mbpd.
Based on foregoing, in 2008 we lost 250,000 bpd from existing wells (5% of 5.0 mbpd), and in 2014 we would lose 860,000 bpd from existing wells. So, again based on foregoing, a 72% increase in production would correspond to a 344% increase in the volume of oil lost to declining wells–from 250,000 bpd per year to 860,000 bpd per year.
Based on foregoing, in order to hit 9.0 mbpd in 2015, the industry would have to put on line about 1.3 mbpd of C+C new production in 2015.
In other words, the greater the production increase, the closer in time that a region is to the point at which contributions from new wells can no longer offset the declines from existing well, which is why Peaks Happen.
In regard to Texas specifically, I would estimate that the gross underlying decline rate from existing production is at least 15%/year. Let’s assume that Texas crude oil only production averages 2.7 mbpd for 2014*. Based on this estimated decline rate from existing production, Texas would probably have to put on line about 700,000 bpd of new crude oil only production from 2014 to 2015, in order to average 3.0 mbpd (crude only) in 2015. We will see what happens.
*Note that the most recent RRC data show Texas crude only production at about 2.2 mbpd for late 2013 (revised up from 2.1 for the initial estimate). Peak Oil Barrel link to a discussion of recent Texas data:
http://peakoilbarrel.com/texas-rrc-july-oil-gas-report-may-production-numbers/#more-3905
THE RRC data has massive lag and gets adjusted up. You know it. Ron finally knuckled under and conceded that. Blanchard was way off base and has not. Is well documented. Even DCoyne (a peaker, but honest one) has shown it. Use EIA.
As noted above, I used the EIA data (and the RRC Condensate/(C+C) data) get an estimate of about 2.5 mbpd of Texas crude oil production only for the first four months of 2014, versus 3.5 mbpd crude oil only in 1972.
In any case, it’s one of life’s little ironies that the Cornucopians use examples of what are (so far at least) still post-peak crude oil producing regions, i.e., Texas & the Lower 48, to refute the Peak Oil “Theory.”
While it’s entirely possible that Texas and the Lower 48 will exceed the early Seventies peak rates (and I didn’t think it would happen), it hasn’t happened so far, which forces the Cornucopians to argue, in effect, that a reduction in the rate of decline in production, relative to a prior peak, means that we haven’t peaked. And as noted above, the industry faces enormous challenges in trying to indefinitely offset the huge declines in production from existing wells, and I am puzzled as to how anyone can argue against the point that it’s when, not if, that the contributions from new wells can no longer offset the declines from prior wells, i.e. Peaks Happen.
Jeff:
1. The crude versus crude and condensate in 1972 becomes academic because of amounts involved. (Although I believe the intention is to show both.) Here is the best primary report, I could find.
http://books.google.com/books?id=iczXMAAfRmgC&pg=PA53&lpg=PA53&dq=texas+crude+and+condensate+1972&source=bl&ots=rZ91tfujrp&sig=VU2wkCo4rKxSljRYphcMd2I_MF4&hl=en&sa=X&ei=FCbRU-iUGKjjsATFo4GoCw&ved=0CB8Q6AEwAA#v=onepage&q=texas%20crude%20and%20condensate%201972&f=false
2. Condensate is not exactly WTI, but is still a very high value hydrocarbon which is blended into gasoline. It gets less than WTI but more than heavy sour grades. It’s not the ideal API, but it’s oil. (Associated oil from a gas well, basically.)
3. You have been running around for a long time saying that the growth in Texas is mostly condensate. But Ron’s charts show percentage condensate less than 15% (while total crude and condensate has more than doubled). And that percentage is even dropping lately (since gas wells are getting crushed by the Marcellus). You have not faced how wrong you were on this. But it’s very common for peakers not to admit when wrong.
Here is the RRC link for historical data, which is crude oil only, and as the link states, and as you noted, these are actually preliminary values, so the actual value for Texas crude oil in 1972 was probably slightly greater than 3.5 mbpd:
http://www.rrc.state.tx.us/oil-gas/research-and-statistics/production-data/historical-production-data/crude-oil-production-and-well-counts-since-1935/
In any case, my point was, and is, that you were comparing EIA Crude + Condensate data to Texas RRC crude oil only data, in regard to the 1972 peak rate.
And my point was, if I ad the condensate in, the number is the same. Look at my cite.
Also, you have been running around saying the bulk of new production was condensate when its 15% of a doubled number (and the percentage actually dropping).
Plus, you totally pass by my point about the value of condensate versus heavy sour. and how you can make GASOLINE from condensate.
I can’t make heads nor tails out of the link you posted.
Here are the EIA C+C annual data for Texas, back to 1981:
http://www.eia.gov/dnav/pet/hist/LeafHandler.ashx?n=pet&s=mcrfptx2&f=a
And here are the RRC crude oil only annual data:
http://www.rrc.state.tx.us/oil-gas/research-and-statistics/production-data/historical-production-data/crude-oil-production-and-well-counts-since-1935/
For 2013, the RRC is currently showing 2013 crude oil production as 2.04 mbpd and condensate production as 0.36 mbpd, for a total C+C of 2.40 mbpd, while the EIA is showing C+C production of 2.56 mbpd for 2013.
In 1981, the EIA showed Texas C+C production at 2.55 mbpd, while the RRC showed crude oil production only as 2.46, a gap of about 90,000 bpd, which is not a big difference. Interestingly enough, the EIA C+C production in 1981 was almost exactly the same as 2013, but the implied Condensate/(C+C) Ratio in 1981 was 3.5% versus the RRC value of 15% for 2013.
I would agree that it’s possible that condensate in 1972 may not have been a significant factor, but if you are arguing that the RRC defined crude oil as Crude + Condensate in 1972, but not in 2013, I think that’s complete nonsense, and in any case I would have to agree with the Professor’s following comment:
In any case, based on the most recent annual RRC data, the RRC is showing 2013 Texas crude oil only at 2.04 mbpd, versus 3.5 mbpd in 1972 (rounded up slightly from 3.45). And if we include condensate, the RRC C+C number for 2013 is 94% of the 2013 EIA C+C number.
Jeff:
I’m saying that if you add the condensate from 1972 to the 3.4, you still have 3.4.
I also discussed how condensate has similar price to heavy sour crude (similar delta versus WTI). It produces transport fuels. Condensate is even called “natural gasoline”. It is an economic substitute (ask James).
heavy, sour = low API oil
WTI/light sweet = medium API
condensate = high API oil
Condensate is associate oil from a gas well. In a similar manner to how associated gas from an oil well happens. Yeah, it’s higher API. Just like associated gas from an oil well is “wetter” gas.
You are really reaching with the attempt to exclude condensate. Heck even the export restrictions call out lease condensate as a form of oil.
Minor correction. The latest RRC data show Texas crude oil only at about 2.1 mbpd in late 2013, versus 2.0 mbpd for the initial estimate.
Nony: The way to establish an error in the statement “I haven’t heard anyone suggest that Texas is ever going to get close again to 1970 levels” (which was made in April 2013, by the way) would be to provide a link to a serious analyst who was predicting in April 2013 that Texas was going to return to the levels of 1970. Here, for example, is the EIA’s assessment from April 2013, which anticipated that total tight oil production from the entire United States would peak at 2.8 mb/d in 2020. And here’s a disucssion of what led the EIA to change its assessment between April 2013 and December 2013.
In my experience, the EIA is very poor at forecasting. Their historical data is invaluable, but their forecasting…is terrible. I suggest you avoid their forecasts whenever possible.
One factor: as an agency of government, they’re handicapped by the need to be very, very conservative. The “reference” forecasts assume no changes at all in policy, which is highly unrealistic. I’m sure you’ve seen the same problem with OMB and CBO forecasts.
James:
1. I agree that you said ‘analysts say’. I think that is fencing a little, though. It’s a caveat on the more negative side [note for instance, you don’t go by the analysts when they predict price drops, so there is some picking and choosing…and by the way, you’ve been right not to go with them on price drops, but not from US geology!] and one that you decided to cite. you study the industry also and had a chance to be more optimistic and insightful and didn’t.
2. You did cover the changed EIA estimate, but not with a ‘this changes what I said before’ slant. ‘Those serious analysts I said were cautioning how small the runup, have changed their minds.’ The slant was more, doesn’t matter anyway since rest of world is making less. (which I actually agree with you on…just wonder why they are making less. Did we simultaneously underestimate US geology and overestimate ROW geology? Or could OPEC have some reserve capacity, they are all so happy not to use?) 😉 But bottom line, I don’t think your coverage was clear enough about correcting your earlier post.
3. I’ve had a little fun now looking at Googled old reports from IEA, EIA, IHS, Bentek, Citi, Woods McKenzie and BP. Basically they all underestimated US production. I wonder why and I wonder what it means? It was not like a hurricane hitting the gulf or a war breaking out. Guess it just means they did not understand the in process change despite all the coverage. (Of course this does imply that further misunderstanding could exist…for example ROW shale development taking off. Also, one can think of the example of the Marcellus and shale gas in general outperforming expectations.) [BTW, the BP report almost nails it…you have to squint and interpolate their chart, but they were the most US shale oil optimistic and come pretty close.] And it’s kind of funny that the crazy, “provocative” reports by Citi and the like ended up being underestimates.
—-
Any way you cut it, when Texas goes over that peak, it is going to be phenomenal and something that you failed to predict.
Nony, it is going to 4 million and even perhaps 5..
Many of Professor Hamilton’s projections are based upon
his personal conviction, that Peak Oil is a matter of time.
Professor,
I believe that the work you do is very good and your conclusions are well thought out, but I am always surprised that you do not give more credit to the theory of Schumpeter. It seems that your approach has two pretty serious flaws. First, you do not consider the political intervention that prevents the production of the factors of energy production and second, you never seem to give credit to the amazing technology that has reduced use of the factors while actually increasing the reliance on energy production. You seem to follow the all too common backward looking economics. Economics should not be practiced while looking into a rearview mirror.
This is a good paper to read to review basic concepts.
http://web.mit.edu/ceepr/www/publications/workingpapers/98008.pdf
And I’m not saying that there is anything “new” or spectacular in it. No way!
And I know James knows this stuff…and probably all kind of super hard Diff E Q’s, all kinds of concepts and papers I’ve never even heard of. But the point is…when you want to understand something, look at it in terms of supply and demand. Micro, micro, micro.
That an economics educator, heck one with a popularizer bent does not try to get his audience to think in terms of supply and demand just bugs me. I mean look at Kopits with the “supply constrained” versus “demand constrained”. Has he ever make a PQ curve and looked at the lines for both supply and demand? Built it up with little blocks (segments)?
Yes, I have, Nony. Year by year. What do you want to know?
Good job (serious). Those rectangle charts are a good way to fly. Forces you to think and disaggregate. Reflects supply and demand. Micro econ.
Nony: Not think in terms of supply and demand? I don’t know which amazes me more, your complete ignorance of everything you say, or the extreme confidence with which you express your opinions.
Please read these papers [1], [2]. And then please apologize for the nonsense you’ve been trying to spread here.
Professor:
I had seen those before (well the white paper one, other one is similar). My point is really buttressed by you citing those two papers.
1. They’re both BEFORE the smoking gun EFFECTIVE cartel intervention. I mean the event came afterwards and HURT your two papers.
2. (I think this is a macro versus micro thing). The only supply and demand curves, you show are a literal “X” crossed lines. A cartoon. And then we have a bunch of price time series in your figures. (Do you endorse the crazy triangle of doom or can I please at least get you to speak out against that…that awful influence of flawed thinking propagating in your comments section.)
You need to have curves with shape, with segments. Look at these curves (ones with rectangles). That gives insight to see the height and width of the rectangles.
https://www.google.com/search?q=cost+curve+commodity&source=lnms&tbm=isch&sa=X&ei=K0LRU-SPEcr0oASJtIKIAg&ved=0CAYQ_AUoAQ&biw=1920&bih=911
Same thing applies with demand. You need to (at least) look at the different market segments.
Here’s what Nony says: “The only supply and demand curves, you show are a literal “X” crossed lines. A cartoon.” And here’s what the paper he claims to be describing says: “The initial price P₀ is then determined by the transversality condition that if the price P_{t} follows the dynamic path given by (7) from that starting point, the cumulative production converges to the total recoverable stock as t→∞.”
And by the way, the Adelman analysis that you are holding up as superior generated the most spectacularly inaccurate prediction of what was going to happen in the years after they were written of anything I know in the literature.
I’m not holding out Adelman as having made a particular good prediction. I think it is the macro prof in you who wants to make predictions. I’m holding that paper out as a good paper to just understand the levers and to think micro economically about the industry.
You absolutely DO have crossed straight line X cartoon figure as your supply-demand figure in both of your papers. I am not saying that you think this is the exact picture of the industry. I’m saying you don’t even bother to try to construct real supply and demand curves with little rectangles, like a good trade study of a commodity chemical would have. That’s my point.
” I don’t know which amazes me more, your complete ignorance of everything you say, or the extreme confidence with which you express your opinions.”
You can combine the two. My skipper back when I did spec ops called it the “balls to brains ratio”. He actually wanted it pretty high.
P.s. Slow down with the rebuttals. I’m Googling away to find that one analyst report from pre-April 2013 that you missed. 😉
I love the put down Nony.
The condescending tone reminds me of the popular, widespread condescending tone towards west coast aboriginals. The loudest tend to be vigorous supporters of open access resource allocation policies.
Or put in common terms. The most condescending tend to have a “what was yours is now mine” attitude.
So what’s your angle? Cheap energy?
Tom It’s about big power plants burning natural gas because of the far lower price of natural gas and the economy of scale of big plants.
I don’t think that really addresses my point. I said that I did not see any obvious reason why electric vehicles could not be charged from decentralized sources rather than centralized sources. I don’t doubt that generating power from natural gas burning plants has to be centralized, but not all power has to come from natural gas burning plants. I also wouldn’t be surprised that wind power has to be centralized as well because only a (surprisingly few) spots have steady and reliable wind. But I’m not convinced that centralizing solar power makes sense unless you’re in love with meters. In fact, what I’ve read says that solar only makes sense as a decentralized power source. So why not recharge your electric car using the solar panel on your roof? Or here’s a novel thought; as solar panels become lighter and less expensive, why not make the roof of your car a small solar panel that juices up your car while it’s sitting in the parking lot when you’re at work? The point is that charging your car isn’t like demanding baseload energy to run your air conditioner. It’s more like running your washing machine; you can do it more or less when you want.
JDH My conclusion is that hundred-dollar oil is here to stay.
I’m confused. Your conclusion doesn’t seem to follow from all of the very good arguments and facts that you presented. Your conclusion seems too optimistic. Doesn’t your argument really suggest that $100/barrel oil is likely to be a temporary low that we will not ever see again once global demand picks up? So I don’t think $100/barrel oil is here to stay; sounds more like it’s making a brief pit stop at $100 before moving on.
2slugbaits: I am assuming that tight oil production will continue to increase over the next several years, so that the situation since 2011 (over which the price has been fairly stable) is similar to what we might expect for the next several years. Libya (situation can only improve), Iraq (situation unclear) and China (ditto) are important wildcards.
Slug: You’re having a Roseanne Roseannadanna moment. I never said anything about centralized charging. That would indeed be silly. I said “centrally burning natural gas and using electric power as a distribution medium.”
Nick says “Of course, the US could easily cut it’s oil consumption in half with efficiency – that’s far cheaper than $100 oil.”
Nick says ” If wind, solar and nuclear aren’t practical, why is our biggest competitor, China, building more of all of them than us or anyone else?” (minus the massive state credits to manufactures)
Could you please provide supporting evidenced for these questionable statements?
Of course you will not because you make all of this up as you go alone.
Hans,
if you check energy consumed per unit GDP then you have a relatively poor performance in the case of the USA. Or, if you take primary energy consumption, final energy consumption, oil consumption per capita then these numbers are much much higher in the USA than in most other developed economies. What is your problem?
Therefore, improving the efficiency to levels is indeed a posssible alternative to increasing oil production.
China adds 2013 and 2014 more wind capacity than any other country. As most of the NPPs under construction, which are not already zombies, are in the PRC, the most likely result is that China proviidess most of the new nuclear capacity. In case of PV the situation is a little bit unclear, but China will be in any cases at least one of the top three.
Correction:
“Therefore, improving the efficiency to levels is indeed a posssible alternative to increasing oil production.”
should have been
Therefore, improving the efficiency to levels of other developed countries is indeed a posssible alternative to an increasing production of expensive oil
Spielgel, your points are all valid..I would add, that as prices have
increased so has the degree of efficiency..If we had EuroLand type
of pricing, America would be even more efficient in the use of gasoline.
Nevertheless, America could not reduce goo consumption by 50%
without entering a depression…Nick G, statement about that was
entirely without any and all merit..
“Therefore, improving the efficiency to levels is indeed a posssible alternative to increasing oil production.”
Not likely..You would need a declining use of the product or population in order to achieve those goals;
both of which may not be healthy to the economy.
Any Bird Shredder requires a million or two in subsidy in order to
be built; hardly a accreditation to efficiency…They are also noise polluters
as well..
..If we had EuroLand type of pricing, America would be even more efficient in the use of gasoline. Nevertheless, America could not reduce goo consumption by 50% without entering a depression.
Europeans use only 18% as fuel per capita for personal transportation, so they would think that 50% of our level of consumption was way too much.
Now, it would be very inconvenient to reduce fuel consumption that much overnight (though it could be done – the average vehicle only carries 1.2 people, so just doubling that would do it – carpooling, the horror!), but it would be easy over, say, 10 years.
Nick G, we are not EuroLand nor are we the Congo; which
has even a higher efficiency use of petrol.
we are not EuroLand
What do you mean? Europe doesn’t have a reasonably comparable economy?
please provide supporting evidenced
I thought the arguments were obvious: we see this kind of information every day, if we’re at all tuned into energy news.
Think about vehicle efficiency: it’s doubled over the last 40 years. That’s due to improved engineering. The US consumes about 140 billion gallons of gasoline every year – that improved efficiency will save about $5 trillion over 10 years (assuming, of course, that gasoline wouldn’t rise to $200 per barrel, if the US were to consume twice as much oil for passenger transportation). How much did that engineering cost? Perhaps $10 or $20 billion in engineering salaries and improved Computer-Aided-Design? That’s about 500:1 return on investment.
So, the average US car gets about 22MPG (2.9T VMT divided by 140B gallons). As we’ve seen with the newest cars and hybrids, it’s relatively easy to double that efficiency. The engineering to do so might cost another $20B (actually, most of the work has already been done), while we’d save about $2.5T over 10 years. You can quibble with these numbers a little, but the overall result is overwhelming: investment in improved vehicle design has infinitely better ROI than drilling in the Arctic.
So, why don’t consumers demand better MPG? Mostly because consumers have a lot more on their minds: they have a wide range of requirements for their vehicles, and MPG is only one of them. And, fuel cost is a relatively small component of the overall cost of vehicle ownership (it’s easy to find this kind of infor. For instance, a little Googling for an analysis of driving costs will find http://publicaffairsresources.aaa.biz/wp-content/uploads/2014/05/Your-Driving-Costs-2014.pdf).
The same is true for China’s investments in wind, solar and nuclear. For instance, put “china wind power building” into google, and you’ll get ” the development of wind energy in China, in terms of scale and rhythm, is absolutely unparalleled in the world.” from http://en.wikipedia.org/wiki/Wind_power_in_China
Nick G, there is the Law of Diminishing Returns…
The ICE vehicle can and will only become so efficient
until until either a new form of propelling or radical
mandates.
Moreover, the consumer must accept and buy in order
for these high MPG to succeed…Good ideas are not always
successful in the markets.
I would add, that I seriously doubt that auto manufactures
have a better ROI than the goo industry.
there is the Law of Diminishing Returns
The average US vehicle only gets 22MPG. A Prius gets 50MPG. A Volt gets 220MPG (counting only gas). A Leaf gets infinite MPG.
The ICE vehicle can and will only become so efficient until until either a new form of propelling
It’s here, it works, and it’s better. A Tesla, for instance, is better and cheaper than the comparably priced competition.
I seriously doubt that auto manufactures have a better ROI than the goo industry.
Why, specifically?
the consumer must accept and buy in order for these high MPG to succeed
US pure EV sales have doubled each year for the last three years (from a very small base) and pure EV and PHEV sales are growing faster than hybrid sales did when they were introduced . Tesla has a large backorder book. Nonetheless, PHEV sales aren’t growing as quickly as many people had hoped.
Cost isn’t the problem.
Hybrids, EREVs and EVs are already the low cost choice for Total Cost of Ownership (per Edmunds.com), so if cost were the driver….we would have reached the tipping point. Buyers of new light duty vehicles (cars, pickups, SUVs) sales just don’t seem to be very price sensitive. The minimum cost US vehicle is about $11k, while the average vehicle is more than $30k. The average new car gets about 25MPG, while 55-100MPG vehicles are available. New car buyers just aren’t paying much attention to minimizing costs.
Supply isn’t the problem: Toyota, Nissan, Ford and GM will tell you that they could double production of their hybrids, EREVs and EVs literally overnight, if demand were there.
There are two big problems:
First, the vast majority of people are very slow to move to new things. Individual consumers have to see people around them using this new thing for quite a while to become comfortable with them. For example, online food ordering has overwhelming benefits for parents, but Webvan went bankrupt: they counted on people moving to a new thing too quickly.
Commercial users of heavy duty vehicles face large problems of economy of scale, long-lived investments and operating in a tough competitive market. Large fleet customers have been experimenting with pilot programs, but have been afraid of being first movers (“Pioneers are the ones with arrows in their backs”). That suggests that the early rate of adoption may be deceptive. At a certain tipping point fleet buyers will decide high oil prices are permanent, and that electrified/alt fuel vehicles are clearly cost justified. Then, sales will grow quickly.
Second, the primary reason for EVs is external costs like Climate Change and the cost of military conflict in the M.E., and as a society we haven’t prioritized dealing with those costs. We just haven’t. Until we do, with things like carbon and fuel taxes (which even the most conservative economists support for external costs) and acceptance by Republicans, it’s unrealistic to expect fast movement by consumers.
Nick G, currently, the Prius is in the upper end of fuel
economy…Doubling it, will be very difficult and would
require numerous technical advances.
I would also add, that the payback period, for the extra costs
of owning a Prius is somewhere between six to nine years…
Many Americans can not afford to own it, as the average feet
age is now nearly 12 years.
The Tesla S, is an excellent vehicle, if you can pay the $80,ooo
or more…Like the Prius, it will never enter the mainstream, unless
costs decline.
EV sales only account about 1% of the new sale auto market.
I can not agree with Edmunds, as upfront cost on Hybrids and EV
are substantial to that of a ICE vehicles…In fact, the replacement of
the Prius battery pack will exceed $4,ooo; a very expensive after market
repair.
“New car buyers just aren’t paying much attention to minimizing costs.”
Indeed, they are, by leasing and having mortgage length loans.
“First, the vast majority of people are very slow to move to new things.”
I believe Americans are rather quick to adopt..If you could sell a Telsa for
$25,ooo bucks, it would become the number one selling vehicle.
“Second, the primary reason for EVs is external costs like Climate Change and the cost of military conflict in the M.E., and as a society we haven’t prioritized dealing with those costs.”
World Wide Warming is a complete hoax and fomented by the anti-Carbon forces,
as a means to control and mandate human behavior..America has always paid a price
for defense, it is a price for the common good and for our liberties.
Nick G, have you and your colleagues, EVER estimated the cost of the loss of your
freedoms?
Again, you mention “external cost” which you apply only to your own
personal agendas..As I stated before, all of man’s actions have related
costs, not just those proclivities advanced by the left…Hence, your premise is not accurate
nor material.
the Prius is in the upper end of fuel economy…Doubling it, will be very difficult and would require numerous technical advances.
The Chevy Volt is already at 200MPG.
More importantly, the average car on the road is only 22MPG, so we don’t need anything better than the Prius to cut fuel consumption by 50%.
I would also add, that the payback period, for the extra costs of owning a Prius is somewhere between six to nine years…
The average car gets sold every 3-4 years. Over that time, you save money. Look closely at the Edmunds charts – the fuel, maintenance and repair savings are greater than the extra depreciation.
Many Americans can not afford to own it, as the average feet age is now nearly 12 years.
That includes a lot of cars that don’t get driven much. 50% of miles driven come from cars less than 6 years old.
the replacement of the Prius battery pack will exceed $4,ooo; a very expensive after market repair.
Very, very few Prius batteries are ever replaced, even after 15 years.
“New car buyers just aren’t paying much attention to minimizing costs.” Indeed, they are, by leasing and having mortgage length loans.
But they aren’t paying close attention to fuel costs. Also, remember that the average new car costs more than $30k: that’s more than a Prius.
World Wide Warming is a complete hoax
Well, we disagree. But, it’s not important, really. There are plenty of other reasons to kick the oil habit.
fomented by the anti-Carbon forces, as a means to control and mandate human behavior
That’s what the oil industry would like you to believe, but it’s really not true. Most “anti-carbon forces” would be delighted with a simple carbon/fuel tax. That wouldn’t have any impact at all on civil liberties.
Nick G, have you and your colleagues, EVER estimated the cost of the loss of your freedoms?
Absolutely yes! That’s the biggest reason I want us to kick the oil habit. We’re destroying our civil liberties right now, all in the name of fighting wars. Those wars would be unnecessary if we weren’t dependent to oil.
Arabia’s, production from 1991 to 2013, is up 22%; of course, that if you
truss the Royal Family.
http://www.tradingeconomics.com/saudi-arabia/crude-oil-production
A more detail list of Arabia’s annual production numbers.
http://www.indexmundi.com/energy.aspx?country=sa&product=oil&graph=production
Excerpt from post up the thread:
Following is a chart showing normalized Saudi production (total petroleum liquids + other liquids), net exports, ECI Ratio (ratio of production to consumption) and estimated remaining post-2005 CNE (Cumulative Net Exports) by year (2005 to 2012):
http://i1095.photobucket.com/albums/i475/westexas/Slide21_zps74c9ebac.jpg
I estimate that Saudi Arabia has shipped, in only seven years, about 37% of their post-2005 CNE. This method of estimating post-export peak CNE was too optimistic for the Six Country Case History (combined net exports from the major net exporters , excluding China, that hit or approached zero net exports from 1980 to 2010).
The backward futures curve for oil is a big, hairy deal we have to wrestle with. This does not fit a classic depletion-Hotelling price scenario (especially when you layer in growing demand from the emerging markets.) It certainly does not fit a peak oil is going to make things worse meme. We should try to figure out what is prompting this shape of the curve.
a. market issue
(1) Is the market irrational, Hotelling was wrong, arbitrage theory is wrong [I reject this…market could be wrong because of bad information, but it’s not wrong in terms of EMH being wrong].
(2) Is the market ignorant [Even the information thing seems like a stretch. There’s a lot of betting money on the table. It’s been there for a while. They’ve all read the peak oil analyses. That stuff was super popular c. 2005-2008. If you want to make some argument that you understand things better than Wall Street, OK…but flesh that out much more. On the other hand, the futures curve has been backwarded for years, and price seems stuck. Perhaps that is from the geopolitical shortfalls (e.g. Libya)?]
b. Is demand going to drop?
(1). because of massive Western recession? [US equities are high, and we are coming out of recession more than heading into one, don’t know about EU]
(2). China demand will implode [possible it could slow, but there is a lot of capacity for growth left and despite some corrections, I don’t know of an indicator to show it is declining, more the opposite].
(3). Switching to substitutes? [Possible. It’s hard to turn on a dime…unless you have a dual fired boiler. Takes time to build new gas power plants. Takes time to change your transit fleet to NG.]
(4) GW restrictions? [Donno. Doubt it. Seems like popularity of this has gone down as a political issue. Also, really coal is more in the gunsights. Yeah, we’ve had some CAFE standards in the US.]
(5) Other [you fill in]
c. Supply:
(1) US LTO (enough barrels to make a difference, some aspect of sustainability, obviously will peak, but long enough lasting to justify the 10 year out futures) [kind of see some support for this. You could say it’s crazy cornie wish fulfillment, but the record has been one of the crazy forecasts Underestimating US LTO. EIA has underpredicted the growth and may still be conservative. Perhaps the betting money makes the more optimistic Harold Hamm type predictions.]
(2) ROW LTO [yeah, we know the hurdles with the expertise and mineral rights…but the geology is there]
(3) A hardcore drill, baby, drill in the US (Atlantic Coast in play, Keystone approved, ANWAR open) [I don’t see this happening. Democratic party has at least half the power in the US and just hates these ideas. The Bakken/EF happened on private and state land in Republican states and sort of blindsided the Solyndra neoliberal types.) Plus look at Cali/NYS fracking restrictions.]
(4) Peace breaks out in the Middle East and a bunch of Axis of Evil barrels come on line. [Not seeing it likely; my gut would be market pricing in the opposite, along with threats to the Gulf states, Gail is right here.]
(5) Other long term “big” developments (Kashagan, West Africa, US GOM, Brazil). [Don’t know much about it; Kopits does. I’m not seeing it from the little I know. Based on Kopits postings on the majors CAPEX seems more the opposite.]
(6) OPEC cracks and Saudi Arabia and the gulf flood the market like back in 1985-2005. [Not really seeing it on the horizon, but a girl can dream! Perhaps the curve is pricing in some percent probability of it. IOW 100->80 is like pricing in a 33% chance of going to 40. Oh..and I sure don’t buy the story that they don’t have more cheap oil up their sleeves…yeah the rig count is up and it’s “harder”, but it’s still “easy” on a relative scale. We sure have not had the SA Twilight in the Desert that Simmons/Campbell/Saniford predicted…that meme of SA being about to run out was peaker silliness, now disproven.]
(7) Other [you fill in]
—————-
Feel free to propose an alternate organization of the levers. Also, feel free to propose individual analyses that would help confirm/disprove some of the hypotheses above.
Would be good to do multiple methods (e.g. market interviews), not just time-price plots or stuff from government stats sources. Try something you haven’t done before. New methods create new learnings. Get a grant and put a grad student on it. I’m not sure what we get out of it…but try. It’s better than explaining depletion as if it were a new concept in petroleum economics.
Nony –
This is a pretty good summary, I think.
This issue can be approached through two schools of thought: (traditional) demand-constrained; and supply-constrained. Almost everyone uses demand-constrained; supply-constrained is associated with me.
Let me interpret events from both perspectives.
Demand Constrained
This is a traditional market analysis approach. It assumes that producers will produce as much oil as consumers care to buy. Therefore, there is no ‘shortage’, and incremental demand growth is truly only 1.0-1.3 mbpd / year, what we actually observe. This view is buttressed by the fact that oil prices have not budged in three years. Clearly, in this interpretation, the demand for incremental oil isn’t there. Therefore, if US shales are able to contribute 1.0 mbpd / year by themselves, then any incremental oil production above that should tank prices. Libya, and to a lesser extent Nigeria and Iran, represent major threats to oil prices, should they come back on line. Citi falls into this category.
BP and the IEA share this philosophy, with the difference that they see increasing OPEC spare capacity as offsetting any increase in production elsewhere, that is, the Saudis will reduce production to maintain oil prices above $100 / bbl Brent. But the price is fragile, necessarily resting on OPEC unity. In BP’s words: “The market requirement for OPEC crude is not expected to reach today’s levels for another decade (!) before rebounding. While we believe that OPEC members will be able to maintain discipline despite high levels of spare capacity, cohesion of the group is a key oil market uncertainty.” [My exclamation point.]
(http://www.bp.com/content/dam/bp/pdf/Energy-economics/Energy-Outlook/Energy_Outlook_2035_booklet.pdf, slides 32-33)
Now, you can imagine how this plays at the Management Committee meetings at BP (or the other majors, for that reason). The guys from Upstream (the folks trying to find and produce oil) are facing rapidly rising costs and real difficulty in replacing their production. Costs are very high. And yet, the boys in Economics are telling them that prices are fragile and hinging on the perpetual cohesion of OPEC.
So Upstream says, “Well, doesn’t price equal marginal cost, guys?” And the Econ guys say, “Yes, sure.” “Well then,” says Upstream, “if my marginal costs are $120 / barrel, why aren’t prices rising to this level? All the oil majors have this problem. Shouldn’t we be setting future prices expectations by marginal costs expected for that time? And another thing. How can we be struggling to hold production, and you’re telling us that the world is awash in oil and we exist only thanks to the goodwill of Saudi Arabia, who isn’t pumping any more than they were in 1979? So tell me, how does that work, because the good people sitting here in committee are afraid to approve my project, because you’re telling them that prices are apt to collapse, or could collapse anytime in the next ten years if King Abdullah finds himself in a bad mood. I think what you’re saying is total garbage, because it just doesn’t sync with what we see on the ground.”
And the CFO chimes in: “Yeah, theory is fine, but oil prices are unbelievably stable. Let’s be honest. If we can’t show $110 oil going forward, our financials don’t work, and the equity analysts will–are–eating us alive. I don’t think we’re on the razor’s edge. Oil is only getting harder to produce, and China’s a big country. I think it’s WYSIWYG, What You See is What You Get. So it’s $110, and if we’re wrong, well, we’ll explain that then.” Et voila! Exxon and Chevron are budgeting with $109 and $110 oil for 2017, even as the futures curve rested at $95 for Brent and $82 for WTI for that period.
So, that’s the demand-constrained approach, and you can imagine what sort of internal tensions this might produce at the IOCs, and frankly, at many NOCs.
Supply-Constrained Approach
A supply constrained approach says this: We are structurally short on oil. As a result, observed demand is not the same as inherent (unconstrained) demand. Under such circumstances, the price will rise from the competitive market price to the carrying capacity price, from which it can only increase with global purchasing power, figure 5.5% per year. On the other hand, this system is highly stable. If oil prices fall just a little bit, demand will rebound quickly, and prices will return to the carrying capacity price. The Saudis have nothing to do with it. Basically, the global oil system can take an additional 1 mbpd / year without much permanent effect on oil prices. As long as you can make money at $108 Brent, you can produce as much oil as you like. It’s not a volume-limited system.
In this view, the futures curve is mis-priced, because it reflects a demand-constrained interpretation of markets. What we will see, it argues, is stability in spot prices associated with the on-going march of futures prices towards the current spot price over time.
So far, the supply-constrained model has proved correct, and the reason Astenbeck Capital Management has sponsored me to write a book on the topic.
…Exxon and Chevron are budgeting with $109 and $110 oil for 2017, even as the futures curve rested at $95 for Brent and $82 for WTI for that period….In this view, the futures curve is mis-priced
uhmmm, why aren’t Exxon and Chevron investing heavily in the futures markets? They see an arbitrage opportunity here, right?
You seem to feel strongly about this analysis – are you in the futures markets? If not, why not?
Exactly!
You can see how conflicted the oil majors are. They’re stating they believe $110 is the right number, but they’re unwilling to act on it. Why would you drill for anything until the futures value equaled your marginal cost? There is no commonly accepted theory out there right now. I think the dialogue I wrote down likely fairly reflects the gist of discussions at the oil majors. (Again, the relevance of my book.)
I would point out that futures are up $5-6 since then. My client is doing quite well, thank you.
Majors have some differences from the NOCs or independents. Don’t extrapolate too much from Exxon and BP to “oil” overall.
1. We’ve added 3 million bpd of oil in the last few years. And it didn’t come from the majors.
2. The NOCs control most production.
I would have a big problem with letting engineers/geologists do projects assuming higher than futures oil cost. If they can’t find projects for less than that, they should just conserve cash. Don’t spend on bad projects. Maybe fire some engineers and geologists (after all there’s no projects for them).
Stephen:
Good luck with your book. And thanks for your kindness in chatting with me. Especially with my miniscule citation count 😉
I think instead of “supply constrained” and “demand constrained”, you should say free competition and cartel dictated. I’m not trying to be a weenie about terminology, but it really seems to be unnecessary confusion and maybe shows a lack of thinking in terms of micro economics (really understanding those crossed Xs). Also your comment about
Note also, that in either of these scenarios, it is possible to have different beliefs on the supply picture (just what the cost curve is, the geology, timing, etc.). For instance, you could be a free competition guy (OPEC no power) who thinks that the curve slopes because you think (or because you think the market thinks) LTO will keep coming in and pushing price down. Or you could think the opposite and just think the market is wrong (your position). Similarly, a cartel price believer could have differing ideas on the potential for new supply coming in.
I think the cartel believer still agrees that there are issues of supply and demand out there…but that this affects stability of the cartel. To the extent that there’s no cheap oil left outside of Arabia, OPEC is more stable. to the extent, there is…OPEC is unstable.
This remark also seems to show either poor explanation of supply/demand [on a professor’s website] or even just poor understanding of it: “As a result, observed demand is not the same as inherent (unconstrained) demand. Under such circumstances, the price will rise from the competitive market price to the carrying capacity price, from which it can only increase with global purchasing power, figure 5.5% per year. On the other hand, this system is highly stable. If oil prices fall just a little bit, demand will rebound quickly, and prices will return to the carrying capacity price.” I think it is very common for people to confuse the demand curve with price-volume movement because of a supply change. Also, you would be better off to talk about elasticity, etc. And what the heck is observed versus inherent demand? Anchor yourself to the PQ diagram and draw curves.
I would also argue that it’s hard to be an ultra believer in free competition pricing, given the 2008-9 intervention. [I still think it’s darned funny how that happened after James’s article where he said OPEC didn’t affect price.] Even the run-up from the early 2000s where OPEC “couldn’t stop price from going up”. I mean (1) what they heck were they doing with spare capacity if they were not an acting cartel? and (2) how come when prices wanted to go right back into the band that they supposedly tried to keep it in in the early 2000s (in 2008 crash), why did they intervene to send it back to 100?
I would also be a little wary of making arguments of the depletion. Are you (or James) really that much of a geologist? Why doesn’t he even have a cost curve showing the different segments (size and marginal cost) of resource? Why didn’t he or you predict the US LTO? Could we have more of it? Or ROW LTO? What about the sands?
I mean you have these nice charts of the states peaking, but it’s really not news to traders, BP economists, or anyone else the role of depletion. It’s not as sufficient argument to just flash those peak shapes. [And I think it’s funny how Colorado repeaked…I remember when you showed these charts before and said only N.D. 😉 And Texas is coming…when the biggest one of all…plus the entire U.S. has repeaked, how much will the little state charts mean?
P.s. I will let you have last word. Need to concentrate on client work. I am not in this industry and just like chatting about it for diversion.
The use of the word ‘cartel’ implies volition, that players are actively restraining production.
If this were so, we would expect stable to increasing productivity of capital, in dollar terms. If I can restrict supply and my costs are constant, then I should be able to increase price, thus my return on capital employed should increase, or at a minimum, remain stable. If I am supply-constrained but not a cartel, then we will see a major increase in capex as the price moves along the demand curve to the carrying capacity price. And this we did indeed see. However, after we reach the carrying capacity price, demand will only increase with shifts in the demand curve (hence the need for increased purchasing power). In other words, the collapse of productivity is capex in upstream is consistent with a supply-constrained scenario, but not consistent with a voluntary cartel.
Further, my estimates for inherent demand (at oil priced in the $55-65 / barrel range) are 2.9 mbpd / year, rising to 4-6 mbpd / year after 2020. Now, if the Saudis pumped full out, then maybe they could produce 15 mbpd (vs 10 mbpd now) and sustain it for some time (a decade or more). But that only covers 2-3 years of inherent demand growth. Thus, there is nothing Saudi can realistically do to keep up with demand over the longer term. They could theoretically reduce prices for a time, but could not influence them, even with extravagant levels of production, for more than a few years. China’s incremental demand will swamp anything the Saudis could conceivably put into play.
I think the collapse of productivity of capex speaks directly to issues of geology. If productivity collapsed by 80% over a decade, then clearly oil has become much, much harder to find and deliver.
I agree that we are running out of cheap oil outside Arabia. Heck, I agree that we are running out of cheap oil worldwide, including Arabia. But there is still cartel support of pricing. Look at the intervention in 2008-2009. Look at “spare capacity”.
Ask yourself what would happen to world oil price/volume if Saudi fields were divided amongst 10 competing players.
Production would be increased from 10 to 15 mbpd, with an earlier peak and a steeper decline.
The Arabian Peninsula is one of the most geologically stable regions of the world. This allows oil to pool in very large reservoirs like Ghawar. Thus, it’s not like the US, where there are many small fields. Saudi Arabia is more characterized by a few very large ones.
But the point is moot. Saudi Arabia is not a profit-maximize, it is a budget sufficer, and it is in the business for the very long run. It’s motivations are not the same as, say, the management of Exxon.
On the other hand, any of Venezuela, Iraq, Iran or Brazil would produce more under competitive market conditions. Respectively, production increases from current levels would be something like:
Venezuela: +4 mbpd
Iraq: +6 mbpd
Iran: +6 mbpd
Brazil: +2 mbpd (and rising)
Mexico: +1-2 mbpd
Russia: +2 mbpd
Argentina: +1-3 mbpd
All these countries would actually like to increase their production by these amounts (more or less). The failure to do so is not attributable to cartel-linked restrictions, but rather excessive government intervention in the sector.
The failure to do so is…attributable to…excessive government intervention in the sector.
That seems like an odd thing to say. Saudi Arabia production is highly professional even while being *directly* controlled by the (family) government. Venezuela arguably has less direct government control – the problem is that what direction there is, is (ahem!) not well planned…
On the other hand, production in the ME has been deeply affected by outside forces. Iran and Iraq can’t be discussed without looking at the history of outside intervention, which has suppressed production.
The “government is bad” meme seems inapplicable here.
Government has a different objective function(s), Nony. That’s why SOEs tend to be poorly run.
I’d say that the idea that SOE’s are badly run is badly exaggerated these days: it’s beneficial to people, like the oil industry, who will be hurt by the essential and necessary transitions* that must be led by government.
One thing that would help: not judging government based on private “objective function(s)”.
* Especially the transition away from fossil fuels.
I’m not sure any of this discussion of Opec has led anywhere, but one thing I’d like to see is a better understanding of who actually operates the cartel. It’s the Gulf Arab countries, and specifically the members of the Cooperation Council for the Arab States of the Gulf: Bahrain, Kuwait, Oman, Qatar, Saudi Arabia, and the United Arab Emirates. The rest of Opec are de facto observers who may call for cuts but never undertake them.
Saudi Arabia is a useful case history for at least two reasons: (1) They are the world’s largest net oil exporter, and they have traditionally served as the swing producer in OPEC and (2) If we look at the rates of change in the ECI Ratios (ratio of production to consumption) for the (2005) Top 33 net oil exporters, Saudi Arabia is pretty much the median case history on the following graph, showing the rates of change in ECI Ratios from 2005 to 2012, for the (2005) Top 33:
http://i1095.photobucket.com/albums/i475/westexas/Slide1_zps5a656e89.jpg
A declining ECI Ratio means that a country is trending toward zero net exports, when the ECI Ratio = 1.0 (and production = consumption). The above graph shows that 26 of the 33 countries were trending toward zero net exports as of 2012.
As noted up the thread, Saudi net oil exports have (so far) been below their 2005 rate of 9.1 mbpd (total petroleum liquids + other liquids, EIA) since 2005.
As annul Brent crude oil prices rose from $25 in 2002 to $55 in 2005, Saudi Arabia increased their net exports from 7.1 mbpd in 2002 to 9.1 mbpd in 2005. At this rate of increase, their net exports would have been at about 18 mbpd in 2013.
As annual Brent crude oil prices doubled again, from $55 in 2005 to the $110 range for 2010 to 2013 inclusive, Saudi net oil exports have been below the 9.1 mbpd for 8 straight years. Based on BP consumption data and EIA production data for 2013, Saudi net exports were about 8.5 mbpd in 2013, versus 9.1 mbpd in 2005.
Jeffrey,
Have you seen any analysis of Saidi internal oil consumption, including: types (power generation, passenger transportation, etc), and change over time? That would help your presentation a great deal, I think.
Nick G, thank you for reply and link…I consider your source as very weak but
I will run with it.
“(Reuters) – The United States’ reliance on coal to generate almost half of its electricity, costs the economy about $345 billion a year in hidden expenses not borne by miners or utilities, including health problems in mining communities and pollution around power plants, a study found.
Those costs would effectively triple the price of electricity produced by coal-fired plants, which are prevalent in part due to the their low cost of operation, the study led by a Harvard University researcher found.
“This is not borne by the coal industry, this is borne by us, in our taxes,” said Paul Epstein, a Harvard Medical School instructor and the associate director of its Center for Health and the Global Environment, the study’s lead author.”
Empirically, there is an element of truth to this article…In fact, I could cite a dozen of examples of man’s
degrading the environment…For every positive, there is a negative..Litter is one, which the Enviros never
address..A consumer purchase a soda pop can (plenty of pollution to get it to the retail store) and then depositing
the empty content on the byways..
I have serous doubts about the estimates given in the “study.” That these emissions cost between 2 to 3% of GNP, should
raise one’s eyebrow…A direct link to the “study” would have been much better…We, can all agree power plants
pollute but the degree of impact upon humans is all too elusive…Firstly, one would have to establish a direct link.
Secondly, you would need a controlled group and a very lengthy (over years) investigation..And thirdly, to validate
this “study” would require a peer review.
Furthermore, what is troubling is, Mr Epstein, association with Greenpeace (hardly peaceful) known
for acts of violence and lawlessness…
The planet, does have the ability to cleanse itself, albeit decades to do so…Moreover, the impact of this
pollution is minor, based on the fact that longevity continues to expand.
This direct assault on coal, (to benefit renewable resources) is no different than the campaigns launched
against lead and DDT.
Just like the EPA, this “study” does not measure the economic consequences of achieving a cleaner
environment..
Frankly, poverty and the standard of living, has the greatest impact on public health…More children around
the world die due to “dirty” water and sanitation than all the power plants’ pollution combined.
How many children and adults die annually from malaria because of the ban on DDT? It is shameful
and a discredit to the Enviro movement..From that last example, it is demonstrated that the Enviros
are more concerned about the Mother Planet, than human life and the standard of living.
It is an empirical fact that as the standard of living grows, the environment is a main beneficiary.
The introduction of coal, for heating, meant that logging of trees for fuel was no longer necessary..When
natural gas become available, coal too was quickly displaced…
The partially-free market place works it’s magic; all without the intrusion of mandates and regulations.
However, for the Enviro movement, the timetable is not fast enough nor does it allow for social
engineering…The EM only trust governmental units; mandates; and countless regulations; irrespective
of economic costs.
The fact is, that today’s environment is cleaner than ever; in part to mandates and regulations and the
EM but in the main because of America’s massive increase in wealth…Impact the wealth cycle and you
will degrade the environment by default.
The EM only trust governmental units; mandates; and countless regulations; irrespective
of economic costs.
Economic costs are precisely what I’ve been talking about. Do we really want to subsidize fossil fuels by allowing them to run up a lot of costs without charging them for it?? That’s theft – why are why allowing fossil fuel companies to steal from the rest of us?
Nick G, the industry which made America prosper and great
is now the villain of all times…
What is the cost of Smart Phone users, whom cause tens of
thousands of crashes? “run up a lot of costs without charging them for it?? That’s thief”
What about beer and alcohol industry whom are responsible
for tens of thousand consumers’ failing health? “run up a lot of costs without charging them for it?? That’s thief”
What about fast food industry, which are responsible for
millions of people by providing a unhealthy diet? “run up a lot of costs without charging them for it?? That’s thief”
Just like the Energizer Bunny, I can go on and on and on…
the industry which made America prosper and great is now the villain of all times
A lot of other industries made America prosper – oil is just one of many. Don’t mythologize coal. US growth was faster before 1945, using moderately expensive, non-oil energy:
1800-1900: 4.13%
1900-1945: 3.53%
1945-2000: 3.17%
“real GDP” at http://www.measuringworth.com/growth/index.php
The 19th century economy was starting from a smaller base, but it’s tough to argue that the new kid on the block, oil, “goosed” the economy.
Oil is a bit more convenient – for instance, Churchill converted the British navy from coal to oil because they could “steam” just a little faster than the competition – but civilization would have been just fine without it. Rail would have kept it’s central role for freight and passenger traffic, cars and planes would have been less numerous and shorter range, and used batteries and ethanol, etc.
What is the cost of Smart Phone users…tens of thousands of crashes…beer and alcohol industry…failing health…unhealthy diet?
Those costs are primarily paid by the consumers. If they’re willing to buy products that crash, and make them sick, well, “that’s their karma”.
oops – “Don’t mythologize coal” should have been “Don’t mythologize oil”.
Nick G, stunning stats…I learned something from your post.
I was under the impression, that much of the first half of the
19th century saw very slow grow, under 1.5% per year or less.
Thanks for the illumination.
http://www.nber.org/chapters/c1565.pdf
You’re welcome!
We will split the win, Nick…
There is not enough capacity to power 300 million vehicles (capacity expansion would be required)
but then that is only a theoretical possibility.
http://www.popularmechanics.com/cars/alternative-fuel/electric/4326332?nav=RSS20&src=syn&dom=yah_buzz&mag=pop
Right – the current grid has spare capacity at night: we have vast amounts of under-utilized electricity infrastructure . . . at night. The DoE did a study on this. With just the existing infrastructure, you can charge up 73% of the existing light-duty fleet as long as you charge up at night. Just offer a reduced night-time rate. All the new EVs can be programmed when to start charging.
http://energyenvironment.pnnl.gov/ei/pdf/PHEV_Feasibility_Analysis_Part1.pdf
and it’s not a big deal to expand the grid a bit more over 20 to 30 years.
Nony
July 24, 2014 at 10:43 am
I read them and they were not sufficient. Honest, I have referred to ‘your 2008 white paper’ before. So the idea that I hadn’t seen it is strange.
Yes, it is a smoking gun. They dropped production when price started dropping! 31.2<<33.7. Look at the specific players and how they cut production. That was a clear act of market power. A free competitor does not drop production the way SA, KUW, and UAE did.
Nony, rather brilliant post!
Looking at the Cartel's production one needs to add a political
and market pricing component.
Nick G
July 27, 2014 at 12:58 pm
we are not EuroLand
What do you mean? Europe doesn’t have a reasonably comparable economy?
NIck G, this is not an economic function but rather social and density issue.
Euroland, in the main has more renters than home owners..Thus housing is
densified; vehicle traffic tightly restriction in my city centers and of course the
cost of petrol.
The extremely high density, over the pond, explain the use of mass transit as well
as the high cost of gasoline and thus the lower dependency for crude oil.
There only two Euro states which have a low density that the USA – Norway and Sweden.
As a result, Americans are simply more dependent upon the ICE as a mode of transportation.
Euroland is simply more urbanized and thus requires less BTUs..
http://www.infoplease.com/ipa/A0934666.html
Hans wrrote: “Euroland is simply more urbanized and thus requires less BTUs.. ”
That is not correct, in both, the USA and Europe, around 70% of the opeople live in urban centres, according to Brookings Institution.
The distance betweeen urban centres is of course larger in the USA or Canada, however, this does not affect the transportaion within an urban centre.
New Mexico looks like it’s heading for a new peak. I wonder if you just look at Permian projections, if that would be the consensus prediction now. Maybe even this year or next.
Utah also trending up although I’m not sure what driving it.
Kemp: Forecasts for Higher Oil Prices Misjudge the Shale Boom – See more at: http://www.rigzone.com/news/oil_gas/a/134256/Kemp_Forecasts_for_Higher_Oil_Prices_Misjudge_the_Shale_Boom/?all=HG2#sthash.DZhAYw7a.dpuf
Kemp is a very well respected oil reporter. One of my favorite business journalists since he is analytical.
Thirty-five years ago Dan Yergan and Rodger Stobaugh wrote “Higher real oil prices seem assured for the future, with the only question being how soon and how high.” (Energy Future: A report of the Energy Policy Project at the Harvard Business School,” Random House 1979.) At the time oil traded for $40/bbl. Seven years latter prices fell to $10/bbl. They did so again in 1999.
Professor Hamilton’s conclusion that “hundred-dollar oil is here to stay” will join the earlier quote in infamy.
Yergan and Stobauth as well as many other writers failed to understand what Morry Adelman knew. Adleman recognized there were abundant reserves which technology would one day unlock. Almost 40 years later his research is being validated. Adelman did what most other researchers today will not do. He got his hands dirty working with the AAPG in the 60s, 70 and 80s. Five years ago EIA projected US production of 6 million barrels a day in 2013. I believe the actual number was 8 million barrels a day. We frankly have no idea how much technology will add to production in 2020. Nor do we know how technology and regulation will change consumption.
The long term trend of prices is no doubt higher for the basic reason that investors are demanding that major companies produce returns. Investment will decline – as well use. However, oil is a commodity and prices will fluctuate over a wide range. $100/bbl is not the floor.
A more recent prognostication from Yergin regarding oil prices, which caused me to suggest that we price crude oil in “Yergins,” with One Yergin = $38 per barrel:
Digital Rules
Capitalism’s Amazing Resilience
Rich Karlgaard, 11.01.04,
http://www.forbes.com/forbes/2004/1101/041.html
Excerpt (emphasis added):
And a more comprehensive summary of points I made up the thread:
Did Global Crude Oil Production Peak in 2005?
In my opinion it is very likely that actual global crude oil production (45 or lower API gravity crude oil) peaked in 2005, while global natural gas production and associated liquids (condensates & natural gas liquids) have so far continued to increase.
I’ve always thought it odd that when we ask for the price of oil, we get the price of 45 or lower API gravity crude oil, but when we ask for the volume of oil, we get some combination of crude oil + condensate + NGL (Natural Gas Liquids) + biofuels + refinery gains.
This is analogous to asking a butcher for the price of beef, and he gives you the price of steak, but if you ask him how much beef he has on hand, he gives you total pounds of steak + roast + ground beef. Shouldn’t the price of an item directly relate to the quantity of the item being priced, and not to the quantity of the item plus the quantity of (partial) substitutes?
In any case, the closest measure of global crude oil production that we have is the EIA data base that tracts global Crude + Condensate (C+C). In regard to this data base, a key question is the ratio of global condensate to C+C production. Unfortunately, we don’t appear to have any global data on the Condensate/(C+C) Ratio. Note that when the EIA discusses “crude oil” they are talking about C+C.
Insofar as I know, the only complete Condensate/(C+C) data base, from one agency, is the Texas RRC data base for Texas, which showed that the Texas Condensate/(C+C) ratio increased from 11.1% in 2005 to 15.4% in 2012. The 2013 ratio (more subject to revision than the 2012 data) shows that the 2013 ratio fell slightly, down to 15.0%, which probably reflects more focus on the crude oil prone areas in the Eagle Ford. The EIA shows that Texas marketed gas production increased at 5%/year from 2005 to 2012, versus a 13%/year rate of increase in Condensate production. So, Texas condensate production increased 2.6 times faster than Texas marketed gas production increased, from 2005 to 2012.
The EIA shows that global dry gas production increased at 2.8%/year from 2005 to 2012, a 22% increase in seven years. If the increase in global condensate production only matched the increase in global gas production, global condensate production would be up by 22% in seven years. If global condensate production matched the 2005 to 2012 Texas rates of change (relative to the global increase in gas production), global condensate production would be up by about 67% in seven years.
We don’t know by what percentage that global condensate production increased from 2005 to 2012. What we do know is that global C+C production increased at only 0.4%/year from 2005 to 2012. In my opinion, the only reasonable conclusion is that rising condensate production accounted for virtually all of the increase in global C+C production from 2005 to 2012, which implies that actual global crude oil production was flat to down from 2005 to 2012, as annual Brent crude oil prices doubled from $55 in 2005 to $112 in 2012.
The following chart shows normalized global gas, NGL and C+C production from 2002 to 2012 (2005 values = 100%).
http://i1095.photobucket.com/albums/i475/westexas/Slide1_zps45f11d98.jpg
The following chart shows estimated normalized global condensate and crude oil production from 2002 to 2012 (2005 values = 100%). I’m assuming that the global Condensate/(C+C) Ratio was about 10% for 2002 to 2005 (versus 11% for Texas in 2005), and then I (conservatively) assume that condensate increased at the same rate as global gas production from 2005 to 2012, which is a much lower rate of increase in condensate (relative to the increase in gas production) than what we saw in Texas from 2005 to 2012.
http://i1095.photobucket.com/albums/i475/westexas/Slide2_zpse294f080.jpg
Based on foregoing assumptions, I estimate that actual annual global crude oil production (45 or lower API gravity crude oil) increased from about 60 mbpd (million barrels per day) in 2002 to about 67 mbpd in 2005, as annual Brent crude oil prices doubled from $25 in 2002 to $55 in 2005.
At the (estimated) 2002 to 2005 rate of increase in global crude oil production, global crude oil production would have been up to about 90 mbpd in 2013.
As annual Brent crude oil prices doubled again, from $55 in 2005 to an average of about $110 for 2011 to 2013 inclusive, I estimate that annual global crude oil production did not materially exceed about 67 mbpd, and probably averaged about 66 mbpd for 2006 to 2013 inclusive.
So Far, Global Net Exports of Oil Peaked in 2005
Because of the way that we define net exports, we have to deal in terms of total petroleum liquids (plus other liquids for the EIA data set).
Some definitions:
Global Net Exports (GNE) = Combined net exports from (2005) Top 33 net oil exporters, total petroleum liquids + other liquids (EIA), which accounted for about 99% of total global net exports of oil in 2005
Available Net Exports (ANE) = GNE less Chindia’s Net Imports (CNI)
CNE = Cumulative Net Exports (for a given time period)
ECI (Export Capacity Index) Ratio = Ratio of production to consumption
GNE/CNI Ratio is analogous to the ECI Ratio
Six Country Case History. The Six Country Case History consists of the major net oil exporters (net exports of 100,000 bpd or more) that hit or approached zero net exports from 1980 to 2010, excluding China. China, like the US, became a net importer prior to a production peak, because of a rapid rate of increase in consumption. Combined production from the Six Countries virtually stopped increasing in 1995, showing only a 2% increase from 1995 to 1999.
The following chart shows the normalized values for production, ECI Ratio, net exports and remaining post-1995 CNE (Cumulative Net Exports) by year (1995 values = 100%).
http://i1095.photobucket.com/albums/i475/westexas/Slide2_zps6c3a6280.jpg
Note that even as production increased slightly from 1995 to 1999 (by 2%), net exports fell, because of rising consumption, as illustrated by the decline in the ECI Ratio. And note that even as production increased from 1995 to 1999, remaining post-1995 CNE fell by 54%.
Estimated Six Country post-1995 CNE were about 9.0 Gb (billion barrels) based on the 1995 to 2002 rate of decline in their ECI ratio. Actual post-1995 CNE were 7.3 Gb.
The key point is that a declining ECI Ratio corresponded to a rapid rate of depletion in remaining CNE, and even as Six Country production rose from 1995 to 1999, the rate of depletion in remaining post-1995 CNE accelerated, from 15%/year in 1996 to 26%/year in 1999.
Global Net Exports of oil (GNE). GNE, the combined net exports from the top 33 net exporters in 2005, fell from about 46 mbpd (million barrels per day) in 2005 to about 44 mbpd in 2012 (2013 EIA consumption data not yet available, but I estimate that GNE in 2013 fell to around 43 mbpd). Combined production from the top 33 net exporters in 2005 rose slightly from 2005 to 2012, but because consumption increased faster than production, net exports fell, as evidenced by the decline in the ECI Ratio.
The following chart shows the normalized values for production, ECI Ratio, net exports and estimated remaining post-2005CNE (Cumulative Net Exports) by year (2005 values = 100%).
http://i1095.photobucket.com/albums/i475/westexas/Slide14_zpsbd9a272e.jpg
Based on the 2005 to 2012 rate of decline in the Top 33 ECI Ratio, I estimate that remaining post-2005 Global CNE fell by about 21% by the end of 2012. As noted above, this methodology was too optimistic for the Six Country Case History, in regard to estimating post-1995 CNE.
Available Net Exports of oil (ANE). ANE are defined as Global Net Exports of oil (GNE) less the Chindia regions (China + India’s) net imports (CNI). ANE fell from 41 mbpd in 2005 to 35 mbpd in 2012. Based on some preliminary 2013 data, I estimate that ANE fell to between 33 and 34 mbpd in 2013 (versus 41 mbpd in 2005).
The following chart shows ANE from 2002 to 2012, including the gap between actual post-2005 values and where we would have been at the 2002 to 2005 rate of increase in ANE.
http://i1095.photobucket.com/albums/i475/westexas/Slide04_zpsd68833b7.jpg
The GNE/CNI Ratio is analogous to the ECI Ratio. The following chart shows 2002 to 2012 GNE/CNI data, with the extrapolation based on the 2005 to 2012 rate of decline in the ratio. Based on some preliminary 2013 data, I estimate that the 2013 GNE/CNI value will be between 4.6 and 4.7, which would be consistent with the following projection.
http://i1095.photobucket.com/albums/i475/westexas/Slide20_zps26112103.jpg
At a GNE/CNI Ratio of 1.0, China and India alone would theoretically consume 100% of Global Net Exports of oil, leaving no net oil exports available to about 155 net importing countries. Of course, the global economy can’t survive if only two countries are consuming anywhere close to 100% of Global Net Exports of oil, but that has been direction we have been headed in since 2002, up to and including 2013.
What happened from 2002 to 2012 is clear. The following chart shows normalized liquids consumption for China, India, the (2005) Top 33 net oil exporters and the US from 2002 to 2012 (2002 values = 100%) versus annual Brent crude oil prices (in red). Based on BP data, China’s consumption in 2013 was up to 204% of the 2002 value.
http://i1095.photobucket.com/albums/i475/westexas/Slide14_zpsb2fe0f1a.jpg
I’ve called what happens from 2012 to 2022, and in following years, to the GNE/CNI Ratio the “$64 Trillion Question.” The conundrum is that we continued to slide, at least through 2013, toward a point in time–a GNE/CNI Ratio of 1.0–that we cannot arrive at.
The absolutely mind-boggling numbers are the estimated post-2005 Available CNE and the rate of depletion in remaining post-2005 Available CNE. Based on the seven year 2005 to 2012 rate of decline in the GNE/CNI Ratio, I estimate that post-2005 Available CNE (the estimated cumulative volume of post-2005 net oil exports available to about 155 net oil importing countries) are about 175 Gb (billion barrels). Through 2012, we burned through about 95 Gb of estimated post-2005 Available CNE, leaving remaining estimated post-2005 Available CNE at about 80 Gb.
Based on my estimates, at the 2012 rate of consumption of ANE, the remaining volume of Available CNE (Cumulative Net Exports) would be depleted in about six years. Of course, the expectation is for a continuing decline in ANE, so Available CNE would not be depleted in six years, but this gives one an indication of just how catastrophic that the ongoing estimated depletion in Available CNE has been.
Tight/Shale Plays to the Rescue?
Of course, the conventional wisdom is that increased production from North American and global tight/shale plays will power the globe to a virtually perpetual rate of increase in global oil and gas production.
However, while the strong rebound in US oil and gas production has been very impressive—and critically important to the US economy–it’s interesting to look at some regional declines in US oil and gas production, e.g., marketed Louisiana natural gas production (the EIA doesn’t have dry processed data by state).
According to the EIA, the observed simple percentage decline in Louisiana’s annual natural gas production from 2012 to 2013 was 20%. This would be the net change in production, after new wells were added. The gross decline rate (from existing wells in 2012) would be even higher. This puts a recent Citi Research estimate in perspective.
Citi estimates that the gross underlying decline rate for overall US natural gas production is about 24%/year. This would be the simple percentage change in annual production if no new sources of gas were put on line in the US. In round numbers, this requires the US to add about 16 BCF/day of new gas production every year, just to maintain about 66 BCF/day of dry processed natural gas production. To put 16 BCF/day in perspective, dry processed natural gas production from all of Texas was probably at about 18 BCF/day in 2013.
Based on the Citi report, the US would have to replace 100% of current natural gas production in about four years, just to maintain a dry processed gas production rate of 66 BCF/day (24 TCF/year) for four years.
Or, based on the Citi report, the US has to replace the productive equivalent of all of the 2012 dry natural gas production from the Middle East, in a little over three years (3.3 years), in order to maintain a dry production rate of 24 TCF/year. Over a 10 year period, we would need to put on line three times the 2012 production rate from the Middle East, in order to maintain current production for 10 years.
On the oil side, according to the EIA, the observed 10 year exponential rate of decline in Alaska’s annual Crude + Condensate (C+C) production from 2003 to 2013 was 6.5%/year. This would be the net change in production per year, after new wells were added. The gross decline rate from existing wells would be even higher.
If we assume a probably conservative gross decline rate of 10%/year from existing US C+C production, in order to just maintain current production for 10 years, we would have to replace the productive equivalent of every oil field in the US over the next 10 years–the productive equivalent of every oil well from the Gulf of Mexico to the Eagle Ford to the Permian Basin to the Bakken to Alaska.
Of course, the general consensus is that the tight/shale revolution will spread around the world, and it’s certainly possible, but note that in 2013, while overall Bakken Play production was still increasing, the average Bakken oil well produced a little over 100 bpd, while the median production rate was less than 100 bpd, with a very high per well decline rate. Furthermore, this does not take into account wells that have already been plugged and abandoned. I have a hard time believing that per well production rates like this will work in much higher operating cost areas around the world.
In addition, as the Monterey Shale Play case history shows (the EIA reduced their estimate of possible recoverable reserves by 95%), not all US shale plays will be commercially productive in meaningful quantities, and most commercial plays in the US tend to be gas prone.
Summary
In my opinion, it is very likely that actual global crude oil production (45 or lower API gravity crude) has been at or below the 2005 production rate for eight straight years, 2006 to 2013 inclusive, even as annual Brent crude oil prices doubled from $55 in 2005 to the $110 range in 2010 to 2013 inclusive.
In other words, actual global crude oil production probably peaked in 2005, while global natural gas production and associated liquids, condensate and NGL, have so far continued to increase.
Furthermore the data indicate that Global Net Exports of oil (GNE) have been below the 2005 rate for seven, and almost certainly eight, straight years, while the developing countries, led by China, have (so far) consumed an increasing share of a post-2005 declining volume of GNE.
The reality we are facing is that given an ongoing decline in GNE, unless the Chindia region cuts their consumption of GNE at the same rate as the rate of decline in GNE, or at a faster rate, the resulting rate of decline in ANE (the volume of net exports available to importers other than China and India) will exceed the GNE decline rate and the ANE decline rate will accelerate with time. It’s a mathematical certainty.
In my opinion, we are experiencing an almost totally unrecognized, but nevertheless catastrophic, rate of depletion in the remaining cumulative volume of Global Net Exports of oil available to importers other than China and India.
Based on my estimates, at the 2012 rate of consumption of ANE, the remaining volume of Available CNE (Cumulative Net Exports) would be depleted in about six years. Of course, the expectation is for a continuing decline in ANE, so Available CNE would not be depleted in six years, but this gives one an indication of just how catastrophic that that I estimate that the ongoing depletion in Available CNE has been.
As a general rule, I’ve found that almost no one is aware of any aspect of the foregoing, and those who are aware of it tend to dismiss it, but the lack of knowledge of “Net Export math,” or one’s denial of same, does not alter the fact that the basic math is irrefutable.
I’ve used the “Midnight on the Titanic” metaphor before, to-wit, the ship hit the iceberg at 11:40 P.M. on the night of April 14th, and at around midnight perhaps three people on the ship–about 0.1% of those on board–knew that the ship would sink, but that did not mean that the ship was not sinking. The ship’s pumps helped, but they could not come close to fully offsetting the flood of seawater coming into the ship. According to Walter Lord, the passengers on the first (partially full) lifeboat to leave the ship were ridiculed by some passengers were still on board.
I suppose that the fact that the Titanic would sink is a classic example of a predicament versus a problem, i.e., there was no way to save the ship; the best that the captain could do was to try to save as many people as possible (problems have solutions, but one has to develop ways to cope with a predicament).
Philip Verleger:
It’s interesting to review the pattern of subsequent year over year declines in annual crude oil prices, since the late nineties:
Recent Global Annual Crude Oil Prices
We have of course seen a cyclical pattern of higher annual highs and higher annual lows in global (Brent) crude oil prices in recent years, but I think that the rates of change between successive annual price lows, or troughs following annual oil price peaks, is very interesting.
Peak to Trough Annual Brent Crude Oil Prices, 1997 to 2013
1997: $19
1998: $13
2000: $29
2001: $24 (1998 to 2001 rate of change: +20%/year)
2008: $97
2009: $62 (2001 to 2009 rate of change: +12%/year)
The 11 year 1998 to 2009 overall of change in trough prices was +14%/year. And then we have 2012 to 2013.
2012: $112
2013: $108
The four year 2009 to 2013 rate of change in the trough price would be +14%/year ($62 to $108).
The long term 15 year 1998 to 2013 rate of change in trough prices would also be +14%/year ($13 to $108).
If the (+14%/year rate of change) pattern holds, and we were to see a year over year decline in annual Brent crude oil prices in 2017, it would be down to an annual Brent price of about $190 in 2017.
Following is an excerpt from an early 2013 OECD working paper (which curiously enough seems to be somewhat at odds with IEA oil price scenarios) which forecasts sharply higher global crude oil demand (and potentially) much higher oil prices:
Nick G
“The Chevy Volt is already at 200MPG.” Poppycock.
“More importantly, the average car on the road is only 22MPG, so we don’t need anything better than the Prius to cut fuel consumption by 50%.” In theory that is clearly true, however, in the real world it will not provide the answer. Not everyone can afford nor wants a rice burner.
“The average car gets sold every 3-4 years. Over that time, you save money. Look closely at the Edmunds charts – the fuel, maintenance and repair savings are greater than the extra depreciation.”
In today’s modern vehicles, their is little maintenance and repair in a three year old auto.
“Very, very few Prius batteries are ever replaced, even after 15 years.” Sorry all batteries wear out and much quicker
than you suggest.
“Cinda Gobeille had to garage her Toyota Prius when the battery gave out after a healthy life of 10 years and 144,000 miles. The car looks great, she says. But without a new battery, which dealers say will cost up to $4,200, her hybrid simply won’t turn on.
“It could get 50 miles per gallon on a good day,” says Ms. Gobeille, a nurse case manager from Woonsocket, R.I. “When the battery was dying, it dropped down to probably 35 [m.p.g.]. It’s a great little car. I really enjoyed my Prius, but this battery system is just too expensive to replace on such an old car.”
Gobeille has held on to the dormant Prius while she investigates third-party batteries, which she says could cost $1,300.”
“Also, remember that the average new car costs more than $30k: that’s more than a Prius.”
Nick, I guess they are a little more affordable than I thought.
http://www.cars.com/toyota/prius/2014/costofownership
“There are plenty of other reasons to kick the oil habit.” Let us allow market forces to determine
when and how..
” Most “anti-carbon forces” would be delighted with a simple carbon/fuel tax. That wouldn’t have any impact at all on civil liberties.”
The left is always fond of taxes…High taxes do suppress liberties and it’s a reason why people
have left the UK and currently France and the USA. Furthermore, it is not only taxes but the
regressive form of management – regulation…Anytime you reduce options for the individual
you strike at the heart of liberty.
“We’re destroying our civil liberties right now, all in the name of fighting wars. Those wars would be unnecessary if we weren’t dependent to oil.” Oh dear, how many wars were fought before oil or even coal?
Remember what Carl Von Clausewitz said, War is just the extension of policy.
Nick, I have enjoyed this dialogue with you..You are a good sport..
This thread, however, is getting rather unwheelding and difficult to
navigate…Thank you for your time and labor.
You’re welcome.
Let me address one question, as it’s fairly straightforward:
“The Chevy Volt is already at 200MPG.” Poppycock.
The EPA rating is about 100MPG, but that includes electricity, which is domestic, and can come from very clean sources. We see on the EPA website that an unofficial bunch of owners got 128MPG. Many people get 200MPG. Most people don’t drive more than 35 miles, most days, so it’s easy to do.
The EPA estimate is $7,000 in savings in 5 years, so in 15 years you’d save $21,000.
http://www.fueleconomy.gov/feg/Find.do?action=sbs&id=32655
Nony, my response to Kemp:
http://blogs.platts.com/2014/07/30/peak-oil-forecasts/
Kemp is a sharp guy. My favorite journo writing about oil/gas. Has a background as a market analyst. Plus just reading him…he “gets it”. Like reading Brealey and Myers. They just get it.
I think a lot of Hamilton’s argument for oil prices staying high is that they’ve been high for 5 years. [Yeah, yeah, there’s more in the article, but a lot of it comes from that.] But that’s dangerous. Commodity prices can move. And the futures prices are backwarded. Betting money on the table. A market indicator. 🙂
Can’t be too impressed over Hamilton arguments on supply when he has not published and looked at a supply cost curve (described the segments’ size, cost, characteristics, future outlook) and when he discusses depletion with a sort of “hey, you all don’t know about this, let me explain it” attitude. And also when he DIDN’T predict LTO (a freaking dramatic 3.5 million bpd addition in record time)…and he relied on underpredictions as it ramped up.
A thoughtful analysis would at least include possibility of LTO outperforming. I’d even say that possibility of a (nonprice) crash in LTO [outside peaker sites and advocates like Berman] is low…we just know enough about infill drilling. This leads you to something like EIA, who has a base case and then down and up case. And they are NOT symmetric. Uncertainty is on the upside. Base and low very similar. Up case is dramatically higher.
Any forecast is subject to changes in technology, which are by nature hard to anticipate.
Having said that, Jim’s point and mine, is that shale oil has not visibly changed the story. And shale oil is very successful in terms of output! A gain of 1 mbpd / year is spectacular. And WTI has risen since.
Now, if we could get shale oil production gains to 2 mbpd / year, then you have something.
Any forecast is subject to changes in technology, which are by nature hard to anticipate.
Not really – the tech for the new supply is already here. You just have to be willing to think outside the oil industry box.
The new supply is hybrids, PHEVs, EREVs and EVs (passenger fuel is more than 50% than US fuel consumption). It’s rail for freight. It’s a host of smaller things, like LNG for long-distance truck fleets with fixed routes, ride sharing for commuting (think Uber), solar for island power generation, heat pumps for HVAC, etc.
What makes you think you have such special insights into supply costs and amounts if you didn’t predict the LTO? If you underestimated it as it was ramping up? If you lack a chart that shows a supply curve? If you lack a quantitative discussion of the segments of supply?
Exxon upstream capex:
H1 2014: $15.7 bn
H1 2013: $20.1 bn
Change: -22.2%
That’s capex compression!
They read your article about how how their production to capex ratio sucked and decided to make the ratio better by pruning back projects.
Wah-la! Raise the ratio by cutting the denominator. 😉
P.s. I have a funny feeling that XTO in the Bakken is getting all their CARs approved. 😉
If huge upstream spending levels have only kept actual crude oil production (45 or lower API gravity crude oil) on an “Undulating Plateau” since 2005, what happens when upstream expenditures decline?
Don’t have the numbers yet, Jeffrey, but it’s likely that it ends ugly.
See Shell’s investor presentation today. Very, very sober in tone.
I’d be interested in this analysis:
Compare the capital going into the US shale boom to the capex that the majors are cutting. If you net the two, what’s the result? IOW, when you look at the (private) industry as a whole, is it more like investment is still happening, just in a different place?
It’s fine to talk about all these capital budget cuts at the majors. But there’s also an AMAZING story of HUGE $$$ of investment going into the US LTO boom. Those wells don’t get drilled and fracked on their own, even infrastructure going in and the like (lot of pipeline projects around the country).
Nony,
Back of envelope: The oil majors will be producing oil at 6 mbpd in 2020, down 8 mbpd from current levels. Shale will be 2-3 mbpd higher.
That’s finger to the wind. Not better than that right now.
S.
Shale is up 3 million bpd in last 4 years. Majors are down how much in same 4 years? 😉 [And yes, I realize there is some overlap of shale and majors.]
I think if you are going to look at the majors cutting capital as sort of “the industry giving up” and showing no good new projects worth going after (better to give the money back to shareholders), it’s not completely valid. You have to be wary of extrapolating “majors” to cover “oil industry” when there are HUGE investments going into shale via independents. Even to the extent of peaker critics complaining that it’s a bubble. I mean how is “milking, giving up” consistent with “speculative bubble”? 😉
I think it’s fine to cover the majors. They are important. Heck, depletion is important. Just be careful and be fair. James may have a big reputation, but all his time covering oil didn’t give him the insight of what was going on with US shale. If anything, perhaps his biases led him to underestimate it.
Look at Jim’s chart, Nony. It shows US shale production as a separate category! And I am referring to production from this point forward, not historical.
I’m probably being too hard on the majors. Petrobras should be up 1-2 mbpd by 2020, so I probably need to up the 6 mbpd to 7.5 or so.
Production at the oil majors fell by 1 mbpd last year, after falling 0.75 mbpd each of the previous two years. If it continues to fall at a 1 mbpd / year pace, that’s a reduction of 7 mbpd by 2020 on current production of 14 mbpd.
However, that pace should increase, just as Jeffrey has suggested, because capex is imploding, and will continue to unravel. So if I start accelerating the decline, well, you can add barrels as well as I can. It’s not hard to get to an 8 mbpd fall to 2020, implying a 6 mbpd production rate.
Now, that probably understates production, because there are some gains on the horizon, at Petrobras and Chevron, for example. But I would not be surprised to see sub-8 mbpd production from the majors by 2020. I am currently in process on that chapter of the book. Let me circle back when I’ve had a chance to digest the numbers a bit better.
You do get a sense of what I mean by “it ends ugly”, no?
I’d be curious to see an analysis of production costs.
Any time investment is ramped up quickly, there will be inflation: salaries will rise, suppliers will raise their prices, property owners will demand more royalties, etc. This tends to be temporary, as rising prices draw more supply of all of these factors. We’re seeing this very strongly with tight oil. but I think the majors are seeing it too.
So, how much of falling capex productivity is this kind of temporary inflation?
That’s a good question, Nick.
I had wanted to do a study on the matter a year ago; maybe I’ll get another crack as I finish the book.
I think you also need to think about what productivity goes with what capital (some pretty different time frames of these investments).
I guess for the majors, you could look at how much new production (not just increased production, but new production compensating for declines) they get from how much investment. Even that is an issue since the current new production might be from capital invested 5 years ago.
Not sure the perfect answer, but it’s something to watch for.
Consider the framework that EIA uses for the shale plays.
I’ve just been reading up on Morris Adelman. Really savvy guy. My suspicions of the cartel issues in pricing seem more substantiated. Even the interaction of speculation with cartel dynamics versus speculation on fundamental supply/demand seems of interest. And…he was a pretty big name. Bet he had more than 415 citations! Really like his micro versus macro slant also.
And the comments about technology innovation seem prescient. Yes James can’t know how tech will develop. But he can be more wary of that it might…especially given the history. I also heard some professor (maybe the Switch guy from UT) talk about how amazing it is the rate of tech development while the market is high.
Interesting article on methane hydrates. Neither a corn hype, nor a peaker dismissal. More of a thoughtful reflection. In particular, feel for the author with his comments on how he could have gotten behind shale fracking earlier and missed the boat.
http://grist.org/climate-energy/what-if-we-never-run-out-of-oil/
A good article. Here’s what I noticed – our dependence on oil creates war:
“Winston Leonard Spencer Churchill was appointed First Lord of the Admiralty in 1911. With characteristic vigor and verve, he set about modernizing the Royal Navy, jewel of the empire. The revamped fleet, he proclaimed, should be fueled with oil, rather than coal — a decision that continues to reverberate in the present. Burning a pound of fuel oil produces about twice as much energy as burning a pound of coal. Because of this greater energy density, oil could push ships faster and farther than coal could.
Churchill’s proposal led to emphatic dispute. The United Kingdom had lots of coal but next to no oil. At the time, the United States produced almost two-thirds of the world’s petroleum; Russia produced another fifth. Both were allies of Great Britain. Nonetheless, Whitehall was uneasy about the prospect of the Navy’s falling under the thumb of foreign entities, even if friendly. The solution, Churchill told Parliament in 1913, was for Britons to become “the owners, or at any rate, the controllers at the source of at least a proportion of the supply of natural oil which we require.” Spurred by the Admiralty, the U.K. soon bought 51 percent of what is now British Petroleum, which had rights to oil “at the source”: Iran (then known as Persia). The concessions’ terms were so unpopular in Iran that they helped spark a revolution. London worked to suppress it. Then, to prevent further disruptions, Britain enmeshed itself ever more deeply in the Middle East, working to install new shahs in Iran and carve Iraq out of the collapsing Ottoman Empire.
Churchill fired the starting gun, but all of the Western powers joined the race to control Middle Eastern oil. Britain clawed past France, Germany, and the Netherlands, only to be overtaken by the United States, which secured oil concessions in Turkey, Iraq, Bahrain, Kuwait, and Saudi Arabia. The struggle created a long-lasting intercontinental snarl of need and resentment. Even as oil-consuming nations intervened in the affairs of oil-producing nations, they seethed at their powerlessness; oil producers exacted huge sums from oil consumers but chafed at having to submit to them. Decades of turmoil — oil shocks in 1973 and 1979, failed programs for “energy independence,” two wars in Iraq — have left unchanged this fundamental, Churchillian dynamic, a toxic mash of anger and dependence that often seems as basic to global relations as the rotation of the sun.“
Or as the DFH say: It is always and has always been about oil.
I think you and I are agreeing, but just to clarify for everyone else:
We haven’t been dependent on oil for all that long (maybe 100 years), our economy would have muddled along ok without it, and we certainly don’t need to be dependent on it going forward. We can now see that it’s expensive, dirty, and risky, and there are far better and cheaper alternatives here right now.
More on the Hamilton-Kemp-Kopits stuff. Kinda “he said, she said” (not a lot of analysis), but I basically agree with the fellow. 🙂
http://www.thenational.ae/business/energy/peak-oil-proponents-still-dancing-around-reality
The remarks about too light versus too heavy oil are amusing. Who’d a thunk it, 10 years ago? Too MUCH WTI!? [I sure as heck remember the narrative of how we would never have much WTI again!] I mean, you have to laugh, even if you are a peaker, if you just have a bit of self mockery. [Oh…and please educate the peaker commenters who try to say that Bakken is low value oil…that stuff will get a premium on the world market…it prices with LLS. It’s worth MORE than heavy sour.]
Who’d of thunk we’d add 3.5 million bpd in 4 years in the USA? If the peakers were so prescient, such neoliberal thinkers, why did they miss that? I mean if one is going to make geology/supply arguments based on depletion, should one not have a picture of amounts of resources that can be mobilized at higher (sustained) price points? (IOW, the freaking cost curve from econ 101!) Maybe even some idea of supply segment location, nature, timing, etc? This is how one would analyze a commodity chemical or steel or TiO2 or the like. [Nothing super fancy, basic business analysis.]
And yes there were cornies who predicted non-OPEC development. They may not have known about the shale…but they suspected we would get it somewhere…and some of them thought the USA would be important (because of free enterprise, expertise, and the example from the early 80s boom). In some ways, the dynamics are very similar to the 70s energy crisis. I’ve been amusing myself reading old academic papers from 75-80 [wonders of Google Scholar!] on oil prices and depletion and even “end of cheap oil”. But then we had 20 years of cheap oil…
Now, could this time be different than the 70s? Sure, sure it could. Or maybe it’s similar and maybe Yergin really has a point with the discussion of previous peak oil scares over the ages.
Hamilton-Kopits peakers should look at these old examples, try to learn from them, and retain some uncertainty. (Same in reverse for the cornies.) We have to get further than he said, she said debates to killer analyses that help push the insights further.
No, not pictures of states peaking…that’s just repeating an old meme, not doing new, relevant analysis. And it’s pretty easy to come up with pictures that make peakers look bad too: the recent Texas boom, the recent US boom. Heck, just draw the Hubbert natural gas prediction versus performance. That one looks really ugly.
I think the cornies need to take the sustained high price of oil seriously and even that the futures show it relatively high.
But then the peakers really need to look at that backwarded futures curve seriously and Hotelling theory. Remember the “oil is a controlled flow/drilling problem” paper that James linked to? Maybe that futures curve fits a narrative of an overpriced oil (cartel controlled, Arabian production withheld), that will gradually get cheaper because of the increase in drilling in the non-cartel areas (principally and most importantly, the USA.)
Oh…and I still think we have a situation with OPEC/SA very happy with 100/bbl and they would be very sad with 40/bbl. And our policies (embargoes and not doing Keystone and not drilling the coasts and anti-frackers and the like) support OPEC’s “clumsy cartel” (Adelman’s observations are enduring here). We need to think more about OPEC and how it works and when they are talking out of both sides of their mouth and if they coordinate with Russia and the like. And then how to subtly and over time crack the cartel.
Nony: No, the claim is not that light oil is not as valuable. The claim is that natural gas liquids and biofuels are not as valuable as crude oil, but the former are included in the “total oil production” figures that most people quote, and account for most of the increase since 2005.
James:
You’re good. I agree that NGL (especially ethane!) is not a good substitute for crude. Wasn’t trying to paint you into that corner (I agree the author does…but he was wrong to do so). You are 100% fine there. [By the way, there are some really nice articles about how ethane pricing tracks methane now…kinda cool from the micro commodity perspective.]
It’s more the peaker commenter types who make these comments about Bakken oil being crap. [And yeah, you’re not responsible for every commenter’s comments…just think if someone had to be responsible for mine! 😉 But, be a teacher and teach ’em a little. ;)]
That shale oil, especially from the Bakken…that’s good oil. You can make lots of transport fuel (high value product) from it. Heck even the “condensate complaining” is misplaced. [And condensate from EF is actually decreasing as a percentage FWIW.] Yeah, 50 or 55 or 60 API oil is not worth as much as 40. But it’s priced not that much different from heavy sour (world basis), can be blended into gasoline, etc. Is even regulated as crude oil for export. (it’s basically the “associated oil” from a gas well.) Condensate definitely DOES belong in a discussion of crude.