Hiro Ito, who updates our de jure financial openness index (sometimes known as the Chinn-Ito index), has recently calculated GDP-weighted averages of the indices for country categories. The stylized facts regarding the evolution of openness changes, particularly with regard to emerging market economies.
First, here are the typically reported simple average series, standardized to range between 0 and 1.
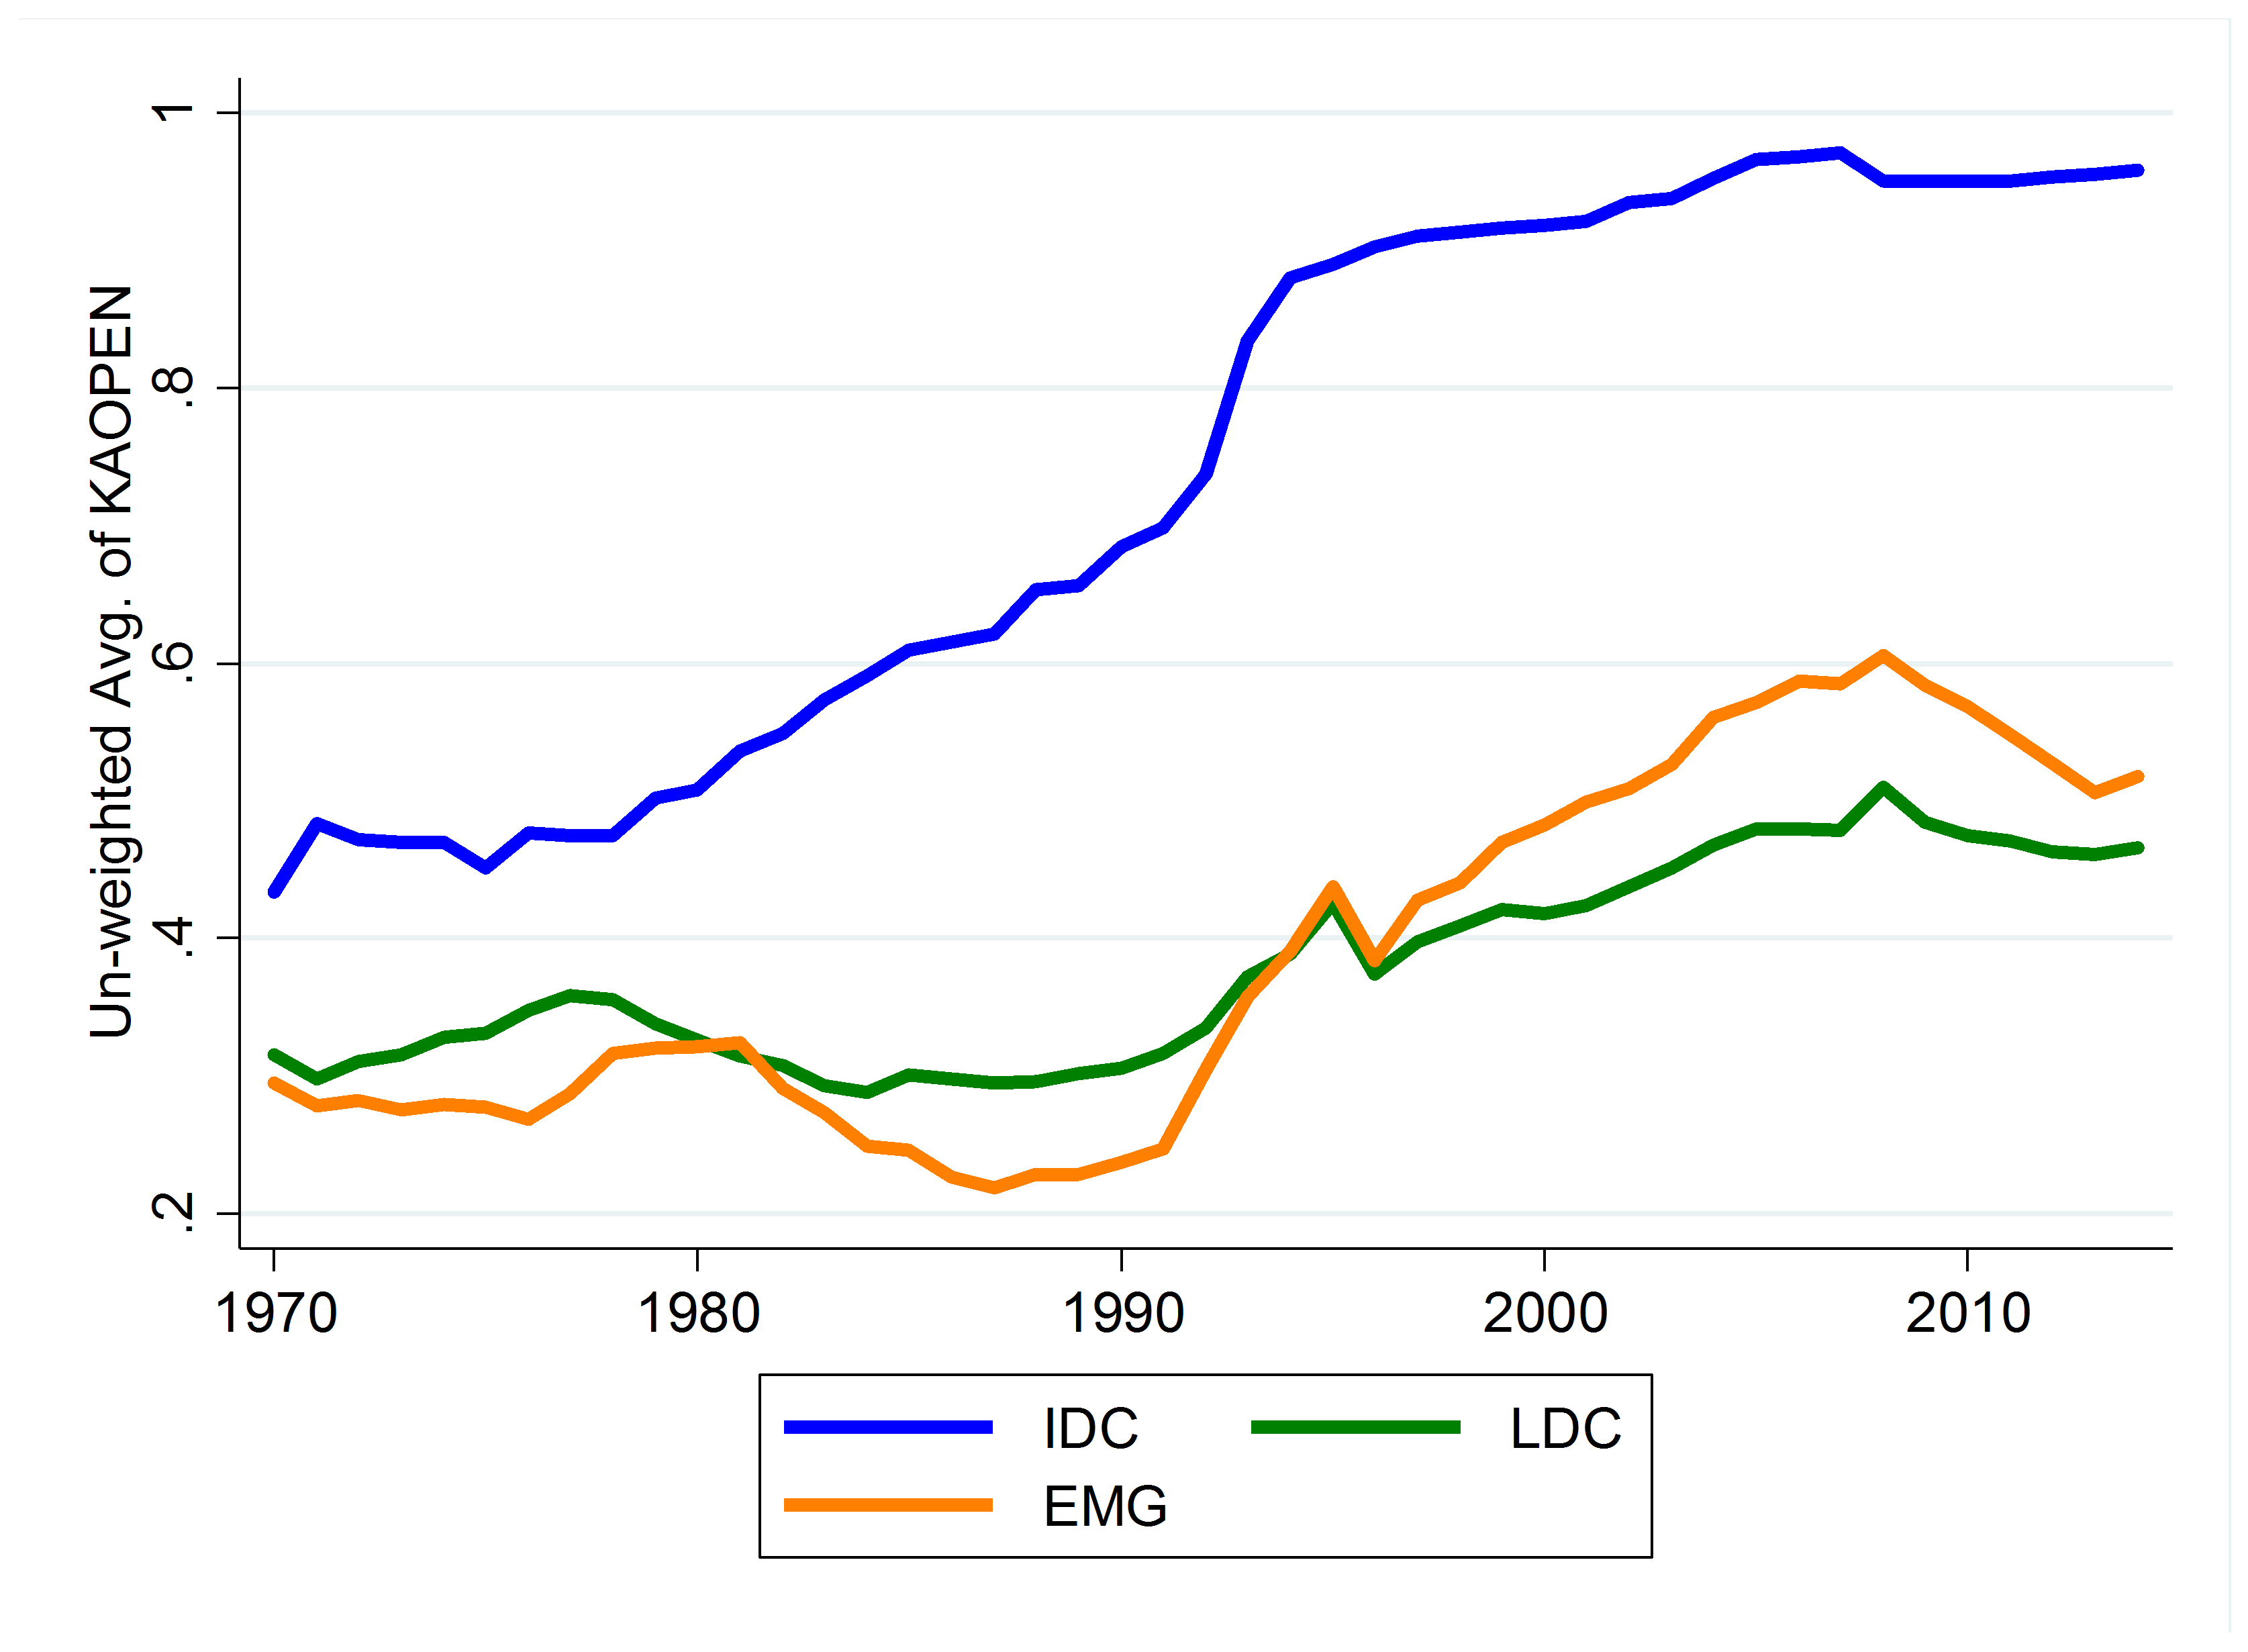
Figure 1: Unweighted Average of KAOPEN for Different Country Groups. Source: Chinn and ito, and calculations by Hiro Ito.
Next, here are the GDP weighted average series.
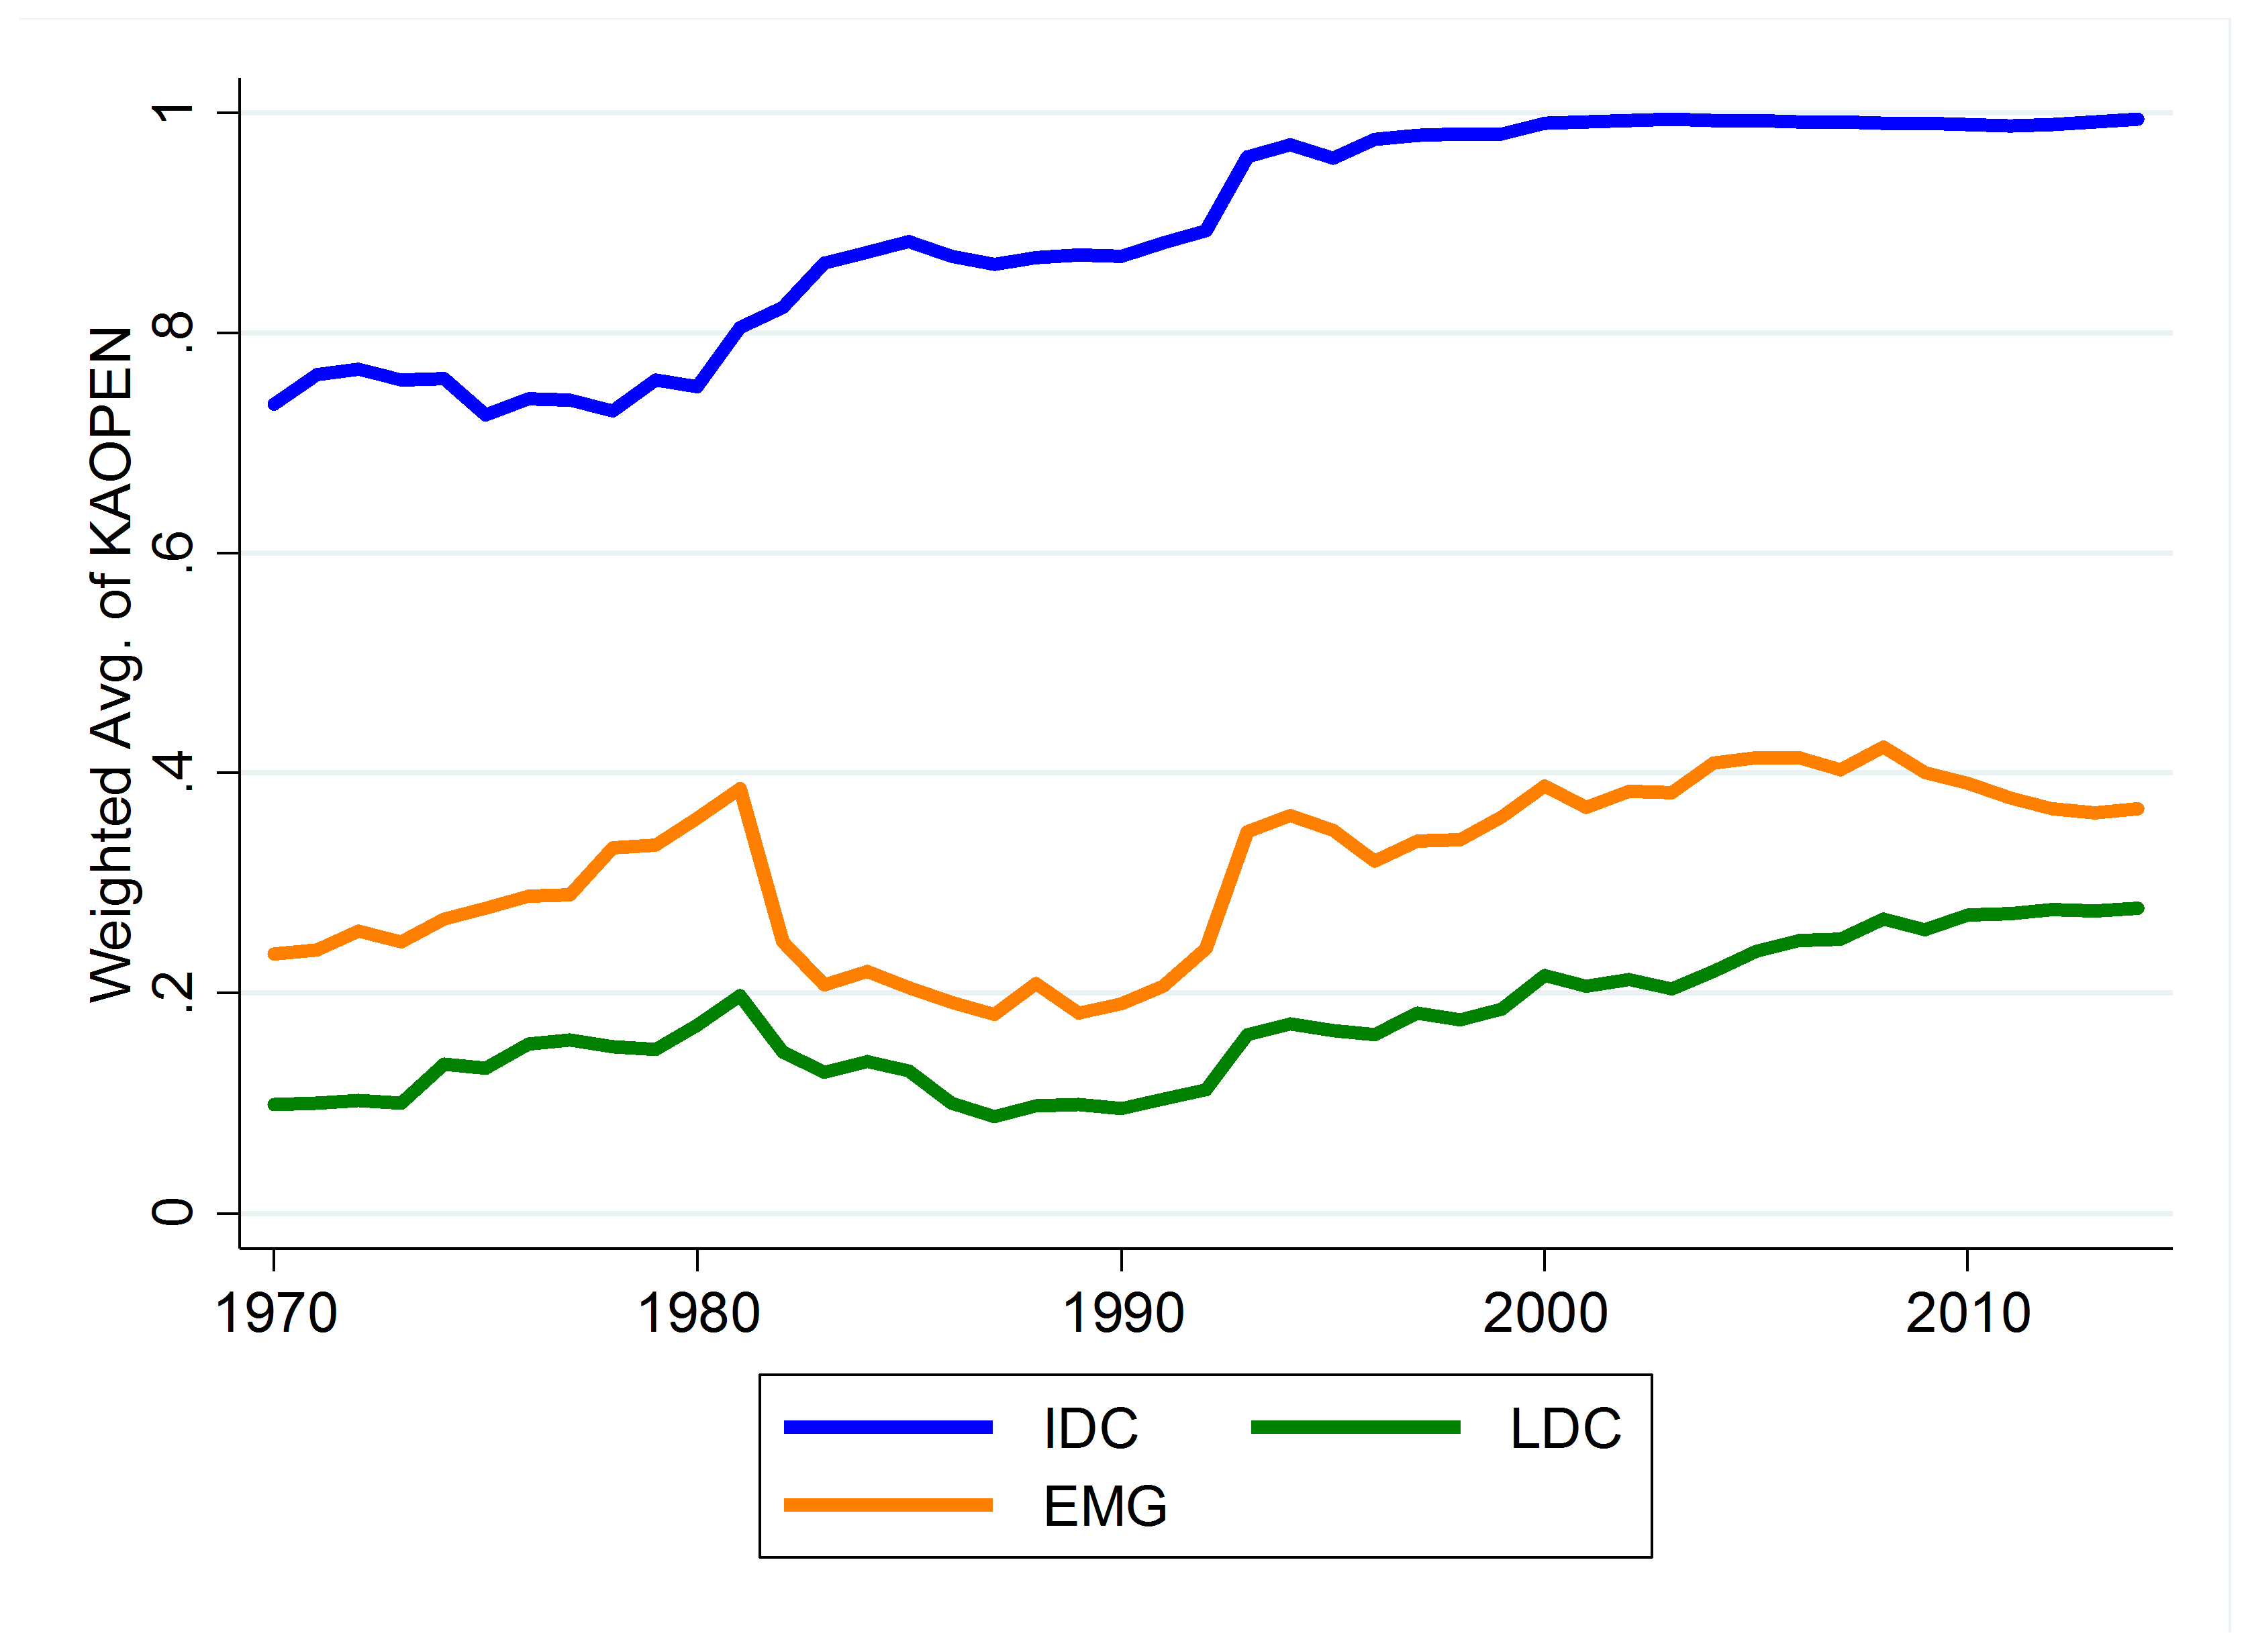
Figure 2: GDP Weighted Average of KAOPEN for Different Country Groups. Source: Chinn and ito, and calculations by Hiro Ito.
Notice that the time profile for the emerging market group is markedly different. Openness falls more dramatically after the debt crisis in the early 1980’s, and rises to a slightly lower level — 0.4 rather than something above 0.5. On the other hand, the runup and decline in the measure since 2008 is less noticeable.
Additional discussion of previous vintages of the index here and here.
It would be interesting to depict the index values by country on a map of the world.
Never mind. I see you did that in 2007 and the visual will probably be similar.