Last year’s recap was subtitled “Triumph of the Blowhards”. So far, my plea for the return of rational policy analysis (let alone facts) has failed to occur. But the struggle for sanity must continue.
Monthly Archives: December 2017
Quartets: Music by Laura Schwendinger
That’s a new CD of my wife Laura‘s music, just released by Albany Records.

Acres Burned, through 29 December
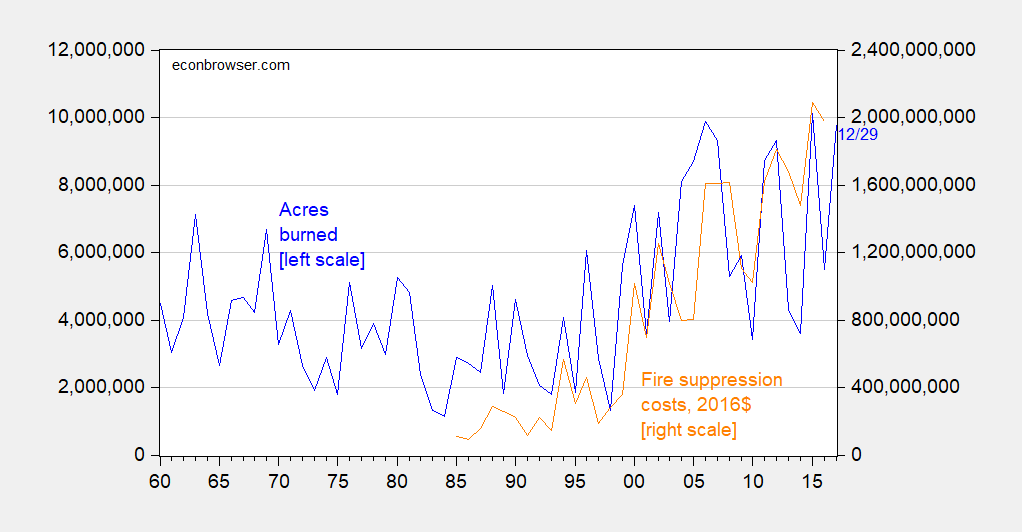
Figure 1: Acres burned (blue, left scale) and total Federal firefighting expenditure in 2016 dollars (orange, right scale). 2017 observation is for acres burned through 29 December. Source: NIFC1, NFIC2, and author’s calculations.
But remember: “Global warming is a total, and very expensive, hoax!”!!!
Wisconsin in Recession?
I doubt it, but it’s more likely than an ongoing recession in California. Wisconsin year-on-year GDP growth lags, personal income and wages/salaries growth are both bouncing around zero.
California in Recession?
That’s what Ironman asks at Political Calculations, and he answers his question thusly:
Going by these [household survey based labor market] measures, it would appear that recession has arrived in California, which is partially borne out by state level GDP data from the U.S. Bureau of Economic Analysis.
Beware the State Level Household Employment Series: California Edition
Some analysts continue to infer short term trends solely based on household labor market series compiled at the state level. Here are two pictures showing why focusing on the household over establishment could be misguided.
Here are various vintages of the November release for California household/civilian employment series.
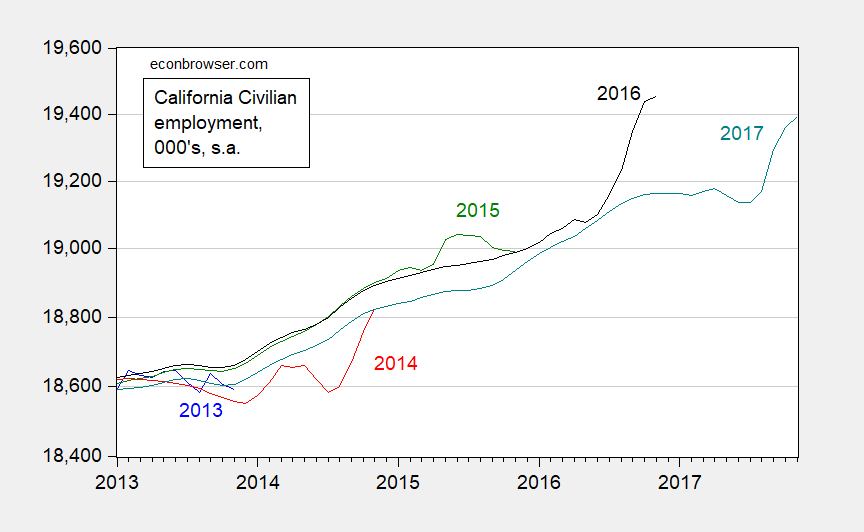
Figure 1: Civilian employment from household survey in California, from November 2013 release (blue), November 2014 release (red), November 2015 release (green), November 2016 (black), and November 2017 (teal), all seasonally adjusted. Source: BLS via ALFRED and FRED.
Wisconsin Macro Aggregates Stall
Wisconsin real personal income in Q3 is less than it was a 2015Q4, and since 2011Q1, cumulative nominal income is 5% lower than that in Minnesota (and the US). Wisconsin GDP growth through Q2 lags Minnesota and US.

Figure 1: Wisconsin GDP (blue) and personal income deflated by US PCE (red) in mn. Ch.2009$, SAAR, both on log scale. NBER defined recession dates shaded gray. Source: BEA, and author’s calculations.
Pr(Mueller Replaced by 6/30) from Prediction Markets
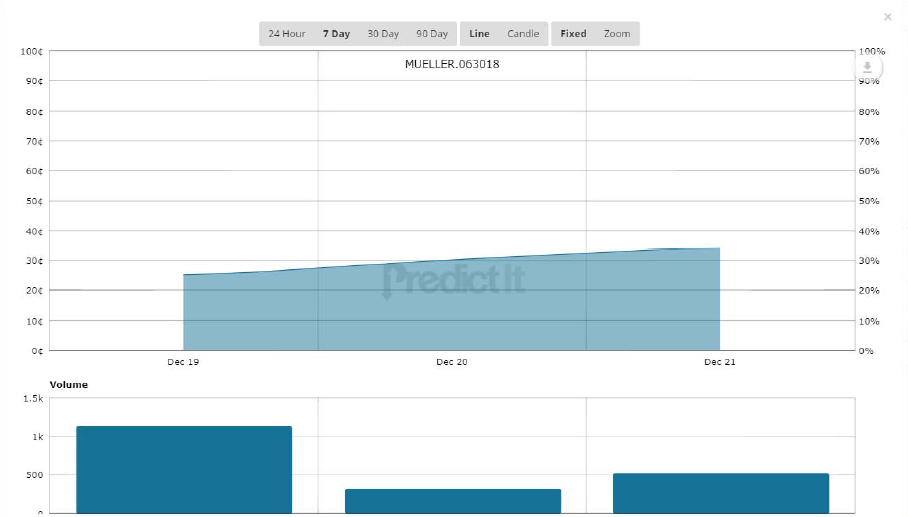
Source: PredictIt accessed 12/21.
Closing price 34 cents. I assume this means that there is 1/3 chance that President Trump will fire Mueller within the next 6 months. Not surprising given the President’s rabid attacks on the FBI.
Imagine…107% Publicly Held Debt to GDP Ratio
(Some) defenders of the Tax Cuts and Jobs Act as passed argue that tax cuts for households will be extended, rather than disappearing by 2027. What does that mean for debt?
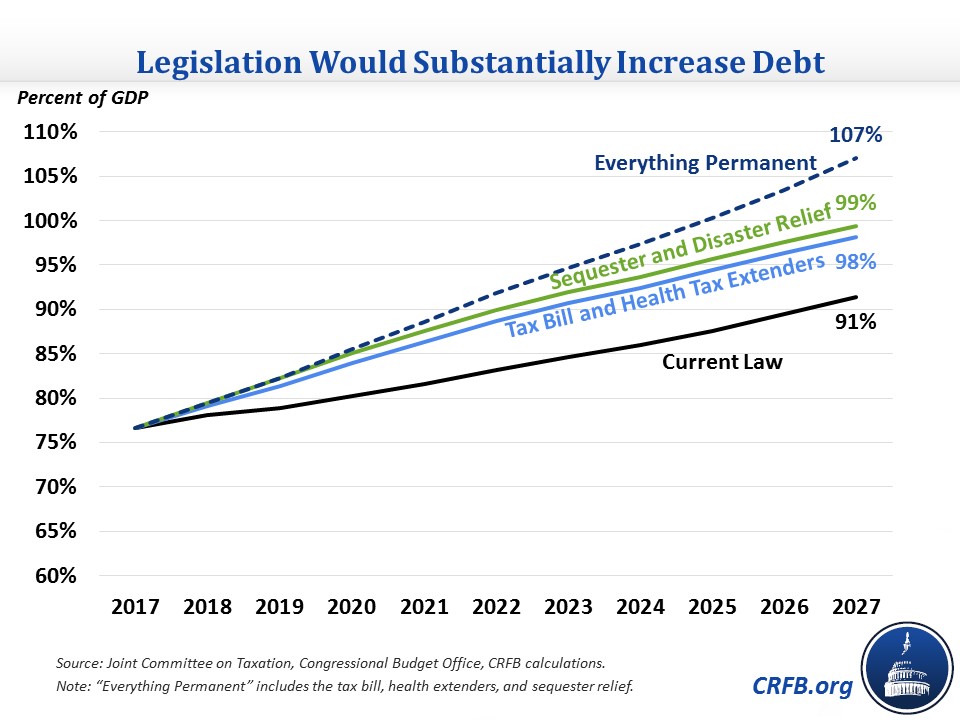
Source: CRFB. Note: Differs from gross debt by netting out intra-Federal government holdings.
CRFB estimates FY2019 deficits will be $1.1 trillion.
Fortunately, the President has stated he will not sign a tax bill that he believes will increase the budget deficit.
Best Schematic Ever: Financial Frictions in Macro/Finance
I tire of hearing people who had one (or no) class in economics saying “the magic of the marketplace” will lead to the optimal outcome. What teaching finance has made me realize is that information problems are rife in many economic interactions. And one can’t be a student of currency crises without being even more convinced. The paper by Stijn Claessens and Ayhan Kose, “Macroeconomic Implications of Financial Frictions: A Survey” is a must-read for those who want to keep up with the literature. It has this fantastic schematic: