Reader PeakTrader says the fortunes of Minnesota and Wisconsin “began to diverge decade before Walker”. I don’t buy it.
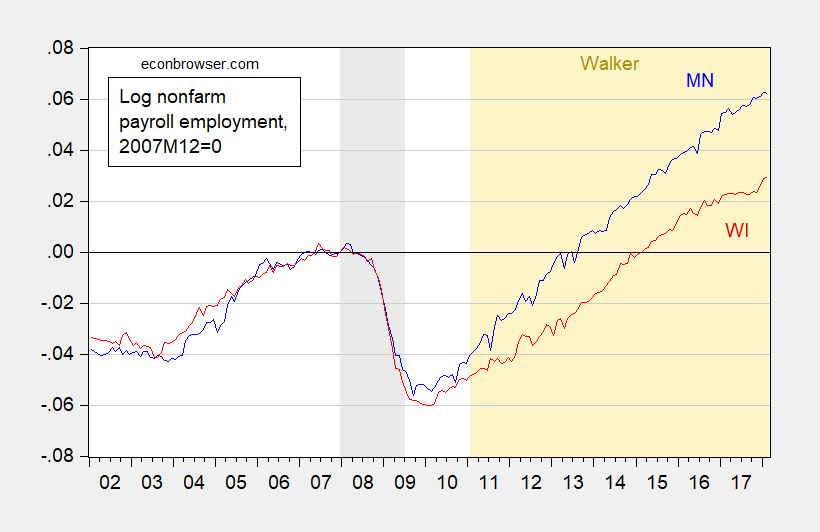
Figure 1: Log nonfarm payroll employment in Minnesota (blue), in Wisconsin (red). NBER defined recession dates shaded gray. Orange denotes Walker administration. Source: BLS, and author’s calculations.
The graph shows that in the years before the great recession, the two economies tracked fairly well, and the divergence was widened significantly during the Walker years. One might reasonably ask does a analogous graph using GDP present a different picture. My answer is no.
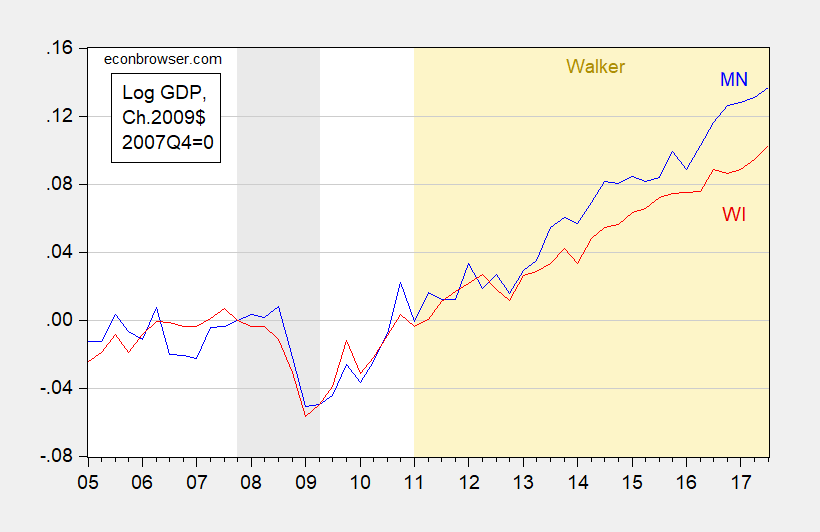
Figure 2: Log GDP in Minnesota (blue), in Wisconsin (red), in mn Ch.2009$ SAAR. NBER defined recession dates shaded gray. Orange denotes Walker administration. Source: BEA, and author’s calculations.
I find useful to consult data before making statements. But that’s just me.
Hold on!!!! Menzie, 2slugs and pgl all said it was too hard to calculate state level GDP. I find useful to question and ignore comments by those desperate to make a counter-point, they are so often found to be (…).
CoRev: I think 2slugbaits and pgl said it was too hard to calculate potential GDP. You really should read carefully what they are writing. BEA has been reporting on state level GDP for decades. I agree with them completely that no organization estimates potential at the state level in a fashion analogous to what CBO, OECD, Fed does for the nation.
Oh, that’s right. My bad! It was potential SGP. Which clearly is harder to guesstimate (with error bars) what we think it should/could/might be in a few months to years compared to what we estimate it actually might be today.
But you see my passion is Global Warming/Climate Change estimates which deal in future decades using some poorly measured and some not measured data and many unclear forcings and feedbacks all constrained by incomplete physical science. And, fearlessly, that science can project estimates for what they think it should/could/might be in that next generation’s life time.
CoRev: I have no idea what you are trying to get at.
Menzie, of course you don’t. Why would anyone try to add precision to a gross estimate of state potential GDP claiming it’s too difficult to come up with that gross estimate?
CoRev: I still don’t understand. Nothing stops you from trying to estimate state level potential GDP. All I’m saying is it’s not done by the usual organizations. One issue is that factors of production are freely mobile across state borders, unlike the case for nations, so the concept of potential is more difficult to conceptualize.
Menzie, “One issue is that factors of production are freely mobile across state borders, ..” and we know this how? And no one estimates these? Yet you were and are issuing article after article comparing states’ performances and individual state’s performance without knowing what it could/should/might have been because its “not done by the usual organizations.”
Where’s RTD to point out the irony and hypocrisy of that position while continuing to rain complaining articles?
But he sure likes bolding random words.
CoRev “One issue is that factors of production are freely mobile across state borders, ..” and we know this how?
Here’s a thought exercise. Suppose you want to estimate potential GSP for Missouri. You look at a map and notice that the two largest economic zones (St. Louis and Kansas City) share a border with other states. How much of the labor and capital used to produce output in St. Louis comes from the Illinois side of the river? How much of the labor and capital inputs used to produce output in KC comes from the Kansas side of the Kansas River? There’s no way to tell. And that means you cannot estimate potential GSP for Missouri because you cannot identify all of the factor inputs that are fixed in Missouri.
Reading your comments it sounds to me like you are looking for some kind time series approach to measure potential GSP. Maybe. But that’s not how CBO and the Fed estimate potential GDP at the national level. The Fed tends to focus on various measures of capacity utilization rates and checks to see how far above or below the economy is running from “normal” (i.e., no overtime, scheduled capital maintenance, etc.) to estimate potential GDP at the national level. I am not aware of any data along those lines at the state level. The CBO uses a production function approach; e.g., f(K,L,E,M,S). The usual approach is to assume constant returns to scale, so doubling inputs will double output. But that’s just a useful assumption that makes the analysis a lot cleaner. It also turns out that it’s a good approximation at the national level because the economy is large enough that increasing returns and decreasing returns sectors tend to cancel out. But you really can’t make that assumption with a small economy such as Rhode Island. And you’re also stuck with that problem of mobile inputs that freely cross state borders.
If you want to abandon your love affair with climate change and turn your talents to finding a way to estimate potential GSP, by all means be my guest. Good luck to you. If you succeed I’m sure Menzie will recommend you for a Nobel.
CoRev says: “Where’s RTD to point out the irony and hypocrisy of that position while continuing to rain complaining articles?”
I always suspected “rtd” had some groupies. Let’s just hope the cubs and tops don’t give away their virginity too fast. These things should take their due course. CoRev, please take things slowly on this.
2 slugs states: “… labor and capital from (outside the state studied)…There’s no way to tell. And that means you cannot estimate potential GSP for Missouri because you cannot identify all of the factor inputs that are fixed in Missouri. ”
And yet BEA calculates state GDP for each US state at least quarterly, So BEA can tell/measure/estimate the past values to estimate state GDP.
Saying with all things being equal what makes it so difficult to do a historical trend analysis to estimate future state GDP? Then adjusting those trends with the changes to the (just for MikeV) important factors (all thing not being equal) driving state GDP estimate the ranges for POTENTIAL state GDP with error/range bars. It is an estimate after all.
2slugs is absolutely correct in that I am looking at a time series approach to estimating potential GDP. What amazed me from the original thread was it just wasn’t done by economists, although they ask often questions comparing state level performances (When Did Minnesota and Wisconsin Fortunes Diverge?) without considering the expectations for the states. For a non-economist that identifies a yuge potential weakness in the science, and may explain why so many economic estimates are so seldom correct, especially at the (state and component) lower levels.
Many of these estimates are relatively short term, quarterly to a few years, so that changing the individual factors (of the all factors being equal) will have a lesser effect on the estimate’s range (error bars) than for a longer to much longer period.
Yes, I think this is a major failing of economics.
corev wrote:
Yes, I think this is a major failing of economics.
Which failure is “this” failure? The failure of economics to be physics, or the failure of the field to produce the various studies and data series that corev wants it to produce?
corev wrote:
“it just wasn’t done by economists, although they ask often questions comparing state level performances (When Did Minnesota and Wisconsin Fortunes Diverge?) without considering the expectations for the states”
Why look at expectations when the question was fortunes? If a state had better than expected economic growth, but it still fell behind, it fell behind. If it underperformed expectations, but outperformed other states, it pulled ahead.
This multiyear thread on the WI economy relative to the US and to neighboring states has its roots in Walker’s assurances that his policies would boost economic growth and produce a certain target of new jobs by a certain date. Walker did not mention performance versus expected potential. It seems exceedingly unlikely that voters had the understanding that Walker’s promises carried a disclaimer that “actual results should be evaluated against expected potential results.”
corev wrote:
Yes, I think this is a major failing of economics.
Which failure is “this” failure? The failure of economics to be physics, or the failure of the field to produce the various studies and data series that corev wants it to produce?
corev wrote:
“it just wasn’t done by economists, although they ask often questions comparing state level performances (When Did Minnesota and Wisconsin Fortunes Diverge?) without considering the expectations for the states”
Why look at expectations when the question was fortunes? If a state had better than expected economic growth, but it still fell behind, it fell behind. If it underperformed expectations, but outperformed other states, it pulled ahead.
This multiyear thread on the WI economy relative to the US and to neighboring states has its roots in Walker’s assurances that his policies would boost economic growth and produce a certain target of new jobs by a certain date. Walker did not mention performance versus expected potential. It seems exceedingly unlikely that voters had the understanding that Walker’s promises carried a disclaimer that “actual results should be evaluated against expected potential results.”
“Reading your comments it sounds to me like you are looking for some kind time series approach to measure potential GSP.”
actually 2slugs, corev is not looking for that at all. he is a grumpy old man affiliated with the party of no. simply a complainer on any and all topics. he has a laymen’s understanding of science and math, and is simply too stupid to understand his own limitations on the subjects. hence he “complains” constantly about items that he cannot articulate in any coherent manner. just complains. the party of no. if you notice, he constantly complains about how others have not done their work properly. yet he has never even tried to do any of the real work. just complains about others work. every business has such a complainer-and most employees count the days until that bitter old man retires.
“pgl all said it was too hard to calculate state level GDP.” I never said that at all. I was referring to estimating potential GSP. Either you are lying or you really need to learn how to read.
Every economic recovery is different. Minnesota may have had faster population growth and faster growing industries, including healthcare, while Wisconsin had slower population growth and its industries became more productive, including manufacturing. We know the Twin Cities population grew much more rapidly than Milwaukee.
“Minnesota may have had faster population growth”. May have? Do just make this stuff up on the fly or what? BTW -if Wisconsin has more productive industries – why is its income per capita lower? Or did you read your own link? It does not appear that way.
Compare population growth rates and learn something.
Also, per capita income can fall, while productivity increases substantially.
The Twin Cities had much faster population growth than Milwaukee. There may be a brain drain, since Wisconsin has an older population than Minnesota, as younger people move to metro areas that are more diversified with more opportunities in newer and faster growing industries than Milwaukee.
A top student in Wisconsin may find better opportunities in another metro area than Milwaukee.
Learn what? That PeakIgnorance is hopelessly lost. Dude – we all know that. C’mon man.
“per capita income can fall, while productivity increases substantially.”
It could only if some foreign owners of capital reaped all of the productivity growth. Oh wait – that may be the result of the Trump tax cuts as Paul Krugman reminded us. This is basic economics Peaky so I’m sure you get it since you were such an incredible student of the neoclassical growth model.
Pgl, all you do is waste people’s time with your nonsense.
For example, a worker can earn a higher hourly wage and work fewer hours per week resulting in lower income and capture productivity gains.
Take an econ class.
Minnesota is a good random comparator to Wisconsin. This chart from Pew Trusts shows the 50 states Employment Rate for Prime-Age Workers by State, 2017
http://www.pewtrusts.org/en/multimedia/data-visualizations/2014/fiscal-50#ind3 (latest rates) Minnesota, indeed outperforms Wisconsin, which only outperforms 48 other states.
When comparing Percentage-Point Change in Employment Rate, 2007 to 2017 (select the “Change since 2007” tab), Michigan outperforms both Minnesota and Wisconsin, but I happen to know that Michigan was the among the first states to see a significant downward trend before the official recession so that might be a bit wonky. Minnesota comes in 3rd best significantly overshadowing Wisconsin which came in far behind at 4th.
+1.
By some standards, the Patriots also had a bad year last year. (By the standards of Patriots fans. And for the record, Eagles fans really are jerks.)
In any event, by the standards of 30 other teams, the Patriots had a quite good season.
So with Wisconsin.
“Wisconsin and Minnesota also traded places in per-capita income, an important measure of material standard of living. Professor Louis Johnston of St. John’s University compared per-capita incomes in the two states since the end of World War II. His findings show a crossover in the late 1960s, when Minnesota surpassed Wisconsin. This trend has persisted. It is fair to say that Minnesota is now an upper-income state, while Wisconsin is below average.”
This is the key paragraph from Peaky’s little article. OK – not only does Minnesota have a higher level of income per capita but it also has enjoyed faster employment growth since 2011 at the same time. Wow – this defense of Gov. Walker by Peaky just fell on its face.
pgl,
There is no doubt that per-capita income has improved in Minnesota. Now, the rest of the story: http://www.startribune.com/why-economic-recovery-in-greater-minnesota-is-actually-better-than-in-twin-cities/433899443/
“Income growth was particularly strong in western Minnesota since 2009, likely connected to what’s going on in North Dakota. Fargo in particular has seen population and economic growth in recent years, Liuzzi said, which may have partially affected some Minnesota counties.
And since income is a metric closely tied to other economic indicators, it’s not surprising that unemployment rates often dropped significantly from 2009 to 2015 in some outstate counties, while available jobs increased.”
Check out the interactive map: Personal income growth by county
Isn’t it great what shale oil and gas can do for an economy… even if it’s not shale oil and gas in your state?
Also, Wisconsin is part of the Rust Belt, unlike Minnesota.
The Fracking Miracle? Of course fracking suffered when oil prices collapsed. And yet their employment still kept outpacing that of Wisconsin.
pgl . Yes, there was a brief “crash” due to OPEC’s antics, but that’s in the past for the foreseeable future.
“Wisconsin, Minnesota and Michigan are also listed among the country’s “top 10 non-producing states” in terms of job creation linked to fracking. Ohio and North Dakota are among the top 10 “producing” states for job creation, with 38,830 and 71,824 jobs already created by fracking, respectively, according to the study. Texas tops the list with more than half a million jobs already created.”
https://www.globalenergyinstitute.org/us-chamber%E2%80%99s-fracking-job-boom-behind-numbers
https://www.bloomberg.com/news/articles/2018-01-09/shale-producers-do-their-bit-to-make-jobs-market-tighter
https://www.indeed.com/q-Oil-Field-l-Minneapolis,-MN-jobs.html
OPEC’s antics? Try all that natural gas exploration in places like Australia, Norway, and even the US. Dude – there are several sources of energy coming from several parts of the world. OPEC is overrated.
pgl, No, not OPEC alone, but they were a significant factor in the oil price decline in 2014.
“Saudi Arabia’s actions also contributed to falling 2014 oil prices. Faced with a decision between letting prices continue to drop or ceding market share by cutting production in an effort to send prices upward again, the Middle Eastern country kept its production stable, deciding that low oil prices offered more of a long-term benefit than giving up market share. Because Saudi Arabia produces oil so cheaply and holds the largest oil reserves in the world, it can withstand low oil prices for a long time without any threat to its economy. In contrast, extraction methods such as fracking are more expensive and therefore not profitable if oil prices fall too low. By supporting low oil prices, Saudi Arabia hopes that countries such as the U.S. and Canada will be forced to abandon their more costly production methods due to lack of profitability.”
Why did oil prices drop so much in 2014? | Investopedia https://www.investopedia.com/ask/answers/030315/why-did-oil-prices-drop-so-much-2014.asp#ixzz5BI5WzGzc
@ Bruce Hall
Bruce, Shhhhh!!!! Hush!!!! Be silent!!! If you keep reading substantive newspaper links instead of watching Trump sycophants like Hannity, your IQ might break above 71, and none of us “dirty liberals” want that. We like you angry at dark-skinned Presidents and mentally vacant, as we’re so used to it, it feels comfortable now. I know you and all your Trump stooge pals are big fans of fracking and coal. But you guys might feel really dumb if you grasped the reality of the situation. And no one here at Econbrowser wants you to feel dumb, or wants you to feel like you and the Trump stooges are some kind of archaic cavemen on the intellectual front. So make sure none of your friends read this link, ok?? It’s also a from a newspaper. Please keep watching Hannity. He’s going to make you feel so smart!!!!
Remember, when talking to West Virginians, you must always say “Coal is coming back!!! Sometime very soon. It will be YUUUUUUGE, believe me!!!!!” Because if you don’t they might think Trump and Trump stooges, like you, are dumb or maybe just lying to them for the last 2 plus years.
“Meanwhile, the cost of wind energy in Minnesota — even without tax subsidies — now appears lower than electricity produced from both natural gas and coal.”
http://www.startribune.com/renewable-energy-now-produces-25-percent-of-electricity-in-minnesota/475552393/
Remember Bruce, SILENCE!!!! We like you and the Trump stooges’ led around by the nose. It’s fun to watch!!!
Moses… and Wisconsin has cheese. So what? You have so many oblique thoughts that it’s hard for you to stay on point.
And then your state leads in windbags (which is great for generating electricity, but not so good for CO2).
btw… https://www.bloomberg.com/news/articles/2018-03-28/shale-patch-making-money-hiring-and-ready-to-drill-for-more
https://www.forbes.com/sites/woodmackenzie/2018/03/05/tight-oil-set-to-make-money-in-2018/#f9441c048dea
However, you really didn’t respond to my previous comment did you? Well, you did… about the same way my 6-year old granddaughter would when she didn’t have a comeback.
Bruce Hall
I am fully aware that for someone who only knows how to repeat Trump/Republican talking points, having a broad view on life would seem like “oblique thoughts” to you. What you call “oblique thoughts” others of us call being well read, not having a “one shoe fits all” view on life, and not being spoonfed. You are like the well trained doggy Rush Limbaugh, who repeats verbatim what was sent to him by email/fax from Republican Senate staffers.
Your former “comment” took roughly a half sentence out of a very large newspaper article, for you to cheerlead for fracking. Other than pointing out how brainwashed you are, there was nothing to “respond to” other than stating my utter shock that you would ever read a well-respected newspaper.
As for your 6-year old granddaughter, if your daughter/son or in-laws have taught her how to read better than her grandfather can, I’m very happy to hear the great news, though not altogether shocked on that score.
The cost (both economic for a particular company) and external costs to society of producing any particular form of energy resource is the most important factor in any of this. I know a man like you has never heard of negative externalities, as it’s never mentioned on Hannity, FOX, or Alex Jones. Ask your granddaughter to read this for you, just say “Slooooooowly for grandpa”.
http://www.economicsonline.co.uk/Market_failures/Externalities.html
Moses, I presume you wanted me to cut and paste the whole article for your ease?
Some people believe shale energy has too many negative externalities and then go on to talk about possible connection to small earthquakes and potential groundwater contamination. Other people express similar concerns about wind turbines that have been linked to human health problems, local climate disruption, massive bird kills, etc. Other people have expressed similar concerns about the life cycle pollution of solar cells.
In a perfect world… oh wait, we don’t live in a perfect world. Nevermind. If someone points out the positive aspects of something, that’s “cheerleading”. If someone points out the negative aspects, that’s purely rational. Okay, I’m being purely rational about your beloved wind turbines. But I’m not necessarily agreeing that, “The cost (both economic for a particular company) and external costs to society of producing any particular form of energy resource is the most important factor in any of this.” The most important factor is the widespread availability of a better alternative… better as in more reliable, cheaper, available, cleaner. I do look forward to free, cold fusion.
But keep the ad hominem fallacies coming. smh
“then go on to talk about possible connection to small earthquakes and potential groundwater contamination.”
actually, the connection to small earthquakes does exist. and you can eliminate the “potential” in groundwater contamination, that also does exist. can you propose any more falsettos?
Minnesota is a state of terrific people, a state to be admired as is Wisconsin. I wish only the best for both and find it a shame that there are those who root for worse do to ideological politics. It is unfortunate that Minnesota is now plateauing at level worse than it should. It is the higher tax rates enacted along with the higher spending with which was used to accelerate growth but now that stimulate must be paid back. The Wisconsin method of tax cut, deregulation, lower spending, and giving back to local district power of negotiation with public unions may have had a slower pace of growth but will last much longer and get better results. It is already showing in the unemployment rate. I understand the desire of the quick fix, but there is a price.
Ed
C’mon man. Menzie lives and teaches in Wisconsin. He wishes well for his state. But of course he has every right to criticize bad policy choices by its current governor. If you are defending the Walker agenda, you are the one who roots for the worse based on your politics.
When looking at U3 unemployment rates, it’s important to recognize that there three major components of U3 unemployment. The first component is cyclical; i.e., unemployment due simply to a downturn in the economy. That kind of unemployment tends to be a national or even global phenomenon and there isn’t a lot that state governments can do about it. Cyclical unemployment is primarily a national problem. The second kind of unemployment is structural, and here states have a lot of impact. For example, the minimum wage, unemployment compensation rules, availability of training, educational opportunities, skills mismatch, etc. Structural unemployment is generally a bad thing. The third kind of unemployment is frictional, and that is not at all bad. Frictional unemployment is what we get when workers feel confident about either entering the workforce or quitting an existing job in the expectation of getting a better job. So why is this distinction important? Because if it turns out that a higher U3 unemployment rate that is due to a higher rate of frictional unemployment is entirely consistent with Minnesota having a higher GSP than Wisconsin, higher wage growth than Wisconsin, and higher non-farm payroll employment than Wisconsin. The lesson here is that you can’t just look at a state’s unemployment rate and conclude that lower is always better. Frictional unemployment is evidence of a dynamic and growing economy. One problem with ALEC states (Kansas, Iowa and Wisconsin) is that a large part of the workforce is employed, but employed in low wage, dead end jobs with little hope of finding a better job. Is it any wonder that those states are seeing stagnant or falling populations?
Slug
Your analysis is usually much better than that.
Ed
Ed Hanson What part of my analysis isn’t up to snuff? Please enlighten me. Decomposing the U3 unemployment rate into cyclical, structural and frictional unemployment is pretty standard stuff. Seeing frictional unemployment as a positive indicator of economic vitality is also pretty standard stuff.
PeakIgnorance is lecturing us to follow his lead in world class economic analysis! Snicker.
2slugbaits, I guess, you missed Krugman’s paper. People go to San Jose or San Francisco for a high tech job, not Fresno or Barstow.
And, they often start a high tech business in the area where there are other high tech businesses.
And, there are lots of what you call “dead end jobs” in the big cities too.
PeakTrader What does your comment have to do with my comment about frictional unemployment???
“2slugbaits, I guess, you missed Krugman’s paper.”
Link to which paper please. He has written a lot of papers that you clearly have missed.
WARNING: Off-topic of blogpost:
I believe Menzie has discussed the Philips Curve on this site before, and how it doesn’t appear to be as strong empirically as it once did. I found this link over on “Alphaville” blog and thought Menzie himself along with the readers might take an interest. The author is a Uni Prof in south USA. This guy posts rarely so I figure when he does he has something to say:
https://everydayecon.wordpress.com/2018/03/28/the-phillips-curve-and-identification-problems/
Wind energy cost and goals, a Hitchhiker might meet someone who’s answer is “tricky.”
Is it proper to say googled when you binged? Never mind but those who care may want to read this. Nice that it is fairly recent.
https://2lffqo2moysixpyb349z0bj6-wpengine.netdna-ssl.com/wp-content/uploads/2017/10/MN-Energy-10.2017-Final.pdf
Ed
Interesting article Ed Hanson.
I noted one point with a chuckle:
Despite its cheerleading for Minnesota’s energy
policy, the MEAP concludes: “If Minnesota continues
on its current trajectory, the state will fall short of its
greenhouse gas reduction goals and overall renewable
energy goals.”7
Th is conclusion is correct, but MEAP
off ers little analysis or understanding as to why this
is the case. If reducing greenhouse gas emissions is
now the primary goal of Minnesota’s energy policy, a
closer look at the actual performance will show that it
is failing badly, and at an unreasonable cost.
Why the chuckle? From Moses’ earlier comment:
Your former “comment” took roughly a half sentence out of a very large newspaper article, for you to cheerlead for fracking.
My response to Moses was:
In a perfect world… oh wait, we don’t live in a perfect world. Nevermind. If someone points out the positive aspects of something, that’s “cheerleading”. If someone points out the negative aspects, that’s purely rational.
One has to expect Moses’ ad hominem attacks on you and the article along the lines of “Trump sycophants” or “Trump stooges” or “your IQ might break above 71”.
Regardless, the article did a credible job looking at the significantly increased direct cost of electricity in Minnesota and pointing out that the lessening of external negatives (i.e., CO2) was minimal. Now, if Moses was rational or the least interested in a rational exchange, he might attempt to dispute this article with contradictory data. Don’t expect that. Ad hominem fallacies are so much more “effective” in a discussion.
But perhaps the increasing cost of electricity is a factor of Minnesota’s increasing GDP… temporarily.
@ Bruce Hall
Aaaaawwww, Brucie, honeybaby, little BrooshyWooshie, Did you want Mommy to kiss your booboo, to make it feel better?? And here all this time I thought liberals were the “snowflakes”. You’re like Scott Pruitt who can’t fly on a commercial airplane in the coach section because a couple people told him “You got the cooties!!” It’s a tough world out there. Someone might give you the finger at an intersection, so be careful. Here’s a site I recommend for you Bruce, and Scott Pruitt, that’s appropriate for the maturity of people who can “dish it out” but cannot take it.
https://www.stopbullying.gov/kids/what-you-can-do/index.html
m, thanks for the verification. It’s always a pleasure when someone like you just can’t help themself.
I read through the paper it it was obviously biased. Then I looked it up. Yup, the “think tank” that produced it is biased:
“The Center of the American Experiment (CAE) is a right-wing pressure group based in Minnesota.”
https://www.sourcewatch.org/index.php/Center_of_the_American_Experiment
The paper focuses on the short term costs and ignores the long term savings from the up-front costs.
BTW, did anyone else notice when the divergence started? What Obama, not state level, factor drove this divergence? just wondering because pointing fingers seems to be the goal of this blog author.
CoRev And yet BEA calculates state GDP for each US state at least quarterly, So BEA can tell/measure/estimate the past values to estimate state GDP.
Estimating actual GSP at the state level is not easy…that’s one reason why it takes BEA a lot longer to publish state level GSP data than national GDP data. That point aside, the methodology for estimating actual GDP and GSP is very different from the way potential GDP is estimated. Actual GDP sums up value added streams based on a mountain of reporting data. And even at that the BEA makes three revisions before going final. That same kind of data is available at the state level, so it is much easier (although still not easy) to estimate GSP. Estimating potential GDP is a different kettle of fish entirely. As I mentioned before, the Fed looks at capacity utilization rates and the CBO uses a production function approach. Note that they do not use capacity utilization and production function approaches to estimate actual GDP and GSP.
Saying with all things being equal what makes it so difficult to do a historical trend analysis to estimate future state GDP?
Estimating the future state of GDP is not the same as estimating potential GDP. You can certainly use time series techniques to predict future GDP, just be mindful of Nelson-Plosser unit roots and questions about whether or not GDP follows a stochastic trend or a deterministic trend. And even after all that you shouldn’t expect too much precision in your point estimates. Now as to potential GDP, you need to ask yourself why we are interested in knowing that value; and it’s not because we want to use potential GDP to predict future GDP. The reason economists worry about potential GDP is because they want to know the current period deviation of actual from potential. It’s that deviation that informs future monetary and fiscal policies. So I think you’re conflating a prediction of future GDP with an estimate of current period potential GDP. They are different creatures and have very different purposes. Note also that potential GDP at the state level probably isn’t all that useful a concept because potential GDP is used to inform national fiscal and monetary policy. Also, even if the BEA did estimate potential GSP at the state level, it would not have much practical use because of the very long lag time that it would take to get that estimate. It takes a long time just to get actual GSP. It would take even longer to get state level potential GSP. And by then the rationale for wanting to use potential GSP would be long past.
Finally, questions about the differences between one state’s economic performance versus another state’s typically focus on structural factors rather than cyclical factors. And by structural I mean things like minimum wage laws, unemployment insurance, infrastructure, taxes, spending priorities, education levels, etc. Those are microeconomic topics and the usual tool would be panel data models rather than pure time series models. Of course, lots of times Menzie will insert fixed effect dummies (i.e., intercept shifts), but since those are dummy variables they don’t explain anything except that what’s a normal level for one state might not be the normal level for another state. For example, fixed effect variables don’t explain higher steady state unemployment rates across states, but they are useful in telling you whether or not a state is doing a good or bad job relative to its own unique (fixed effect) history.
2slugs, you are correct that I got confused again re: future state GDP versus future potential state GDP.
I looked at ALFRED and caught a chart that went back to the 20’s and it followed much of what was in the original article. The divergence became noticeable in the mid-sixties, but separation was long and slow. If I remember correctly (its been awhile) the major break happened mid 90’s. Sorry, I will look again for the link but haven’t found it again.
Ed
Found it, sort of. I added MNPCPI (MN) to the chart of per capita income of Wisconsin. The divergence does seem to happen mid-60’s and then progress from there. Each can use their own judgement as to when or if the divergence accelerates. I am not sure, could call it steady, or early eighties or even 90’s. Start with chart below.
https://alfred.stlouisfed.org/series?seid=WIPCPI
Ed
Ed,
That’s interesting. The difference in per capita income (MN greater than WI) by decade is:
1970: 3.0%
1980: 2.2%
1990: 7.7%
2000: 8.6%
2010: 9.1%
2017: 10.6%
So I’d say your “eyeball” judgement looks about right. One can only speculate on the reason for the divergence, but perhaps an historian can shed some light.
Perhaps the article to which I linked before (http://www.startribune.com/why-economic-recovery-in-greater-minnesota-is-actually-better-than-in-twin-cities/433899443/) which indicates growth in the rural areas of Minnesota from the North Dakota “shale spillover” explains some recent divergence. Wisconsin rural areas (and Michigan’s upper peninsula) have experience rapid decline.
bruce hall wrote:
Perhaps the article to which I linked before…which indicates growth in the rural areas of Minnesota from the North Dakota “shale spillover” explains some recent divergence.
It could explain some, since those areas grew faster than the state as a whole did. It would only explain a small portion of the divergence, though, because the “shale spillover” area represent only a small fraction of the state population: https://www.maps4office.com/wp-content/uploads/2016/02/USA-Minnesota-Population-Map-County-Heatmap.png
Wisconsin rural areas (and Michigan’s upper peninsula) have experience rapid decline.
Bruce Hall: I seem to recall “Open for Business” meant that people (or I think in Governor Walker’s mind workers) would also flow back to Wisconsin, so the proper metric would not seem to be per capita, but GDP or employment.
Menzie, possibly. Minnesota has remained an outlier for the midwest with regard to net migration. http://www.businessinsider.com/state-domestic-migration-map-2016-to-2017-2018-1 . That may be due to its propitious positioning as a healthcare tech center that greatly benefited from the ACA spending [http://www.modernhealthcare.com/article/20170401/TRANSFORMATION04/170329898]. Wisconsin hasn’t grown, but in contrast to its rust belt neighbor to the immediate south (as well as California and New York), it has done a reasonably good job. Even Michigan, which enjoyed a resurgence in the automotive industries with 2017 being a very good year, had a greater outmigration than Wisconsin.
Perhaps holding steady in times of failure nearby is not failure.
Steven Kopits had an appropriate comment: https://econbrowser.com/archives/2018/03/when-did-minnesota-and-wisconsin-fortunes-diverge#comment-207098
Dear Menzie,
A nitpicking point – it’s gross state product, and it may be poorly calculated. The log of nonfarm payroll employment is better and more accurate.
Regarding Peak Trader’s attempt to moan about the growth in the Minneapolis-St. Paul area, isn’t a lot of the growth due to the immigration of Somalis and others who certainly aren’t Norwegians, and isn’t this just supposed to bring total ruin and “carnage”?
J.
J, it’s great the Twin Cities economy became more diversified, since the late 1960s, and attracted high quality workers from the rest of the country. Of course, you can’t continue to moan Wisconsin’s relative underperformance is Gov Walker’s fault.
You may want to see Somali statistics in Minnesota – Do we need to import more poverty?
https://somalianculture.weebly.com/statistics.html
“Of course, you can’t continue to moan Wisconsin’s relative underperformance is Gov Walker’s fault.”
of course you can. peaktrader cannot, we know, as he is unable to accept any failure as his own responsibility. his continued denial of his contribution to the financial crisis as an ex-unemployable failed banker is evidence enough.
Julian Silk: I used to call it GSP, but then BEA changed the term on its website, so am merely citing as they do. I defer on the reliability of state level GDP. Am working on a paper to discern whether state level GDP and NFP are cointegrated.
Dear Menzie,
They will be, but weakly. I think NFP will be more strongly cointegrated with something else, possibly employment. Do check before assuming everything is I(1) and rushing off into your Johansen-Juselius tests.
Julian
I wanted to put a very late comment in here (which probably no one will read, which is why I make “off-topic” comments in more recent posts sometimes).
Oklahoma runs its budget in a very similar fashion to Kansas under Brownback, which is to say, they run their tax system in such a way there are no revenues to cover even basic government services in the state. This is why, around April 2 all of the public school teachers went on strike. They have gone through decades of low income, 20 year old textbooks (nevermind laptops), and teachers having to pay out of their own pocket to give students learning supplies. This current strike, which is ongoing because legislators haven’t committed the proper revenue sources for the promised pay raises, will at least be going up to this Thursday (April 12) and could drag on quite awhile depending on if legislators will EVER be accountable for their promises and pass the revenue bills needed to pay for their promises.
https://www.readfrontier.org/stories/oil-bust-has-allowed-many-oklahoma-companies-to-avoid-income-tax-despite-massive-profits/
Oklahoma teachers have finally wised up about legislators yanking the football away like Lucy on Peanuts.
https://www.youtube.com/watch?v=055wFyO6gag