Maybe. But not as of 2018M01.
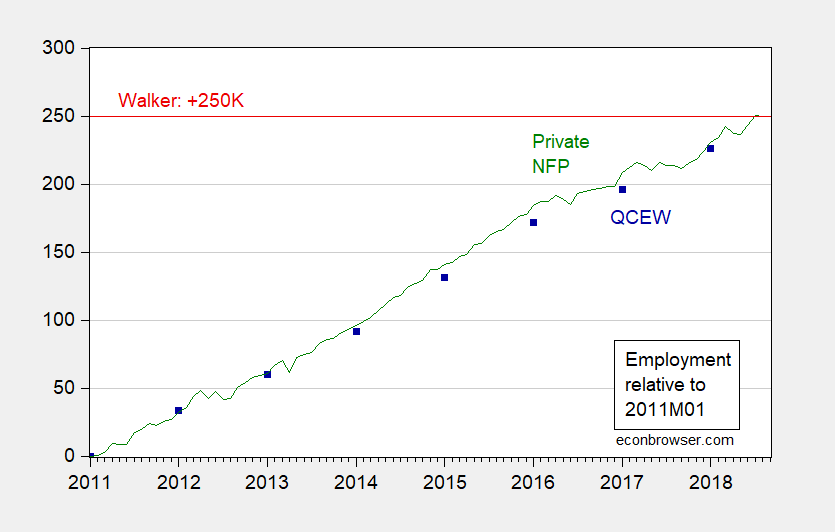
Figure 1: Wisconsin private nonfarm payroll employment, 000’s s.a. (green) relative to 2011M01 value, Quarterly Census of Employment and Wages private employment (dark blue square) relative to 2011M01, +250K (red line). Source: BLS, author’s calculations.
One could seasonally adjust the QCEW series using a standard seasonal adjustment routine. I use X-13 (multiplicative) in EViews to generate a seasonally adjusted QCEW series. This is plotted in an analogous fashion in Figure 2.
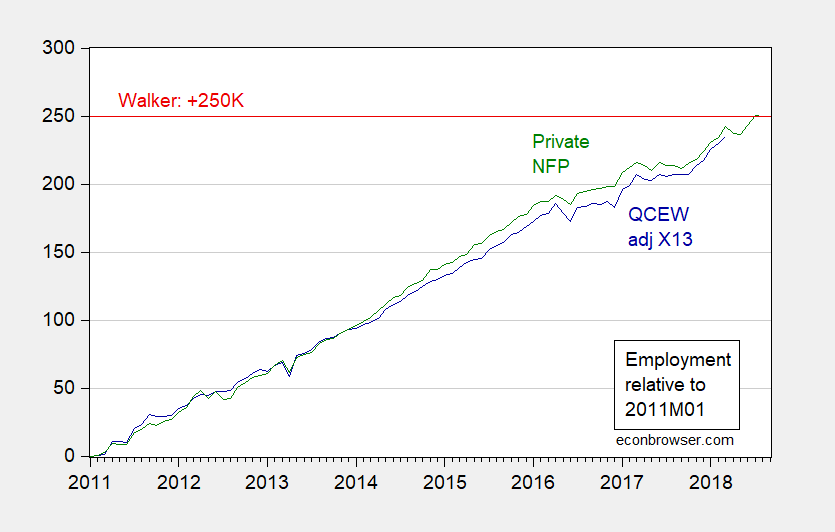
Figure 2: Wisconsin private nonfarm payroll employment, 000’s s.a. (green) relative to 2011M01 value, Quarterly Census of Employment and Wages private employment, adjusted by X-13 (dark blue) relative to 2011M01, +250K (red line). Source: BLS, author’s calculations.
By this measure, which Governor Walker called the “gold standard” [link added 9/24], employment has not exceeded the value promised for 2015M01, as late as in August 2013.
At first I thought that whole Rosenstein story about the tape recording & 25th amendment was a big deal, but the longer I look at it, I’m thinking Schmidt is kind of like the dog is when you fake throw the ball. I think NYT got duped. Or maybe they wanted to get “duped” because they thought it would sell more papers?? I mean I respect the NYT and I pick up copies when I can—but this one just smells bad.
Ok, this guy has had his chance. He has been governor since 2011. He didn’t deliver on jobs or roads and schools. Every year local schools are underfunded. Roads are filled with “Scottholes.” And now he is claiming he is the “education governor” by throwing out a $100 to parents to ensure they vote for him. No. His policies haven’t worked. Time for Wisconsin to get back to responsible governance.
(Here are some references. Roads: National report: Half of Wisconsin’s major roads are in poor or mediocre condition https://madison.com/ct/news/local/govt-and-politics/national-report-half-of-wisconsin-s-major-roads-are-in/article_01841742-0cf0-55ea-85d6-3e4d7c3dbe65.html Schools: https://www.starjournalnow.com/2012/05/29/letter-walker-is-a-disaster-for-public-education-by-dwight-logan/ and the $100
https://www.jsonline.com/story/news/politics/2018/05/15/wisconsin-families-sign-up-scott-walkers-100-per-child-tax-rebate/610753002/ )
Menzie claims: “Maybe. But not as of 2018M01.” Yet in his previous article he noted: “As of July 2018, Wisconsin’s private sector net job creation surpassed Walker’s promised target — a full 3.5 years late.”
So truncating and adjusting the data, Menzie gets to say MAYBE. At this time Walker’s prediction is accurate and Menzie’s point of it being LATE is also correct. Does Menzie’s complaints and opinions trump the voters? We’ll soon see.
CoRev: You do understand that (1) QCEW data extends only to 2018M03, (2) there is no seasonally adjusted series so I have to either compare month against month, or (3) seasonally adjust. ***In no case does that get me past 2018M03*** I didn’t truncate the data. Nobody truncated the data. The data has not been reported. “C” in QCEW stands for “Census”.
Menzie claims: “: I didn’t truncate the data. Nobody truncated the data.” And explains that the dataset he decided to use: “You do understand that (1) QCEW data extends only to 2018M03” Comparing a truncated dataset, QCEW, to nearly complete to 2018M06/07 NPF data that shows the event happened in its last 1-2 months certainly uses truncated data, and that truncated data deliberately couldn’t support Walker’s claim.
This analysis confirms what I have expected from you, and your response appears a little sensitive to being challenged.
CoRev: Did you not read the post? Governor Walker asserted the QCEW was the “gold standard” in employment numbers, not I. So, I am being truer to the Walker of 2012 than you in using the QCEW.
added: See this press release.
“So truncating and adjusting the data”.
Excuse me but do you have some magic crystal ball that tells you what a series will be well before it comes out? If so, please tell us what stock prices will be on October 1, 2018!
My eyeballs say that there is very little noise in the X13-adjusted QCEW series between April 2013 and March 2016 compared to outside that date range. Is that an artifact of the seasonal adjustment, was there some factor that did or didn’t apply between those dates, or do my eyeballs need better training?
GeoffT EViews selected a multiplicative (as opposed to additive) adjustment. That means the seasonal component of the time series is nonstationary; i.e., the amplitudes of the seasonal factors are changing.
I’m sorry, I just do not get the second chart.
It is the NSA data versus the SA data of the same time series, right?
So how can a seasonal adjusted series be larger than ( smaller than) the NSA series for consecutive year after year.
For monthly data, doesn’t the SA and NSA adjusted data have be the same over a twelve month period?
Spencer: In the first, I just show January observations of QCEW so you can compare against January 2011. In the second, I plot the entire QCEW data series which extends (right now) to March 2018. Thought I mentioned comparing only January to January in text; if confusing, I apologise. QCEW typically lags about 6 months the NFP.