Reader Anonymous was skeptical that previous correlations between deaths, hospitalization and ICU shown in this post use would continue to hold, specifically, in a first differences specification:
Δldeathst = 0.00045 + 0.276Δlhospt-21 + 0.270Δ licut-14
Adj R2 = 0.07, SER = 0.048, DW = 1.69, N=529, bold denotes significance at 5% msl, using HAC robust standard errors.
As critique, he wrote:
1. Omicron is a very different variant than Delta (or alpha, beta), especially in terms of per case impact. So training the model on earlier Covid has some real uncertainty here.
2. In particular, the model is trained only with US observed lags (fine, since we’re looking at US to come, but then you’re not capturing insights from other countries where Omicron has swept through. Seemingly this info ought to affect a Bayesian prediction somehow.
3. Recent (DEC) data may be heavily contaminated with Delta, but that is changing to Omicron very rapidly. So DEC may not drive JAN.
4. Even if it were exactly same Covid, population is different.
As it turns out, actual fatalities (7 day trailing moving average) exceeds the forecast from the first differences specification.
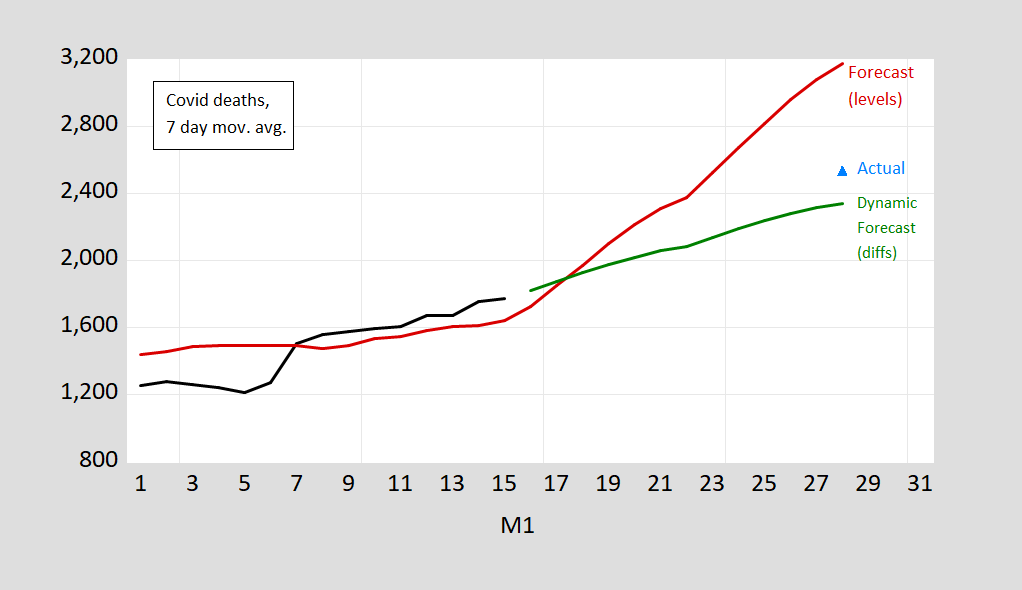
Figure 1: Covid deaths, 7 day moving average (black), and prediction based on log-levels OLS regression 7 day moving average of deaths on lagged hospitalization and ICU (red), and based on first differences of logged values (green) (see text above), and actual 7 day moving average on 1/28 as reported in NYT 1/29/2022. Source: Our World in Data accessed 1/16/2022, NYT accessed 1/29/2022, author’s calculations. [Update of Figure 4 in this post]
The average 2529.2 deaths/day exceeds the point estimate of 2342 by 8%, but is well within the 95% prediction interval.
Is it unfair to say that since you didn’t report error bars before, claiming now they would include the noisy reported estimate doesn’t count? Is it unsportsmanlike to compare this to inn pool, if you don’t call the pocket?
rsm: I’m sorry, I really don’t understand what you are writing, more so than usual.
In your original post, did you include error bars on the final graph? Yet now you tell us the error bars were at least plus-or-minus 8%, probably a lot more, since 8% was “well within” the 95% confidence interval?
Are you being disingenuous when you say you don’t understand?
Oh, and isn’t it interesting that the error bars on the first forecast, being about plus-or-minus 30%, were wide enough to include the actual, noisy (you do understand why any statistic is inherently noisy, right?), current estimate? So what good is the forecast? It got direction right, but won’t that end up just noise?
You suggesting that anyone else is disingenuous? Anna Freud would be so proud!
rsm: Well, no – I don’t think I ever provided “error bars” in prediction intervals, in 40-odd years of doing economics. I’ve created prediction intervals, and drawn confidence intervals.
You complain when there is no error. And then you complain when error is reported. It looks like you simply want to complain. Or whine.
He does not understand what he wrote either. He never does.
Looks like the green model (I think that was your final prediction) performed well. 2500 versus 2350 is pretty close. Kudos.
Still wonder why so different in the US. Are we that much fatter? Or is it something about the cause assignation being more ready here than overseas (not saying who is right or wrong).
https://fred.stlouisfed.org/graph/?g=Fkvk
January 30, 2018
Life Expectancy at Birth for United States, Canada, France, Germany, Italy, Japan and United Kingdom, 2000-2019
https://fred.stlouisfed.org/graph/?g=Cfuw
January 30, 2018
Infant Mortality Rate for United States, Canada, France, Germany, Italy, Japan and United Kingdom, 2000-2019
In Europe you see for each omikron death much more hospitalisations (of which most are not happening because of the primary diagnose covid but with covid) in comparuison to the delta variant. My bet is that your projection will be even slightly higher in future when omikron causes all the cases.
https://www.oecd.org/unitedstates/health-at-a-glance-US-EN.pdf
Health at a Glance 2021: * OECD Indicators
Highlights for the United States
Health status in the United States is lower than the OECD average, though self-rated health is high
Life expectancy fell by 1.6 years in the United States in 2020; COVID-19 vaccinations have plateaued despite a strong start
United States overweight/obesity is the third-highest across OECD countries
Overweight / obese (2019 or nearest year) Population with BMI>=25 (% population 15+)
United States 73%
OECD 56%
* Through end of June 2021
Since the possible problem of relative weight in relation to the severity of coronavirus infections was raised, I simply referred to the national data of OECD countries. Here the United States fares poorly. However, looking to life expectancy and infant mortality data in relation to the rest of the Group of 7, as shown above, the United States fares remarkably poorly and a range of general health characteristics might be looked to.
https://news.cgtn.com/news/2022-01-29/Chinese-mainland-records-59-confirmed-COVID-19-cases-17d3HtNtlwA/index.html
January 30, 2022
Chinese mainland reports 81 new COVID-19 cases
The Chinese mainland recorded 81 confirmed COVID-19 cases on Saturday, with 54 linked to local transmissions and 27 from overseas, data from the National Health Commission showed on Sunday.
A total of 65 new asymptomatic cases were also recorded, and 800 asymptomatic patients remain under medical observation.
Confirmed cases on the Chinese mainland now total 106,015, with the death toll remaining unchanged at 4,636 since January last year.
Chinese mainland new locally transmitted cases
https://news.cgtn.com/news/2022-01-30/Chinese-mainland-records-81-confirmed-COVID-19-cases-17eJjpuXIxG/img/f53ebeb184c54e52a5a67da08b38632a/f53ebeb184c54e52a5a67da08b38632a.jpeg
Chinese mainland new imported cases
https://news.cgtn.com/news/2022-01-30/Chinese-mainland-records-81-confirmed-COVID-19-cases-17eJjpuXIxG/img/b19b59fc3ae446979d3e531773b68463/b19b59fc3ae446979d3e531773b68463.jpeg
Chinese mainland new asymptomatic cases
https://news.cgtn.com/news/2022-01-30/Chinese-mainland-records-81-confirmed-COVID-19-cases-17eJjpuXIxG/img/69c37b1f8ba74224ad013f89acc0ad2e/69c37b1f8ba74224ad013f89acc0ad2e.jpeg
https://www.worldometers.info/coronavirus/
January 29, 2022
Coronavirus
United States
Cases ( 75,481,122)
Deaths ( 906,861)
Deaths per million ( 2,715)
China
Cases ( 105,934)
Deaths ( 4,636)
Deaths per million ( 3)
http://www.xinhuanet.com/english/20220129/163cafdd807e4e3db7a60e88ece19002/c.html
January 29, 2022
Almost 3 bln COVID-19 vaccine doses administered on Chinese mainland
BEIJING — Almost 3 billion COVID-19 vaccine doses had been administered on the Chinese mainland as of Friday, data from the National Health Commission showed Saturday.
[ January 15, 2022
Over 1.22 billion fully vaccinated against COVID-19 on Chinese mainland. ]
Just a speculation…
I wonder if severity and co-morbidity work differently? We are told that omicron produces fewer severe cases, but your results show it produces at least as many deaths per hospitalization. Alternatively, perhaps hospitals were so quickly overwhelmed by a omicron that admitted cases have been more severe.
That is to say, triage rules have changed under omicron.
macroduck: Since the regression included ICU use, I’m not sure one can make a simple comparison on hospitalization to death incidence.
what i s going on with all cause deaths in the usa?
from aug 2021 you can observe a rising trend. maybe 4 to 5k per week.
https://www.cdc.gov/nchs/nvss/vsrr/covid19/excess_deaths.htm?fbclid=IwAR3ZvlEsuF6TC4QZn0JIJpHswJxCtn9tNVZW45QwXNW-HHvXxifmD6rPy90
never during mass inoculation did the excess death estimate go below threshold…
shorter, keying on ‘with covid’ death certificates is horse blinders public health.
not stating the huge correlation of ‘with covid’ deaths and co-morbidity keeps a debate raging that is off track. too many cherries.
Anonymous: If I used “excess deaths” as a metric, I’m pretty sure given the high correlation over the last year I’d get the same answer.
Anonymous: “Still wonder why so different in the US. Are we that much fatter? Or is it something about the cause assignation being more ready here than overseas (not saying who is right or wrong).”
I don’t see the confusion here. The simple answer is that the U.S. is much less vaccinated than most of Europe, especially for boosters. Fewer vaccinations means more deaths. For example in the UK, 84% of those over age 12 have received two doses and 65% have had a booster. In the U.S. 72% have received two doses and only 35% have had a booster.
With Omicron there are a significant number of breakthrough infections but worst case for the vaccinated is two or three days in a hospital bed with supplemental oxygen then home again.
South Africa was even less vaxxed than the US, but had low Omicron deaths. So it’s not “simple”. In addition, the vax (while still helpful) not as strong for Omicron as it was for previous variants.
I’d be interested if the excess deaths (which I agree was convincingly previously) extends to Omicron. It is a different bug and is more in the upper airways than the deep lung.
to add to Joseph’s comment, South Africa has about 5% of population older than 65. the United States is at about 16% oder than 65. this should go a long way in describing the different outcomes.
Anonymous: “South Africa was even less vaxxed than the US, but had low Omicron deaths.”
Sub-Saharan African has indeed been an anomaly that has perplexed epidemiologists. Africa has experienced much lower death rates than any other continent in the world even in the absence of vaccination. There are a couple of leading explanations.
The first is that sub-Saharan Africa has a much lower median age of 20 years compared to North American and Europe which are 38 to 40 years. Younger age means fewer deaths. The other explanation is that Africans may have been exposed to many more similar coronaviruses and may have some limited immunity that doesn’t prevent infection but does prevent severe disease from Covid. This has been supported by antibody surveys.
But for the U.S. compared to Europe, I don’t think there is much controversy. Fading immunity to Omicron from two-dose vaccination has been well documented. High immunity to Omicron from a third booster has also been well documented.
In the U.S., 30% of people over the age of 60 have not been boosted. In Denmark only 7%, in the UK 5% and Portugal only 2% have not been boosted.
The U,S. has a lower two-dose vaccination rate than Europe, but more importantly a dramatically lower rate of booster shots among the elderly. That’s what is pushing up the U.S. death rate.
Get your boosters.
All of which may be true. But it’s not “simple”. You have a multifactorial situation. Differences in variant (cron versus delta). Differences in vax. In previous infection. In age. In obesity. In cause assignation policy.
Anonymous: “assignation policy”? Sounds kind of steamy. Do you mean “assignment policy”?
The more we learn, the more we confirm that the “official policy” was simply economically destructive. Sweden was right.
This systematic review and meta-analysis are designed to determine whether there is empirical evidence to support the belief that “lockdowns” reduce COVID-19 mortality. Lockdowns are defined as the imposition of at least one compulsory, non-pharmaceutical intervention (NPI). NPIs are any government mandate that directly restrict peoples’ possibilities, such as policies that limit internal movement, close schools and businesses, and ban international travel. This study employed a systematic search and screening procedure in which 18,590 studies are identified that could potentially address the belief posed. After three levels of screening, 34 studies ultimately qualified. Of those 34 eligible studies, 24 qualified for inclusion in the meta-analysis. They were separated into three groups: lockdown stringency index studies, shelter-in-place- order (SIPO) studies, and specific NPI studies. An analysis of each of these three groups support the conclusion that lockdowns have had little to no effect on COVID-19 mortality. More specifically, stringency index studies find that lockdowns in Europe and the United States only reduced COVID-19 mortality by 0.2% on average. SIPOs were also ineffective, only reducing COVID-19 mortality by 2.9% on average. Specific NPI studies also find no broad-based evidence of noticeable effects on COVID-19 mortality. — Johns Hopkins
https://sites.krieger.jhu.edu/iae/files/2022/01/A-Literature-Review-and-Meta-Analysis-of-the-Effects-of-Lockdowns-on-COVID-19-Mortality.pdf
Your credibility was already zero. Now it is negative. Check the comment section under the most recent post as your latest fraud has its little panties showing. BTW – how much do you get paid for your incessant disinformation campaign? Betcha not as much as Joe Rogan.