With the release of April employment (428K > 391K Bloomberg consensus), we have the following graph of key indicators noted by NBER BCDC.
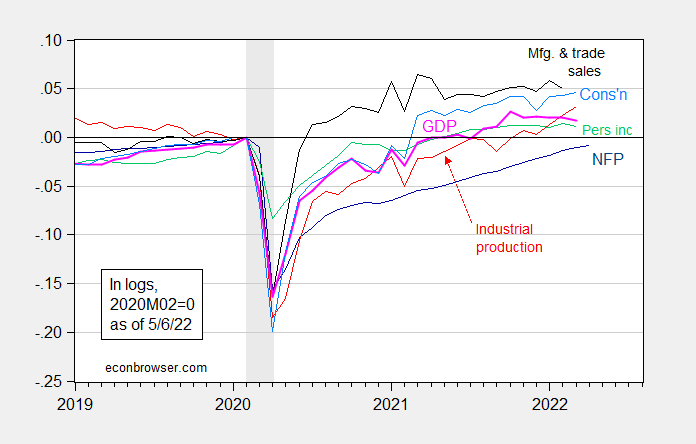
Figure 1: Nonfarm payroll employment (dark blue), industrial production (red), personal income excluding transfers in Ch.2012$ (green), manufacturing and trade sales in Ch.2012$ (black), consumption in Ch.2012$ (light blue), and monthly GDP in Ch.2012$ (pink), all log normalized to 2020M02=0. NBER defined recession dates, peak-to-trough, shaded gray. Source: BLS, Federal Reserve, BEA, via FRED, IHS Markit (nee Macroeconomic Advisers) (5/2/2022 release), NBER, and author’s calculations.
Notice that employment continues trending upward during the first quarter, when negative GDP growth is recorded. This highlights the reasons why recession calls are not made on the basis of GDP alone.
Employment numbers were revised down slightly in previous months. Here is the official NFP series from the establishment survey (CES) compared to the civilian employment series and the civilian employment series adjusted to the NFP concept (the latter two from the household survey, CPS).
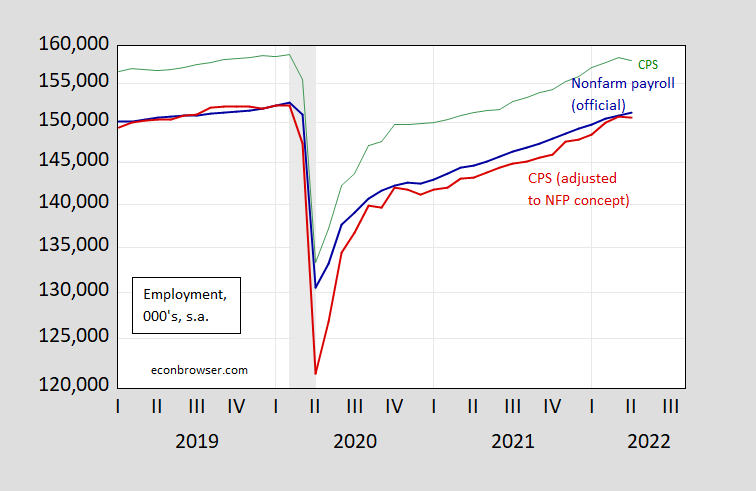
Figure 2: Nonfarm payroll employment (blue), and civilian employment (green) and civilian employment adjusted to nonfarm payroll concept (red), all in 000’s, s.a, on log scale. NBER defined recession dates peak-to-trough shaded gray. Source: BLS via FRED, BLS, NBER.
While I place little weight on the household survey for month-to-month employment developments in the aggregate, it is somewhat reassuring that both all three series are moving upward: NFP at 4.2% vs. CES adjusted to NFP concept at 5.9%, both on 3 month change annualized.
Jason Furman has more on the employment release, and its implications. The CEA discusses the data as well.
Using the same model for May nonfarm employment as used for April, we may see an increase in employment of only about 185k. The same model forecasted 410k for April vs. actual report of 428k. Will an increase of 185k down from 428K further spook the markets?
This is a very difficult week in which to attribute market price swings to specific events. There has been pre-event positioning and position unwinding mixed in with responses to the event themselves for both the Fed policy announcement and the (two) jobs report(s), in a market that is deleveraging. And a bunch of other stuff.
As to next month’s reaction to the jobs data, it will depend to a large extent on expectations and on market conditions. A bear steepening in Treasuries tends to be hard on stocks, all else equal. Gamma trades tend to increase price volatility when volatility is high, and gamma trades are all the rage right now. Volatility tends to scare off new money and so limit price gains. Next month’s response to data is tough to even think about when so many non-data factors are whipping around.
the Consumer Credit Report for March was released by the Fed at 3PM today, and hence its story was buried..
the report showed that overall consumer credit, a measure of non-real estate debt, grew by a seasonally adjusted $52.4 billion, or at a 14.0% annual rate, as non-revolving credit expanded at a 7.4% annual rate to $3,441.5 billion, while revolving credit outstanding grew at a 35.3% rate to $1,097.5 billion…
that struck me as the largest jump i’d seen, so i checked FRED, who says it’s the largest since January 2006…
NB it is consistent with the +0.5% in personal income, the +1.1% in PCE, and the savings rate at an 8 year low as shown by the March income and outlays report
December 2010?
https://fred.stlouisfed.org/graph/?g=P0mE
The big swings look a little glitchy. Is there predictive power in consumer credit?
Re: December 2010?
i had checked revolving credit, which has now been increasing sharply for three quarters…i don’t know if it predicts anything, but i’d be uncomfortable if we get to a place where PCE gains are being charged on Visa and Mastercard..
Consumer credit these days is way more diverse than credit cards. Much of the new fintech business is small-borrowing-model companies either becoming banks specializing in small consumer credit, or helping larger financial institutions build their small consumer credit business. They’re better than ever at identifying good small borrowers. This is partly the world of machine learning, partly the world of much-maligned 2005 bankruptcy reform (which made it easier to collect on some borrowers). We should expect higher quality borrowers at the bottom of the market.
Not sure what that means macro-wise, though, which was the original point.
from the furman link 6 may:
“There is substantial room for labor force participation to improve and boost employment without adding to inflationary pressures. ”
the link states: ‘labor participation and other measures of employment decline in the report!’
are labor participation and the large amount of open positions in technical companies a drag on gdp, and how do we solve that while the fed raises rates and slows the demand side?