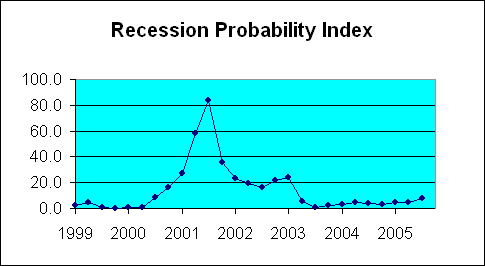
Very weak GDP figures produced a slight rise in the recession probability index and warrant a more pessimistic outlook for 2006.

The Commerce Department announced today that U.S. real GDP grew at an annual rate of 1.1% in the fourth quarter of 2005, 2% slower than any quarter since 2003:Q1. This caused a slight move up in the GDP-based recession probability index to 7.4%. This index is not a forecast of where the economy will be later this year, but is a backward-looking assessment of where the economy was as of 2005:Q3, using the latest data to form that assessment. The index leaves us confident that the current economic expansion continued at least through the third quarter of 2005. Background on how this index is constructed and a review of its historical performance is available here.
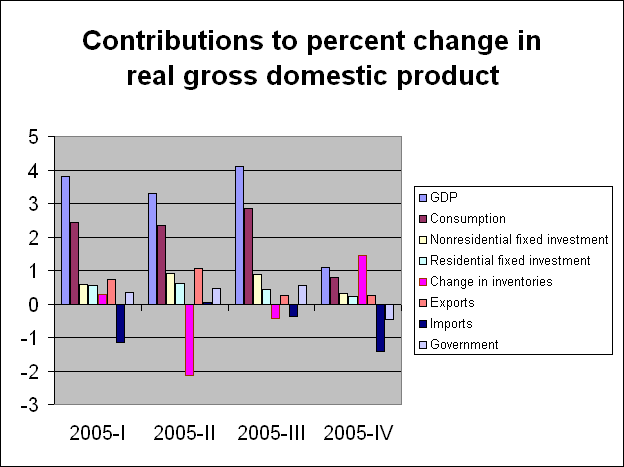
The specific details of the latest GDP figures are very discouraging. The strongest growth was right where we don’t want to see it– inventory accumulation contributed 1.45% positive growth to fourth-quarter GDP, meaning that real final sales actually fell. Some inventory accumulation was expected given the big negative inventory investment earlier in the year, but still, it is a bleak quarter indeed if that’s all you’ve got going for you.

And it really was. A drop in consumption spending accounted for the biggest part of the drop, understandable given that it comprises the lion’s share of GDP. This wouldn’t necessarily be bad if it had been replaced with higher investment or exports, but these both deteriorated as well. With a drop in consumption we might have hoped for lower imports, but these in fact surged, contributing -1.4% to the fourth quarter GDP annualized growth rate.
Here are a few other reactions:
- Kash at Angry Bear: “I’ve been bearish about economic growth in 2006 for a little while now, and this has just confirmed my worst fears.”
- Ken Jarboe at Intangible Economy: “I try not to read too much into a single data point. However, the projected decline in services exports will bear watching.”
- Andrew Samwick at VoxBaby: “If it was the hurricanes, we expect a rebound. If it was not the hurricanes, we don’t.”
- General Glut: “The end of cheap credit in America finally begins to show its effects in the broadest of measures, gross domestic product.”
- Capital Spectator: “No matter how you spin it, a drop to 1% from 4% is something more than trivial.”
- Brad Setser: “The market thinks that the (bad) q4 GDP number is old news; the economy is looking better in q1. The market is also banking on stronger export growth to help support US growth in 2006. See Justin Lahart. I hope they are not banking on a mirage.”
The jump in imports and inventories are probably closely related. Retailers scheduled strong imports before oil prices surged and were not able to turn off the tap. So when they couldn’t sell the imports at Christmas they ended up in inventories. But this means both should reverse next quarter.
In today’s economy retail inventory adjusments now show up much more in swings in imports rather than in orders to domestic producers.
This is one reason the economy has become more stable.
Spencer, if you are right, q1 non-oil import growth should be subdued — it will be q2 05 all over again. Dr. Hamilton. Excellent work. Great graph.
Here is my reaction to the numbers
But this means both should reverse next quarter.
Nope… same thing that caused the back up last quarter will still be in effect this and future quarters.
You are correct the schedule for import deliveries were made far in advance… but you underestimate the lead-time. Probably a year or more. While they can tweak deliveries… they can’t shut them off or ramp them up that fast.
The stuff is already being made and on the way. So next quarter will be another bad month on BOTH imports & inventories WITHOUT a step up in consumer spending.
We might see inventories back off… but only if folks take it home from big box stores.
This does not apply to domestic producesrs whose supply chain & lead-times are far shorter. So it is possible we might see the WORST of all situations… where inventories & imports are increasing simultaneous to declining domestic production.
Nice.
Is this surprising? It looks to me as though Fed policy were working. Consumer spending is down (as you’d expect when interest rates are up and people are buying on borrowed money), oil imports are up.
Disappointing GDP
Reuters has the headline of the day: Forecasters way off on growth estimates. The Wall Street Journal has some responses from economists, including Angry Bear’s Kash Mansouri The only thing that kept GDP growth positive at all was a massive…
anyone else catch this?
http://money.cnn.com/2006/01/27/news/international/pluggedin_fortune/index.htm
Were this (GDP) isolated among various factors, you could see differing views on it’s import.
Unfortunately, it is not isolated. The general trend of earnings, particularly in tech, reflects a consistent message.
Insiders are selling at record levels.
Last year “buybacks”, especially when you review the buyback activity in the following quarters 10K report (most buybacks were against declines, thus supporting respective stocks), that too is quite revealing and plainly shows that a substantial component in the so-called “support” of the Market is from company balance sheets.
Consumer trends – from aggregate credit contraction, to actual retail sales, are also consistent.
Housing is similarly consistent this.
And finally, one of the most historically reliable indicators the “Yield Curve” is also sending the same message.
Maybe the Market has not made a top, and maybe the DOW 40,000, is going to come to pass.
But to ignore or attempt to explain away all of these data points, that have indeed been giving a consistent message (one the “Insiders” obviously read), is to ignore plain reality.
Looking at the statements of Alan Greenspan, at Jackson Hole in August 2005, and considering all of these data points, one can see the outline of serious trouble for asset markets.
As the great Jesse Livermore said (I’m paraprhasing) “Nowhere does history indulge in repetitions so often or so uniformly as in Wall Street”.
Fed Watch: Now It Gets Interesting…
Tim Duy with a Fed Watch: For the Fed watcher, the 4Q05 GDP report is a real brainteaser. The central focus of the many, many blogs covering Friday’s news was the disappointing growth numbers (see William Polley’s and James Hamilton’s
The 4th qtr GDP report does not suprise me that much. For some time, the phenomena of consumer spending beyond income as a result of mortgage equity withdrawl has kept the GDP growth appearing rosy.
Since the MEW cycle has been completed and people are leveraged to the teeth, a slow down in consumer spending was inevitable. One of the least observed components that has made the previous quarters appear more robust than they would otherwise be, is the contribution from the massive Federal borowing. Normally reserved as a Keynsian remedy for recession, the US has stimulated, stimulated, stimulated to keep an anemic economy going.
Let’s hope that the housing sector doesn’t collapse too rapidly. Over 40 % of the newly created jobs over the past three years have been housing related.
The bullish community on Wall Street has been saying “that’s old news” for some time. The truth may be that we have seen the peak of the earnings cycle for profits. If anyone else has noticed, a number of major sectors are reducing outlook as well as reporting some fairly significant misses.
According to the Financial Markets Center “Household Financial Conditions: Q3 2005” report (http://tinyurl.com/ahjmn):
“The acquisition of Treasury securities helped boost household liquidity to its highest level since the end of the 1990s, as the ratio of liquid household assets to disposable income rose to 77.0 from 75.3 percent. However the principal reason for this liquidity growth was not the modest increase in Treasury holdings but a $661.2 billion build-up in time and savings deposits — far and away the largest quarterly surge in net new deposits on record.”
Perhaps consumers are heading in to balance sheet repair mode, and will start moving their liquid-asset/disposable-income ratio back toward the 82.8% average of the ’90s — maybe even to the 94.6% peak of 1988? Especially when the real estate bubble starts deflating in earnest, sending the Homeowners Equity/Value of Household Real Estate ratio down to new lows far below its current near-record 57.1%; getting it back up to the ’80s average of 67.7% would require paying down several trillions in debt. Not a rosy scenario for consumer spending.
GDP Grade for the 4th Quarter
Sorry for the delay – Friday’s announcement that real GDP grew at a 1.1% rate in the 4th quarter grades out at: A D using my standard scale, which is tougher than most college classes. A C using a curve