Now that the Energy Information Administration has published oil production figures for the full year 2005, I was curious to take a look at how the predictions of Cambridge Energy Research Associates are faring thus far.
|
CERA performed a detailed field-by-field analysis of each of the major oil projects that will be coming into development over the next few years, on the basis of which CERA Chairman Daniel Yergin concluded:
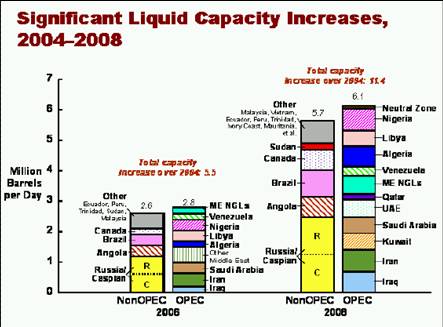
There will be a large, unprecedented buildup of oil supply in the next few years. Between 2004 and 2010, capacity to produce oil (not actual production) could grow by 16 million barrels a day– from 85 million barrels per day to 101 million barrels a day– a 20 percent increase. Such growth over the next few years would relieve the current pressure on supply and demand.
Although CERA did not publicly distribute numerical values for these field-by-field assessments, I carefully eyeballed the graph on the right to come up with rough estimates of the numbers that CERA was apparently proposing for the increase in oil producing capacity between 2004 and 2006 from the eleven countries CERA believed would contribute the most. I then compared these predictions with the increase in the actual oil production for each country between 2004 and 2005 as reported by the EIA [1]
[2].
Two of these important countries (Iraq and Canada) actually experienced production declines rather than increases, and Venezuela delivered essentially no increase. For the others, however, CERA does not seem to be doing too badly at this midterm review. Taken as a group, these countries were expected by CERA to contribute 4.1 mbd of extra production by 2006, and so far they are providing 1.6, not too far from the halfway mark.
On the other hand, when you look at the worldwide total, the discrepancies are more significant. Worldwide, CERA said production capacity would increase by 5.5 mbd, whereas in the event, world oil production was only 1 mbd higher in 2005 compared with 2004. The latter statistic also confirms that although strong demand was the principal factor that drove oil prices higher in 2004, supply constraints were the big story in 2005.
If production in these 11 countries alone was 1.6 mbd higher in 2005 than in 2004, why was production worldwide only 1 mbd higher? Basically production increases in these and other countries were offset by production declines in two key regions: output from the U.S. and the North Sea both fell by over 400,000 barrels a day in 2005 compared with 2004.
One can get slightly different numbers if one interpreted CERA to have been predicting the change between, say, 2004:Q4 and 2005:Q4. In this case, Canada would indeed be judged to be up, not down, while both Saudi Arabia and world total production were essentially flat.
For the U.S., the biggest story is the hurricanes, which MMS reported had resulted in a cumulative drop in production of 111.6 million barrels by January 5, 2006. If you put this on a per day basis for the entire year (111.6/365), that would explain a drop of 0.3 mbd (compared with the actual observed U.S. production decline of 0.4 mbd for 2005 as a whole).
|
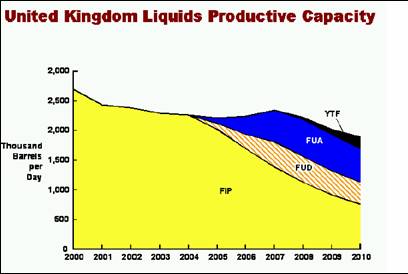
For the North Sea, the story is a matter of depletion— these fields are running out of oil at a much faster rate than was anticipated. Indeed, the graph from CERA at the left seems to have assumed that production from the U.K. at least would have held steady. Depletion could also be the reason the U.S. decline was greater than could be explained just by the hurricanes.
These calculations underscore that it can be difficult to anticipate depletion rates accurately. The concern of some analysts (e.g., The Oil Drum or Jerome a Paris) is whether faster decline rates may soon set in for some of the much bigger producers including
Saudi Arabia or Russia. Stuart Staniford has a nice summary of why he believes the peak in global oil production is about now.
Overall, I would say that the CERA estimates so far have not done that badly. But they also remind us that even the most careful analysis can end up missing by a great deal.
In case you were wondering why oil is currently selling for over $60 a barrel rather than $30.
Technorati Tags: oil prices,
oil,
peak oil
You might want to link to your earlier analysis of the CERA data:
https://econbrowser.com/archives/2005/08/some_comments_o.html
You raised several concerns. One was a comparison with an earlier study by the Oil Depletion Analysis Center, linked here: http://www.globalpublicmedia.com/articles/196
ODAC used similar methodology to CERA and came up with much smaller production growth. It would be interesting to see if their forecasts are turning out to be closer to reality than CERA’s.
You also expressed skepticism about CERA’s assumption that Saudi Arabia could increase production 3 mbpd by 2010, saying, “They repeatedly said they would increase production during the last year but so far have done little.” How do you feel about this now that they have managed to increase at quite a bit faster a rate than CERA predicted?
Another comment you made was with regard to CERA’s prediction that the supply/demand balance might vary over the next few years, with first one and then the other getting ahead: “I would not be at all surprised to see lower world oil consumption in 2006 than in 2005 as a result of the gradual changes in energy use that are already under way in response to the current prices, in other words, a production peak in 2005. I also would not be at all surprised to see demand subsequently rebound as world incomes continue to grow, met with supply coming on line from the factors identified by CERA.” Does this still sound like a reasonable prediction? Might we see lower oil consumption this year than last year, or is that predicated on the assumption of a recession?
Note that TOD reported yesterday that December 2005 was (by a tiny margin) the highest oil production month in history:
http://www.theoildrum.com/story/2006/3/3/184126/9260
It looks to me like we could still be on track for production growth in 2006, the main question being whether demand will be there.
Great points, Hal. The quantitative numbers for the ODAC study are here. Unfortunately, these are only assessments about the flow of oil from individual new projects themselves, rather than something one could use as a forecast of the total production (net of depletion) for an entire country.
On Saudi Arabia, basically what happened is they increased production from 8.6 mbd in 2004:Q1 to 9.5 mbd in 2004:Q3 and it has remained practically stuck at 9.5 mbd ever since. It was the latter fact, in conjunction with Saudi statements that they were going to increase production further, that led me to make the comments you referred to.
The CERA report was released last summer. When CERA predicted an increase in production between 2004 and 2006, it is not clear whether that increase in Saudi production in 2004 counts as what they were predicting. The calculations in my graph act as if it should.
As for the drop in demand, I was anticipating a slower rate of economic growth for 2006 than now appears to be in store. We’re certainly not at a point yet where we see sluggish demand being the factor driving the oil market. Could that still be the story by the end of this year? Yes, I think so. But at the moment the interesting statistic is that supply has not been as strong as CERA was anticipating.
Carnival of the Capitalists
Welcome to this week’s edition of the Carnival of the Capitalists. I’m sticking with my usual method of hosting a carnival — listing a summary of each piece with the author’s reason for submitting the post to the carnival (for
Oil Supply
James Hamilton at EconBrowser looks at the production capacity of crude oil over the next five years and assesses the accuracy of past forecasts.
…
IMHO, the main difference between CERA and other forecastors is one of small differences and the overall words that they use to describe the current energy balance situation. I am presently staring at a proprietary CERA report that just came out called “Focus on Energy – Perspectives from CERA week 2006” One chapter is called “Running out? Not yet” by Peter Jackson and Robert Esser. Here I quote: (also bold lettering is my addition)
Is the world running out of oil?
That old question is being asked with a new urgency.
Oil is a finite resource, and although there is still no reliable estimate of ultimate global
eserves, there is a fixed amount of it in the ground.
…….
Our field-by-field analyis concludes that the world is not running out in the near to medium term.
Our outlook contradicts the belief that peak oil is imminent. We see no evidence to
suggest a peak before 2020, nor do we see a transparent and technically sound analysis from another source that justifies belief in an imminent peak. It will be well into this century before we get to an inflexion point that will herald the arrival of what we term an “undulating plateau” – when it will be increasingly difficult for supply to meet demand.
……
An increasing percentage of future production will come from nontraditional sources
…….
The rate of growth in non-OPEC capacity will likely slow after 2010, which will tip the balance back toward OPEC producers.
More on this report later at TOD, however, CERA is just presenting the upside forecast. They still see a peak and all of the problems associated with it. They just don’t want to dwell on it – bad for business you know.
Like many other forecasters, they see a non-OPEC peak shortly after 2010. They want to believe that OPEC can deliver the extra needed for 10 more years than you and I might subscribe to.
I still think their forecast is within the realm of possiblities – but a pretty unlikely outcome.
OK, somehow I screwed up the HTML tags again. The quotes were supposed to be in italics. However, the last part of the quote was
The rate of growth in non-OPEC capacity will likely slow after 2010, which will tip the balance back toward OPEC producers.
This Week’s Carnival Of The Capitalists
This week’s COTC is up at Free Money Finance. As usual, there are a lot of good posts in many different areas. Here are some that caught my eye:
James Hamilton on Oil Supplies
Lynne Kiesling Along the same lines, James Hamilton has a good discussion of CERA’s oil supply forecasts for 2005 and what we can learn from them. One of the themes I’ve seen in the discussions about tomorrow’s OPEC meeting is…
Summer Oil Prices: Upside Threats
the US needs to thread an inside straight to maintain solid economic growth and oil prices under nominal record prices per barrel this summer. We need the Nigerian government and the international oil companies to successfully and completely co-opt …
Oil settles at over $70 per barrel
Crude oil closed above $70 a barrel yesterday for the first time despite the fact that U.S. oil inventories are at their highest levels in nearly eight years. Thus, this current price spike appears to be a reflection of a…