Seasonally adjusted new home sales were down 3.9% in February, while existing home sales were up 3.9%. Should we call it a wash?
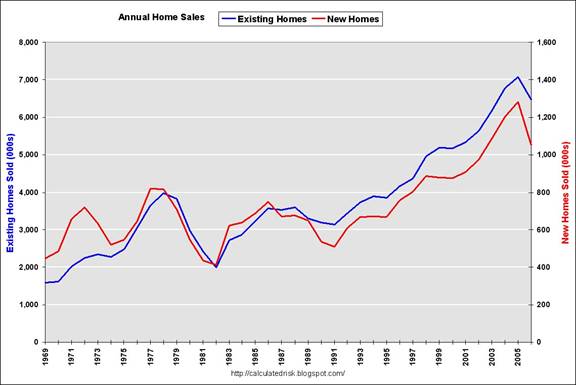 |
I think not. As Calculated Risk notes, on an annual basis the two series track each other pretty closely. But, CR continues, there is a conceptual difference that alters their month-to-month timing. Reported new home sales data are based on when the contract is signed, whereas existing home sales are based on closing. Closing usually follows the contract by 30-60 days. Here’s what the recent data look like when you lag existing home sales 2 months behind the new home sales:
 |
Viewed this way, the two series are in agreement that there was a rebound in both new and existing home sales in contracts signed between July and December. I predicted that rebound last October and attributed it to the drop in mortgage rates that occurred last July and the tendency of new home sales to respond to mortgage rates with a considerable lag. However, according to my estimate of those lags, that stimulus from lower interest rates would have vanished by February. In my opinion, the dominant factor for the next few months is likely to be the consequences of the tightening lending standards.
So, I read the existing home sales data as old news. The Econbrowser Emoticon stays grumpy.
Technorati Tags: macroeconomics,
housing
Great post professor, and thanks to CR. I’ve struggled with how to reconcile these two indicators that often provide conflicting signals.
Very nice illustrative graph of the lagged relationship, Professor. Thanks!
Professor,
I found this link from an MIT professor’s presentation in 2005, posted by someone at Ben’s Housing Bubble Blog.
You can see two definitions of a ‘bubble’ there.
What is your take on this?
http://web.mit.edu/cre/news/pdf/HB-ARES.pdf
I havent tracked data accuracy in a few years, but in the past the new home sales data was very unreliable and usually had very large revisions. Existing sales data was easier to measure at closings and had less revision issues. Is the new sales data from above as first reported or as revised? Also, the seasonal adjustments are huge, especially this time of year. A boost due to a seasonal adjustment can give a false sense of stabilization.
If we’re still on the bubble (great discussion on the prior post) I believe a larger contraction is coming although I’m reluctant to classify the market as being in bubble category. For true bubbles check out Extraordinary Popular Delusions and the Madness of Crowds by MacKay. It is always dangerous to say this time it’s different, but here goes… Due to financial engineering that has created funky mortage alternatives and the ability of financial institutions to package these out into the securitized markets, people are now treating there homes like their brokerage accounts. People have a tendency to put more of their assets into financial assets as they approach retirement and now they are conceptualizing their homes as financial assets. Also, people have a lot more information about the price of their homes and those around them via the internet – the equivalent of quote machines. People spend a portion of their wealth in good times from their stock accounts and now they do the same with their homes. As a result, any time something of value becomes securitized it will be subject price changes due to psychological issues. Any securitized market sees prices alternate between trading above and below value. The composition of buyers and sellers has changed in the market place due to a change in homeowner behavior. Anytime this happens the volatility of the market will change. As a result, the old housing price data will not be relevant. Sure, there are only a small portion of homeowners behave this way, but on the margin it is enough. This may be a 2 std move by historic standards, but it will probably be more of what to expect in the future.
Just to follow up a bit more on this topic of bubbles, there can be problems with many of the definitions. So, some characteristics that are often identified are price runups that appear to be above fundamentals, with a “speculative’ desire for quick cap gains component, followed by a crash.
OTOH, the biggest single one day crash we ever saw in the US stock market may not have followed a bubble. That was Oct. 19, 1987, about 22% on the DJI, although this followed about an equal amount of decline in the previous two months. The market immediately bounced back from its low of around 1700, and today, nearly 20 years later, it is at around 12,000. This may have been a “correction,” rather than the “crash of a bubble.”
Then there is the Japanese real estate market that has been discussed at some length on this blog. Never was a crash, and it definitely came down much more slowly than it went up. But it went up fast, more or less in conjunction with the runup of the Nikkei index of the Japanese stock market, which did crash hard in early 1990. But it certainly got very high. Again, around 1991 Japanese real estate was just wildly high by any measure. Much of their foreign buying was based on using it as collateral. The emperor’s palace grounds in downtown Tokyo (not for sale) were estimated as being more than the entire state of California.
BTW, I had it personally from Charles Kindleberger that he was quite mystified by why Japanese real estate did not crash when the Japanese stock market did. They ran up together, but real estate kept on going for another year and a half or so after the stock market crashed (and crashed hard, Nikkei is still about as far down from there as the NASDAQ is from March, 2000), but, as already noted, real estate just went down at about 4-5% for about 14-15 years, depending on what part of Japan one is in. All of this pretty much remains a mystery still.
as if tv shows about “flipping” were not proof enough … for my fuzzy lens anyway
Some reasons for the (apparently) slow decline of Japanese real estate price indices:
(1) There was significant genuine pentup demand for better housing (my speculation), and as Japanese builders kept on building and lowering prices to move the product (fact; they had acquired a lot of land and had to get it off their hands, even if at a loss, to avoid even greater losses), this somewhat braked the actual decline.
(2) In commercial real estate, gangsters moved in and became silent partners, preventing foreclosures. (Seven bankers were murdered, and there were numerous firebombings of bank branchs.)
(3) The land price statistics (at least those I have seen quoted) are under the control of government bureaucrats who had no incentive to reveal rapid decline.
(4) Because appraised values for estate tax purposes were based on the inflated government-controlled price indices, and the tax rates are high, many people inheriting land could not sell it for enough to pay the taxes, and instead just turned it over to the government, which then held it off the market to avoid further impact on market prices.
Somewhere I have a book published back around the start of the decline which argued that Japan’s financial system was based not on a gold standard (kin hon’i-sei), but rather on a “land standard” (“Tochi Hon’i-sei” — the title of the book), because it depended so heavily on land as collateral. Thus there were powerful disincentives to accurate reporting of land price declines.
I should also add to the above that mortgage interest rates in Japan were, last time I looked (a few months ago), at 2.37%.
Odograph was there also not a large part of either local or central gov. taxation (20%?+)other than (estate) sourced from property valuations
adp,
JDH is discussing home sales not lines of credit. When you have home sales you must have two sides to the transaction, a buyer and a seller. While the seller may be someone approaching retirement what is the demographic of the buyer?
Many boomers bought their retirement home before selling their primary residence, not because they can afford 2 homes but because they anticipated prices to rise – as a substitute for a brokerage account. Many anticipate using the gains on the home to fund retirement or savings – it all rolls up into net worth. A drop in prices pressures the paradigm. The demogrpahic of buyers has been steadily growing, but a very high % of home ownership indicates that lending standards were way too loose. The number of buyers will be much less than the past 3-5 years due to tightening of standards and higher rates. Also, higher price vol usually scares speculation out of any market. Whether it is home sales or lines of credit, people view their homes more as securities and less as a place to live. This causes price volatility greater than we had in the past.
As Rana mentionned in a previous post, weather is often quoted as a short-term explanation of building indicators.
I am not a US-resident so I was wondering whether you saw any specific weather influence on February (explaining housing starts)?
By the way, which information source would you advice to check for these weather effects?
Thank you for your help.