Where’s that large, unprecedented buildup of oil supply when you really need it?
By drilling additional wells, one might expect to increase the annual flow of production from a given oil field. This strategy usually proves quite successful in the initial phase of development of a newly discovered reservoir. However, as more oil is removed, less remains in the original deposit and it becomes increasingly difficult to continue to extract oil at the same rate. For this reason, the production profile from a given oil field inevitably exhibits a pattern of initial increase and eventual decline.
For example, production from Prudhoe Bay in Alaska peaked in 1988, and has declined at an average (logarithmically compounded) annual rate of 8.5% per year since then.
 |
Collecting the 21 biggest fields in Texas as a group, production peaked in 1974-5, and has declined on average 7.5% per year since.
 |
Production from Daqing, China’s biggest oil field, has been falling 2.2% per year since 1995.
 |
At any given point in time, some fields would be exhibiting increasing production, others would be at plateau, while yet others would be in decline. Total global production in a given year will increase provided that production gains from the first group exceed the declines from the last category. Discovery and development of major new oil fields is the key requirement for increasing global oil production each year.
Chevron in 2005 reported an average production decline rate on its existing fields of 4% annually. If that same rate applies to the current 85 million b/d global production, we would need to find 3.4 million barrels per day in production from new fields every year– twice the annual flow from Prudhoe Bay at its peak– in order to keep global production from declining.
The last few years we have seen substantial production gains from a number of impressive new fields. For example, Angola’s Dalia field has been producing 250,000 barrels per day since March, and Azerbaijan’s Chirag and Azeri fields produced 700,000 b/d for the first half of this year, compared with 300,000 b/d three years ago.
And yet, despite these many promising developments, global production has stagnated.
Stuart Staniford and Khebab discuss what this tells us in separate posts today over at the Oil Drum.
Stuart
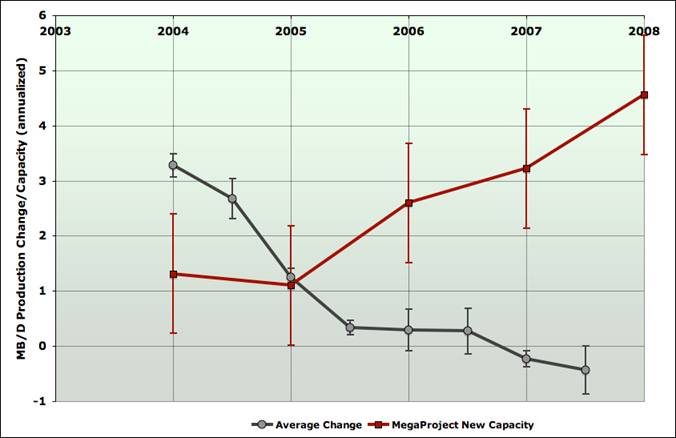
estimates the annual growth rate of world oil production four different ways, using the data reported separately by the International Energy Agency, the Oil and Gas Journal, and two separate measures from the U.S. Energy Information Administration. Stuart summarizes the average annual production growth rates from the four series in the gray line in the diagram below. The increase in production capacity from major new oil fields that went into production in the indicated year is summarized by the red line.
|
If indeed we had about 3.2 million b/d in production from the new fields in 2007, as the red line might suggest, and yet global production failed to increase, as so far appears to be the case, then a 4% average decline rate could be about right. I’m reluctant to follow Stuart and Khebab in the subsequent step of concluding that the global decline rate has increased sharply just in the last few years. I expect that slippage (projects coming on line more slowly than originally anticipated) may yet prove to be part of the explanation. And divining just what is going on in Saudi Arabia, which figures prominently in both the major new projects and decline in existing production calculations, would seem to be the key ingredient for understanding the phenomenon identified by Stuart and Khebab. But in any case, these data reinforce the conclusion that just keeping up with the depletion from existing fields may be harder than it looks, and suggest that extrapolation of Chevron’s 4% decline rate to average global production might not be so far off the mark.
And how much would any of this change if we include last week’s news out of Brazil? Petrobas just announced that its Tupi oil field may contain up to 8 billion barrels of oil and could begin producing 100,000 barrels per day in three to four years.
Let me help you with the math– the entire 8 billion barrels, if it indeed proves to be there, would be 1/4 of the world’s annual consumption.
Technorati Tags: oil,
oil prices,
oil depletion,
oil supply,
energy economics,
economics,
peak oil
Soooo maybe there are some other reasons for $95/brl oil besides geo-political risk and the weak dollar?
Those oil sands in northern Canada are looking a lot more economical by the day….
If we define the base growth/decline rate as (Production Delta – New Capacity)/Production, then it’s pretty much straightforward arithmetic that that quantity has in fact been getting worse for the last four years or so.
My picture of that rate is here.
The interpretation of that weakening decline rate is a lot more open to debate, since it lumps many things together other than just straightforward petrophysical decline.
I appreciate the work that Stuart Staniford puts into his articles but I often disagree with the basic methodology of attempting such micro-level analyses in an area where there is substantial uncertainty and lack of information. In this case, that graph is somewhat misleading IMO because it plots new “capacity” against actual production. What is “capacity”? It presumably represents some sort of potential for producing oil. Are these projects actually producing at that level? There doesn’t seem to be any validation of that. In fact there doesn’t even seem to be a clear demarcation between capacity values that are estimates of the future, versus ones which are in the past and for which presumably accurate measurements exist (somewhere) in terms of how much was actually produced.
This points to another possible explanation for the leveling off or decline of production: that it is demand based. As prices have risen it is entirely possible that demand is beginning to be curtailed, and therefore additional supply has not been forthcoming. This balance must be considered in light of the Hotelling formula for optimizing profitability of a fixed resource, which calls for steadily increasing price and decreasing production levels. These factors suggest reasons for production level declines that go beyond the traditional Peak Oil view of strict geological determinism.
Those oil sands in northern Canada will never be economic enough to make up for normal crude’s decline.
http://beastsbelly.blogspot.com/2005/08/tar-sands-will-save-us.html
The IEA MediumTerm Market report dated July 7, 2007 had this on page 29:
An average global decline rate is difficult to discern from a field-by-field forecast (with a constant ebb
and flow of fields entering decline, offset by others where decline is reversed by the application of EOR
or satellite developments). However, a proxy can be calculated by comparing net change in non-OPEC
supply for 2007-2012 and gross capacity additions. As seen below, the implied net non-OPEC decline
rate for baseload production is around 4.6% per year. This covers not only fields in decline, but also
older supply which is at or approaching plateau. With net decline from OPEC assumed at 3.2% per
year, this gives a global annual decline of 4%, suggesting that 3.2 mb/d of new production must be
found each year just to stand still.
Hal:
“Capacity” in this case represents new megaprojects as tabulated by Chris Skrebowski (links and methodology detail are at my TOD piece). It’s true that there’s some uncertainty in the timing of onset of flows from new capacity – however I’d be very surprised if that effect is so large as to erase the overall rising trend in new capacity that Skrebowski’s data shows.
While of course high prices should suppress demand, Econ 101 says they should stimulate supply, also.
“While of course high prices should suppress demand, Econ 101 says they should stimulate supply, also.”
Obviously after some time delay. I’m curious if anyone has tried to derive such a time constant from a non-parametric analysis of price vs. supply. Intuitvely, I would expect very little value in such a correlation given the number of important exogenous factors at play. Still, it would be an interesting exercise…and something that could be accomplished quickly and painlessly given that the time series are readily available.
Stuart – nice work and thanks for putting the effort in . . . . . . an important caveat to Econ 101 is that all the oil companies I talk to are using long-term price projections of $50-$65 per barrel in their financial evaluations of new projects. And I have some sympathy for them – a major oil co might sink $5-$10 billion into a huge new investment project over 3-5 years, only to find out that when finished the crude price has declined to the point where the economics of the new project are unworkable.
Kind of ironic and a bit sad that back in the late 1970s the price of crude was $30-$40 per barrel nominal and all the oil companies were budgeting projects using future oil prices of $50-$100 per barrel over the decade(s) of the 1980s and 1990s — but now that we’ve closed in on $100 per barrel oil in 2007, they’re using $50-$65 oil!!
Who says it’s the military generals who keep trying to prepare for the LAST war – the mainstream oil guru’s are among the worst of the bunch.
Remember that $120/barrel Oil is a GOOD thing, for many reasons. Tough love, short term pain/long-term gain, and all that.
Let us not forget that something like 75% of known oil reserves are controlled by governments. Higher prices anyone?
Anarchus wrote:
Kind of ironic and a bit sad that back in the late 1970s the price of crude was $30-$40 per barrel nominal and all the oil companies were budgeting projects using future oil prices of $50-$100 per barrel over the decade(s) of the 1980s and 1990s — but now that we’ve closed in on $100 per barrel oil in 2007, they’re using $50-$65 oil!!
This compares apples and oranges. In the 1970s the oil companies were looking at chronic inflation and they built it into their models. After Reagan and Volker brought inflation somewhat under control the oil companies understandably changed their methods, and they got a serious dose of reality in the late 1990s when the Greenspan deflation took oil to $10 bbl, in some cases below the price of production.
The oil forecasts are what they are for a reason.
“Kind of ironic and a bit sad that back in the late 1970s the price of crude was $30-$40 per barrel nominal and all the oil companies were budgeting projects using future oil prices of $50-$100 per barrel over the decade(s) of the 1980s and 1990s — but now that we’ve closed in on $100 per barrel oil in 2007, they’re using $50-$65 oil!!”
I don’t recall oil companies budgeting projects using future oil prices of $50-$100 during the 1970s. Projects in the $30s with starry eyes aimed at $40, yes.
Oil hitting $10-$15 bbl in the 1990s is reason why you don’t see them rushing out to fund projects at today’s prices. They also realize that a recession here could easily reduce demand in the East, too further depressing prices. If you keep up with the economic news from Krugman, Angry Bear, Brad Delong, Calculated Risk, as well as most major newspapers they seem rather prudent, don’t they?
What seems imprudent to me is the US refusing to develop the vast quantities of oil in Alaska, West Coast, East Coast, and Eastern Gulf.
Macquechoux:
If you check the latest assessment by the Minerals Management Service, their best guess is that there’s “85.9” billion barrels of oil yet to be discovered on the US continental shelf. I love that they know the quantity of undiscovered oil to three significant figures! Given the general tendency of official energy agencies to over-optimism, that should probably be discounted somewhat, but no doubt there’s some oil there. Of the 86gb, 45gb is thought to be in the Gulf of Mexico (which is an area of very active oil development already), and 27gb is in Alaska. 3gb is off the Atlantic coast, and 10gb off the Pacific coast.
For scale, the world uses 30gb of oil per year. So if all this undiscovered oil proved to exist and be developed, it would extend the global oil production plateau by about three years.
All very interesting numbers. However, Yergin has a long history of knowing what he’s talking about.
Greg:
Here are a few choice quotes from Glenn Morton’s page.
It’s certainly a “long history”. Whether it classes as “knowing what he’s talking about” would be a bit less certain, I think. I would say rather that we’re in the middle of the most profound adjustment in oil prices in decades, and Daniel Yergin has consistently and profoundly blown his calls on it.
Considering inflation, do you think that oil prices are a true concern for the economy? Or is it more of a way to measure the trend of oil prices by itself?
Stuart, I am aware of the various estimates of oil and personally I like to think in terms of recoverable oil myself. It doesn’t matter what percentage of world consumption any one US potential oil reserve may have. I have a couple of simple questions to ask. Which is better: Develop our own oil reserves or purchase 87 billion bbls of crude from Chavez, Saudi Arabia, or whomever? Secondly, no matter what the current rate of consumption is, would not the increase in the supply from all the mention sources help moderate prices? Picture a supply & demand graph without production from Alaska, Eastern Gulf, etc. and with said production.
Which would you chose?
“Picture a supply & demand graph without production from Alaska, Eastern Gulf, etc. and with said production.”
I posted this yesterday but it never showed up. Are we now to pretend that oil isn’t fungible because it suits your politics? It doesn’t help US much, since our oil industry isn’t nationalized; it may or may not help the world a tiny little bit.
I wrote an essay assessing the financial and monetary impact of the current oil situation and its prospects for 2008 at http://peaktimeviews.blogspot.com/2007/11/assessing-impact-of-current-oil.html
which I reproduce below.
Re the USD (part 1):
1. The fall in the dollar’s value since August 2007 has taken place against a backdrop of a slightly improving US trade deficit.
2. From point 1., it is just logical to infer that, if the US trade deficit had instead worsened during that period, the dollar would have fallen further.
Re crude oil prices and supply/demand balance:
3.
On Nov 20, 2006 WTI = $59 and EUR = $1.28, so WTI = EUR 46.
On Nov 20, 2007 WTI = $98 and EUR = $1.48, so WTI = EUR 66.
That’s for a WTI price rise of 66% in dollars and 44% in euros in a year.
4. This yearly WTI price rise cannot be explained by Iran-related geopolitical tensions, which were actually higher a year ago. It cannot be explained by speculative pressure either, since NYMEX net positions a year ago and now are fairly similar. Therefore the price rise can only be explained by a deterioration in physical supply and demand balance.
5. To support the inference in point 4., it’s worth noting that,
on Nov 21, 2005 WTI = $58 and EUR = $1.18, so WTI = EUR 49.
However, on Nov 2005 speculative positions at NYMEX were net short at historic record levels, so a year later we had both increased speculative pressure and increased geopolitical tensions, yet the oil price was roughly the same. Therefore, reasoning like in point 4., we deduce that supply and demand balance should have improved during 2006. And indeed, as we see in the IEA Oil Market Report (OMR) at http://omrpublic.iea.org/, total OECD closing stocks were:
for 4Q2005, 4083 mb amounting to 81 days of forward demand
for 4Q2006, 4180 mb amounting to 84 days of forward demand
6. In contrast, and adding support to point 4., OECD closing stocks for 2Q2007 were the same as for 2Q2006 (in mb and days). But more importantly, OECD stocks experienced a net *draw* of 380 kb/d during 3Q2007, contrasting with a 1160 kb/d net *build* in 3Q2006, and an average 280 kb/d 3Q net *build* over the past five years (and anecdotically, with Japanese crude stocks falling to their lowest level in at least 20 years.) Which clearly shows the worsening in supply/demand balance over 2007.
Re oil production:
7. According to the EIA, world oil production peaked on a monthly basis on May 2005 for (Crude Oil + lease condensate = CO) as well as for (Crude Oil + lease condensate + Natural Gas Plant Liquids = CO + NGL). If we consider All Liquids (which includes biofuels) then the peak month was July 2006.
8. Also from the EIA, for all 3 categories (CO, CO +NGL and All Liquids), production for the first half of 2007 has been the same as (actually slightly lower than) that for the first half of 2006 (73.23 vs 73.48, 81.20 vs 81.26, and 84.28 vs 84.35 mb/d respectively).
9. There are strong reasons that expect that 2008 world oil production will not be higher than in 2007, as shown by Stuart Staniford at
http://www.theoildrum.com/node/3236
Re oil demand and price projection:
10. According to the latest (Nov 13) IEA OMR, average global oil demand was/is expected to be:
for 2006: 84.7 mb/d
for 2007: 85.7 mb/d (+1.2%)
for 2008: 87.7 mb/d (+2.3%)
11. Therefore, with constant production over the 3 years, if a 1.2% increase in demand caused in 44% increase in price in euros, a 2.3% increase in demand can be expected to cause a 44 x 2.3/1.2 = 84% price increase in euros, to a price in Nov 2008 of EUR 121. Assuming EURUSD stays at 1.48, that’s $180. (Realistically, it is very unlikely that stocks experience such big drawdowns during 2008 as to meet all of the projected demand. Rather, the estimated price can be reasonably thought of as that needed for causing the amount of demand destruction that will allow stocks to remain at acceptable levels.)
Re the USD (part 2) and the US economy.
12. However, the EURUSD = 1.48 (and consequent WTI = $180) assumption in point 11. may not be realistic for the following reasons:
a. If US oil and petroleum products imports remain constant, an 84% increase in the oil price can be expected to cause the US trade deficit to worsen, which in turn can be expected to cause a further fall in the dollar (as per points 1. and 2.).
b. An 84% oil price rise will greatly increase the current account surplus of oil exporters and as a result their foreign exchange reserves, very likely to the point of compelling them to at last unpeg their currencies from the dollar and further diversify their foreign exchange reserves from it.
c. Moreover, the $200+ oil price expected to result from factors a. and b. can in turn be expected to increase the pressure for oil exporters to start pricing and trading their resource in other currency/ies, thus adding further downward pressure to the dollar and conceivably taking it to its “Wily E. Coyote moment”.
13. In assessing the impact of a doubling of the oil price on the US economy, (neo)classical economic analysis can be expected to point out that the share of energy in US GDP is still low. Recent oil price action, however, shows how easy it is for the oil price to double, and a doubling here, a doubling there, and pretty soon you’re talking about real share. Therefore a $200+ oil price (which BTW assumes peace and love between the US and Iran) can be reasonably expected to add significant inflationary pressures in the US. If, however, the US Federal Reserve adjusts its monetary policy REACTING to those inflationary pressures once they are manifest, it is very likely that by then the dollar will have already lost a substantial part of its international trade and reserve currency status.
Conclusion:
The currently expected oil supply and demand situation for 2008 portends at least a doubling in the dollar oil price and poses a significant risk of triggering the much-feared collapse in the dollar value. The only alternative is a significant “endogenous” (i.e. not due to higher oil prices) reduction in oil consumption in the main consumers (US, Europe and China, in that order). Which in turn can be reasonably expected to occur only as a result of a US-led OECD recession (causing a Chinese deceleration of economic growth). A new Fed monetary policy focused on the preservation of the dollar value for international transactions through checking its global supply growth can do the trick.
If the ECB does not have the nerve to follow a similar path, and issues whatever amounts of euros are needed e.g. to prevent any bank from falling, that will lay to rest the expectations of the euro challenging the dollar status as the main international trade and reserve currency.