Last weekend I attended an excellent conference on business cycles hosted by UC Riverside (program details here). Among the many interesting presentations was an update from University of Maryland Professor Boragan Aruoba on the index of current business conditions that he developed with Professor Frank Diebold of the University of Pennsylvania and Federal Reserve economist Chiara Scotti.
The idea behind the Aruoba-Diebold-Scotti index is to use data as it arrives from various sources to update an impression of the overall level of U.S. economic activity. I earlier described a similar effort for interpreting European data by Gabriel Perez-Quiros and Maximo Camacho. Though both approaches use a state-space framework, the details are a bit different, with ADS taking the perspective that there is an underlying “daily” level of economic activity whose status evolves slowly over time. The basic idea behind either specification is that, given the previous assessment of where the economy seemed to be as of our last available data reading, and given those slowly evolving dynamics, one would have had a prediction for what the next available indicator would show. If that new datum, when reported, is more favorable than expected, the inferred level of economic activity is revised slightly upward, while if less favorable, the inferred index is revised slightly downward. The ADS index makes use of quarterly data for real GDP growth, monthly data for payroll employment, industrial production, personal income less transfer payments, and manufacturing and trade sales, and the weekly initial unemployment claims that I highlighted last week.
Here’s what the output of that inference looks like when applied to data since 1960. Values of the index below zero indicate slower than normal growth, whereas values above zero correspond to above average growth. Shaded regions on the diagram represent the dates of U.S. recessions, as determined by the NBER Business Cycle Dating Committee.
 |
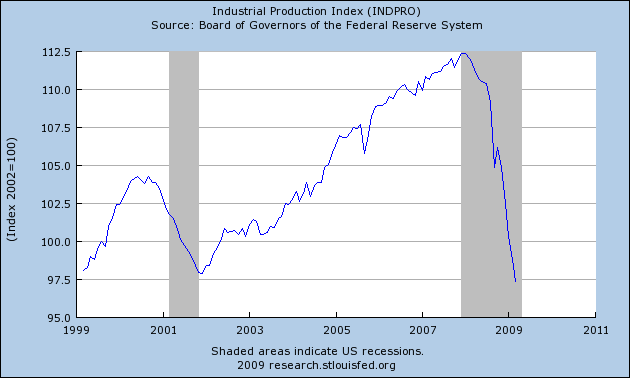
One of the things that I learned from Boragan at the UCR conference was that the Federal Reserve Bank of Philadelphia is now updating the ADS index with each new data release and is reporting those updates on a useful webpage. Thus for example, the Federal Reserve reported today that the index of industrial production fell by 1.5% between February and March, giving it a cumulative first-quarter decline of 20.0% at an annual rate.
 |
The industrial production numbers were released at 9:30 a.m. EDT, and by 10:30, the Philadelphia Fed website had the new implied economic assessments. The new data led the model to a slightly more pessimistic assessment of where the economy stood in mid February, for example, causing a decline in the February 16 value from a previous estimate of -3.24 to a new assessment of -3.32. The downward revisions to the most recent inferences were barely noticeable.
 |
Does the fact that the index is on its way up from the low point give us reason to believe that the worst of the downturn is now behind us? The answer is, not necessarily. A key aspect of any model like this is the presumed underlying dynamics that govern where you expect the economy to be before you receive a new observation. Those dynamics imply a significant degree of mean reversion, i.e., imply that a -5% annual growth rate for real GDP is not going to persist. That’s not so much an assumption on the part of the researchers as an implication of the data. Any process you fit to the observed data will have some degree of that mean reversion property, because the fact is, historically -5% real GDP growth rates just weren’t something we saw sustained for a long episode, at least for the sample period to which this model was fit. Given that the index is now so far below the mean of zero, the unconditional forecasts are always going to be headed back up. Perhaps a more meaningful signal of a real improvement would come when the index gets back up above -1% or so.
Although I wouldn’t want to read too much into it, I find it helpful to have this convenient quantitative summary of how each day’s economic news might alter an objective assessment of where the economy currently stands.
Technorati Tags: recession,
economics,
macroeconomics
I’ve looked at the past history of the ADS index. A reasonable interpretation of it, I think is that as long as it is below zero, unemployment is rising. So if the ADS index is rising, we’ve hit an inflection point, not a local minimum. I put together a small deck of slides comparing this episode to past episodes that I can send if you’re curious.
What I think it interesting is that almost every recession in the past has displayed the double dip that you see in the current recession. The 1991 and 2001 recessions were different, though.
According to the ADS index, this recession isn’t much worse than 1973. In terms of length, though, it’s going to be abnormally long.
In response to Ian’s comments:
Your interpretation of the index is absolutely correct. Roughly speaking, a negative value of the index shows business conditions are worsening. The fact that the index is increasing (but still negative) does not mean we reached the bottom and that things are getting better, but that things are getting worse at a slower rate.
About the double dip, we need to be careful. A big part of the first large dip we see is due to two hurricanes and a strike in the commercial aircraft industry in September, some of which was reversed in October. I would suggest that users smooth that period and see it as a continuous decline.
One aspect of indices like this that has confused me is, how do they use past data? Do they use the final, revised figures? Or the originally reported figures?
If they are using the final revised figures, they probably shouldn’t be projecting beyond December or January.
Maybe it would be useful if there were two curves given, one of the final data, and then one of the originally reported data.
Ian D.-B.: You wrote: In terms of length, though, it’s going to be abnormally long.
Do you come to that conclusion based on historical ADS index information? Or information gleened elsewhere?
Perhaps you could kindly post your deck of slides to a web-site so those of us in the cheap seats can share?
Bob_in_MA: The inference uses the full historical vintage as currently reported on April 15. Thus you’re exactly right that it is mixing apples (revised data for the historical observations) and oranges (new data for the current inference).
Boragan Aruoba has actually been a leading researcher in thinking about how to handle these differences between real-time and revised data. He and I discussed some possibilities for trying to do something like that with the index but at the moment it is simply using the full sample of data as currently reported.
Second Bob_in_MA: Is there a real-time version of the index? Thanks.
To Bob_in_MA and evropeec: Producing the Index with only initial announcements (which is what I take you to mean by real-time version) would require vintage data for all of our 6 indicators. Most, if not all, of this data can be constructed using the Real-Time Data Set produced by the Federal Reserve Bank of Philadelphia. We have not yet attempted to produce such an Index.
BA: Forgive me if I am not following – so you do not, for example, keep a state variable for data that is typically revised that indicates something like?
State 1: no quarterly GDP data received
State 2: first release of quarterly GDP data received
State 3: second release of quarterly GDP data received
State 4: final release received
Nice index. Useful to have.
We should now track the ‘Hamilton index’, notably, the period of time between the appearance of the index here and the first time I see it used at a non-economics conference.
To Robert Bell: Short answer is no. All 6 of our indicators are revised and this happens many times (much more than 4 — up to 14 quarters for GDP). Taking care of all this possible revisions would require introducing these revisions explicitly as random variables in the system and you will appreciate that this will blow up the size of the system. This would be in addition to the issue about collecting vintage data for all indicators I mentioned above.
in reference to another Diebold- would it be possible to come up with an accurate near real-time indicator with data from ATM manufacturer Diebold Inc. using number of transactions and transaction size?
What are the components of the index and how its calculated. Are the components weighted in some way i.e. some more important than others?