Michael Dueker is Head Economist for North America at Russell Investments and a member of the Blue Chip forecasting panel. In February of 2008 he warned Econbrowser readers that it appeared unlikely that the economy was going to escape the slowdown without a recession. In December of 2008, he predicted in this forum that the recession would last until July or August of 2009, but that employment growth would not resume until March of 2010.
With that track record, we were very interested to learn the latest macroeconomic predictions stemming from Russell’s Business Cycle Index, subject to the disclaimer that the content
does not constitute investment advice or projections of the stock market or any specific investment.
Current business cycle estimates suggest the economy was out of recession by August 2009; an anemic recovery and a false threat of a double dip await
Starting this month, Russell Investments has adopted this business cycle measure as the Russell Business Cycle Index (BCI) and will post updated estimates of the Russell BCI and forecasts on the Helping Advisors site at Russell Investments. A real-time history of the business cycle index and its forecasts will be available in a spreadsheet.
For now, we can evaluate past performance of the business cycle model by noting that December’s forecast of a July or August 2009 trough on Econbrowser appears to have been correct and by examining last December’s forecasts of payroll employment. The figure below shows the path of payroll employment changes predicted by the Qual VAR model in the forecast posted on Econbrowser in early December 2008 along with the actual data since then. To date the actual pattern of job losses matches the forecast from December 2008 quite closely. In particular, the forecast last December was that the economy would lose about 4.9 million jobs between December 2008 and August 2009, whereas the data to date show a loss of about 4.5 million jobs.
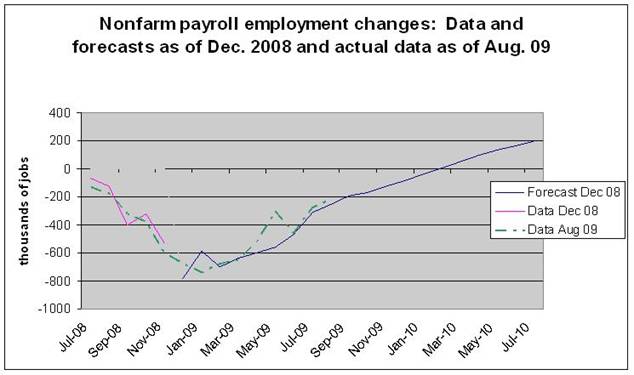 |
Nevertheless, the job losses projected last December for the period September 2009 to March 2010 might be smaller than anticipated earlier. We examine this question with a chart of a current employment forecast below.
One attribute of the Qual VAR approach is that, during periods when the NBER classification is well-established, one can use those classifications to determine the sign of the business cycle index. For recent observations that belong to a period where the eventual NBER classification is not yet clear, the model can be run without imposing a sign and the data can speak regarding the yes/no recession classification. Starting with the June 2009 data, we stopped imposing a negative sign on the business cycle index and let the data determine it. As of the August 2009 data, the first month where the probability that the business cycle index went below 50 percent was August. This result is the basis for our call that the economy was out of recession by August 2009.
One key point of discussion at present is whether the economy faces a danger of sliding back into recession for the second part of a double-dip recession. The business cycle index and its accompanying payroll employment forecasts can help assess the risk of a double-dip recession.
The chart of the business cycle index below illustrates that some backsliding in business cycle conditions is projected early in 2010.
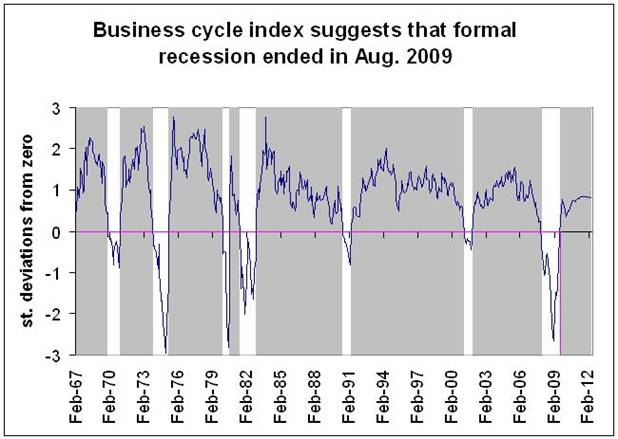 |
The history of the business cycle index illustrates the so-called Great Moderation in the U.S. economy after 1984. Until the current recession, the business cycle index stayed within a comparatively narrow range between -0.5 and 1.5 standard deviations from zero after 1984. The depth of the 2008-09 recession poses a strong counterargument to the Great Moderation hypothesis, however. The business cycle index also illustrates how some economic expansions were sufficiently strong and sustained to bring the unemployment rate down to low levels, such as 3.8 percent by April 2000 and 4.4 percent by October 2006.
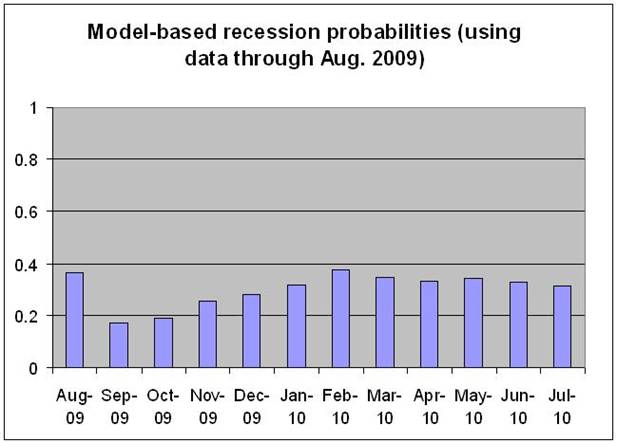
To see if the projected backsliding in business cycle conditions in early 2010 represents a serious threat of a double-dip recession, we can look at the forecasted recession probabilities for future months. The chart below shows that the recession probabilities do not reach the threshold between 40 and 50 percent where we would call a double-dip recession.
 |
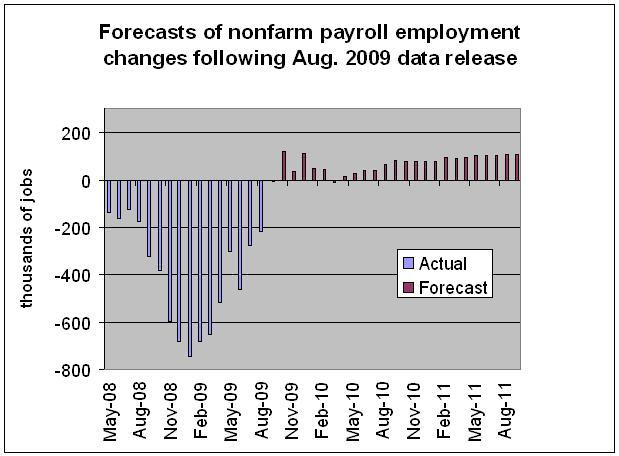
The current employment forecast shows some promising job gains between October and December 2009 and then some backsliding, with a small negative forecast for March 2010. If this occurs, there will be discussion about the possibility of a double-dip recession, although that is not the scenario projected here. Instead of a double-dip recession, the forecast presented here is one where it takes a long time for the economy to achieve consistent triple-digit job gains, which are not expected until 2011.
 |
Thanks for this very useful piece. I look forward to seeing a future posting with evaluation of this forecast.
This would be a lot more interesting, and useful, if we were shown the model’s projections in the Fall of 2007 for the next 24 months.
One point stands out, the model (like nearly all other economic models) ignores debt levels. If you look at the variables, they would be no different if household debt levels were 65% of disposable personal income, as they were in 1975-80, or 130%, as they are today.
That very rapid recovery may well happen, but if it does, it will be because overall debt levels will beeven higher and I will be firmly in Marc Faber’s camp, because the next credit event will have all sectors, including the Treasury, severely over-leveraged.
Do these models assume our economy can manage ever-increasing debt levels in perpetuity? Is deleveraging just something that happens to other economies, or in the olden days?
Economic models have proven themselves to be useless predictors of the future. They simply don’t work. Try chicken entrails.
there will be no recovery.
http://seekingalpha.com/article/160619-the-coming-consequences-of-banking-fraud?source=article_sb_popular
It would be important to know some of the assumptions of this forecast. In particular, will the Fed resume Quantitative Easing purchases of Treasuries and MBS after January? What about WalkAways by homeowners with negative equity? What about extension of jobless benefits as the unemployed exhaust their benefits? What about another round of fiscal stimulus? (After all, 2010 is an election year and the economy will probably be the top issue.)
To Bob_in_MA:
Who cares about Faber? He’s been saying the same stuff since the 1980s. He makes a living from writing newsletters.
To John Smith:
Econbrowser is an academic blog of the highest order. Please don’t sully this place with comments that rightly belong elsewhere. If you can’t participate in an intelligent discussion, kindly take leave.
To the inevitable:
Yeah, you are helpful. Not. There is so much data in the article you linked to. Not.
Bob_in_MA
The only thing that matters as you pointed out is the relative Debt to GDP ratios (total, private, public, etc.).
That is entirely dependent on economic growth and inflation, which means that the economy can handle it as long as nominal GDP grows fast enough.
If Bernanke was willing to raise the inflation target to near 4% till 2020, the US would easily be able to devalue the debt by approximately 50% and it’d be easily manageable, since nominal GDP growth would average 6%.
Anonymous @9:16
Inflating away debt, which is another persons asset, is theft by another name. The resulting tax on earning which have decreased in real terms adds insult to injury.
Rob
That’s usually what happens after a financial crisis though. It doesn’t make sense to leave a debt burden of 130% on the private sector; you’re better away wiping out a lot of that over a few tough years, and then normalizing prices.
Sure it’s a “tax,” but the alternative is Japan or Italy, which have continually swelling debts in every sector of the society except the wealthy and elderly.
The fact of the matter is that the US did not have this kind of absurd debt inflated growth until the supply side tax cuts of the 80s.
The other problem is that the US is continually having credit put into the economy by foreign governments through dollar pegging and the like. We need to end the cycle of excess credit in the US by running inflation at 4% or so for several years, until Americans are willing to live within their means and finance their own debts.
Even if this fairly optimistic forecast pans out, we’re looking at nonfarm employment growth of 100K jobs per month well into 2011. Since it takes 140K+ jobs per month to keep up with population growth, unemployment is likely to remain very high.
I, too, wonder if the model captures the effects of foreclosures, deleveraging, and the untouched pile of toxic assets still on the books of major banks.
Anon: “If Bernanke was willing to raise the inflation target to near 4% till 2020, the US would easily be able to devalue the debt by approximately 50%…”
I read a critique of this option (I think on FT Alphaville) and the author of it pointed out that a very large proportion of Treasury debt is on the short end. Inflation at 4% would necessitate short rates of 6%+, mortgages would be in the 7-8% range?
Another problem: it only works if WAGE inflation is 4%. If you achieve 4% headline CPI with a commodity bubble, while wages are fairly stagnant, you will have DECREASED workers’ capacity to carry debt.
Piker, I don’t know, but I’ll guess Faber has done a little better than you since the 1980s. And that was an example of intelligent discourse?
@Anonymous at September 12, 2009 09:16 AM:
“If Bernanke was willing to raise the inflation target to near 4% till 2020, the US would easily be able to devalue the debt by approximately 50% and it’d be easily manageable, since nominal GDP growth would average 6%.”
1. This statement assumes the Fed was able to control inflation rates at its wishes. How are they supposed to do that? Are there any data from the past that support this assumption? It’s a very daring assumption. Wishful thinking?
2. Please could you show how you have come up with these numbers according to which a 4% inflation rate and a real GDP growth of 6% were sufficient to bring down debt levels by 50% (over what time frame?). Or did you just make this up?
Thanks.
rc
@All:
My 40 trillion dollar question to you is, can there be self-sustaining economic growth and significant deleveraging of private debt at the same time?
Another question:
The probable GDP growth in Q3 2009 and following quarters will essentially be induced by an increase in public debt levels. The same is going on in the other major economies in the world. To what degree and for how long will it be possible to compensate private deleveraging that drags down GDP, by public debt growth? To what public debt levels will it go? 200% of GDP, about Japan’s current public debt level, or more?
rc
“My 40 trillion dollar question to you is, can there be self-sustaining economic growth and significant de-leveraging of private debt at the same time?”
In a 70% consumption economy, with structural trade and fiscal deficits, I’d put the chances near nil.
My economic forecast is the USG keeps doing what it has been doing; stimulus, QE and buying the mortgage market, until we get stagflation-lite. This will probably occur about the same time that banks and consumers have de-leveraged back to their comfort zone. Demographics will have something to do with this, because we will probably need yuppie echo-boomers to take up the slack from boomers in retirement savings shock.
I agree that the Fed cannot make inflation go up that easily. They use interest rates to encourage lending and therefore consumption, we don’t really do helicopter drops of money(well, ok, we do tax rebates), but we know banks and consumers don’t feel in the mood for that game at the moment. But, on the other hand, the US economy is suseptable to outside forces as well from commodity inflation or import inflation. Those are very different than the 70s wage-price spiral.
Of course if we just let everyone default on credit cards and mortgages, then we have cleared the debt overhang on individuals, and then of course the USG will have to save the lending institutions and put the bill on the public debt.
Then we can start a new credit growth cycle over again. Personally, I don’t like this solution because that makes me the one paying for everyone’s stuff, and if I wanted to do that, I could stick my head out the window and shout “Got any bills? I’m buying!”. Don’t need the world’s largest government to do that for me.
Also, one of my standard factoids in blog posts is that the Treasury debt has a duration of 4 years now. I haven’t told this to anyone yet, but I go into hysterical giggles whenever I read someone saying “we can inflate out of the debt”. Default, maybe, dollar crisis, more likely, but inflate out of it?…NOT. With the USG having to roll over $7 Trillion in debt now over a 4 year period, and also add a trillion a year in new debt, who do you think will be dumb enough to go for the losing side of the deal?
But in spite of the long term danger of increasing government debt,(maybe all OECD countries go to 200% debt/GDP?), I think that’s what will happen until something gives, or we just level out at a sustainable GDP and be happy with that. Maybe 177 million employed out of a total population of 300 million is too much employment.
Bob_in_MA
Haven’t we done that already though? From 1998 to 2008, median wages went down in real terms, from $51k to $50k according to the latest Census data.
How can we categorize the past decade as anything other than a “lost decade” in hindsight; we saw wages stagnate during a debt induced GDP boom from the supply side (a fairly weak GDP boom as well considering GDP only went up around 15-20% over that time period).
I believe that there is a way to achieve headline 4% wage inflation by looking at the late 70s as a model. Yes the growth wasn’t ideal during that period of time, but a short period of 1-2% real growth with 4% inflation for say 2010-2020 followed by 2.5-3% growth with 2% inflation from 2020 on is far better than not devaluing the debt through monetization and having 1.5-2% growth with low inflation for a much longer period of time. The key would be to prevent it from spiraling out of control as happened in the late 70s.
I would argue that a quick, short term default through monetization is ideal, preferably before any of our creditors can become fully independent absent creating their own debt fueled booms (i.e. China). I realize that this is mercantilist, but they fueled this credit boom by artificially pacing their currencies, I don’t see why we can’t just ease our way out of it.
rc
The problem is that it looks as if the US will go the way of Japan no matter what we do unless we create another bubble to reinflate the economy. Increasing public leverage as a substitute for private leverage makes sense for the next 2-3 years, but after that we have to come to terms with the fact that the economy will have to grow on its own through consumption growth and investment growth. As the Japanese example shows, they didn’t really have much growth after cutting their programs loose, they achieved GDP growth through public spending but there was very little private investment growth.
The main difference though between the US and Japan is that the deleveraging in Japan happened on the private corporate side, whereas the opposite is true in the US where the US private consumer is deleveraging.
The advantage that the US then has would probably be private business balance sheets are fine, whereas Japan’s banks were bailing out continually failed firms.
Also, a possible weakness to the US is that we won’t really be able to pursue Japan’s or Germany’s export strategy since our manufacturing sector is much smaller than other similar economies (10% US, 15% Britain, 20% Germany)…
Models are only as good as the data used to build / test them. When did we last see nearly 17% U6 unemployment, falling home prices, lesser hope for an export-driven growth because of a global recession AND a deleveraging consumer? Isn’t your analysis based on the extrapolation of a linear model?
Reduction in consumer credit in the U.S. is the latest “new information” to be reported. I do not see how that reality is picked up by the following variables:
“The particular data used in the estimation of the model are personal consumption expenditures, CPI inflation, the slope of the yield curve, the spread between 3-month commercial paper and Treasury bills, the spread between Baa and Aaa corporate bond yields and nonfarm payroll employment”.
The comments suggest a slowdown in economic growth, IF consumer deleveraging continues and public subsidies stop.
We need to begin now to gradually reduce government transfers to the private sector.
Obama is not reforming the financial sector and he is not proposing reform of the health sector in a way that will produce cost savings.
Anon: “I believe that there is a way to achieve headline 4% wage inflation by looking at the late 70s as a model.”
That presupposes that some plan that could reconstruct that “model.” That didn’t work so well for Japan and they had the advantage of growing demand elsewhere in the world.
How do you create 4% wage inflation with industrial production at 68% of capacity, not just here, but around the world? We still have close to a million units of excess inventory in homes.
“The advantage that the US then has would probably be private business balance sheets are fine….”
umm, SOME private balance sheets are fine. But then there are predictions $1T in commercial real estate loans likely to be in trouble. And the junk bond market is an order of magnitude larger than in the 1970s, or in 1989 Japan.
I believe the Fed can create a commodity bubble, and possibly a dollar crisis, both of which will lead to price inflation.
But I think creating 4% wage inflation is a pipe dream.
Anon, you are still talking about theft, though a nice fancy way of employing it that most people don’t notice. If you haven’t already noticed, the Fed is already employing QE in both bonds, notes and MBS.
Cedric,
Thanks for your comments (miss the Setser blog), best way to protect against currency crisis is what, hold other govt debt (including currency)?
The other “variable” not picked up is whatever our response to global warming may be. Under the Obama admin, it looks like the greenies are getting some undeserved influence. Yucca Mountain was just effectively killed. Wind, Solar, and “Cap and Trade” are the buzz words that are bandied about as “solutions”. All are based on very bad science, poor economic analysis, and grossly misleading hype. “Cap and Trade” is also counted as a $800B tax revenue source in the 10 year budget.
I took alt energy courses back in college, post Arab oil embargo, and have been researching it the past 5 years looking for investments. Sorry to say it hasn’t been good hunting, if efficacy is your goal, tho trading profit opportunities did happen.
But we are going down the same path as we briefly did with the “Hydrogen Economy” and corn ethanol, before getting the rude awakening that these approaches did not solve the problem they were intended to solve.
Most people don’t fully appreciate how difficult it is to do away with CO2. The way things are headed now, I can add to my economic prediction that the lights go out sometime in the next ten years, and we will still be paying very,very high electric bills for the lights on days we still enjoy. California and Nevada will lead the way.
The way we get their is charted already. We have crawled out on the limb and sawed the branch off behind us already. In 2006 the Supreme Court ruled that CO2 is dangerous to your health. The EPA, under prodding by the Sierra Club, got 87 coal projects cancelled that utilities had in the early planning stage. These would be replacing existing plants that get retired after their 40 year design life. People that have evaluated wind and solar objectively say we might get as much as 10% of our generation capacity from these sources, but at a very high price. Besides cost, the other big problem is the intermittent nature of the supply. It needs to be backed up 100% by conventional power plants if we expect to have demand met, 24X7X365.
Coal is bad if we say CO2 is bad. EPA data says 35% of total CO2 emissions in the US come from coal power plants. Another 35% from cars and light trucks. That leaves 30% for everything else, and we aim to find it with “Cap and Trade”.
But there is a sizable gap in electric supply shaping up, and CO2 is still a problem, if that’s what it is you are worried about.
Hello Rob,
I miss Brad’s blog too. It was so nice having someone chart BOP data you.
I’m not sure there is a “good” way to protect against a dollar crisis. If you win, it’s taxable for one thing. I’ve decided a global sovereign bond fund is the least worst way. Gold is another, but it doesn’t pay interest and I can never tell if it’s overpriced or not. Same for oil and other commodities.
But it’s important to pick countries that won’t have a bond or currency crisis before the US does. For that I rely on Mike Hasenstab at Templeton Global Bond Fund. He’s got one of the top track records and did his PhD work in currency movements. He’s not perfect, but about as good as they get.
Franklin Templeton has a retail version of the fund with high fees and a front end load. Much better way is to get the Advisor Class, symbol TGBAX. Ameritrade sells it with $50k initial min and only a $50 dollar commission. There is not a load charge and management fees are half at .8%
Cedric,
w.r.t. inflation, let’s divide things into two parts: non-discretionary and discretionary. The non-discretionary part is inflating very well (government services, health care, utilities, bridge/road tolls etc). The discretionary part (computers, consumer electronics, recorded music etc) is deflating and holding down the over all inflation. However this can’t go on forever since the deflating part will account for increasingly smaller part of the spending. Eventually consumer’s budget will be primarily non-discretionary items.
Housing is a big unknown on CPI and it has quite a large weight.
HZ,
I think of it pretty much that way. I also break it into competitive vs non-competitive industry which sorts out with a lot of overlap to your categories.
But I also think the output gap can close by taking capacity out of the system, and some of that is in China.
The other thing we should see soon is oil was $140 last summer, but rapidly dropped in fall. So far this summer that was making yoy headline CPI look deflationary, but core inflation has still been in positive territory. Now going forward oil will be about the same it was last year, and won’t be depressing headline CPI.
Housing is the wildcard. It’s one where they do a lot of hand waving to come up with the number…equivalent rents. Its NOT rental prices, and its NOT housing prices. We had low inflation during the housing boom, so if the bust makes CPI numbers deflationary, that would be an inconsistency in hand waving.
Also August ISM Price Index jumped a lot which indicates PPI inflation on the way.
Also, I just got around to reading the July trade balance report. Quite a few green shoots to be seen.
http://www.haver.com/COMMENT/090910c.HTM
Interesting thing about housing is that it has both characteristics: we all need shelter so the function of shelter is non-discretionary; we don’t necessarily all need 1000 sq ft per person so size/location/quality etc are quite discretionary. And the range can be quite large: you can go from McMansions to McRentals or even moving back in with your parents.
I particularly like Scott’s points about this being a fairly optimistic forecast, and if the model captures the effects of all the problems that remain. I think it is crucial to understand that the govt has done little if anything to fix the basic structural problems in the economy, of too much debt relative to peoples’ incomes. And it has tried to prevent the normal business cycle from occurring, in which the recession would clear out the excesses in the economy and lead to a more sustainable recovery.
Instead they have tried to solve a debt problem with more debt, which I believe is reckless and dangerous. Unfortunately though those in power are the same people who mismanaged things leading up to the financial crisis.
So in my view, one of the few ways for those of us who understand the severity of the problems is to invest in gold related assets, because gold should continue to benefit from the Fed’s Keynesian efforts to avoid deflation. I recently read some good articles on these topics at http://www.goldalert.com that I think are useful for investors to read. They further discuss the inflationary consequences of all the money printing, as well as the potential impact on the gold, the dollar, and the future of our global economy.
Interest:GDP Growth
Non-dicretionary inflation is spot on.
More risk enters the system.
“With prices rising faster than wages, real hourly earnings fell 0.2% in August, the government said. Real weekly earnings also fell 0.2% in August. Real weekly earnings are up 2.7% in the past year, but have fallen 1.5% since December.
Food prices rose 0.1% in August. Prices of food at home were unchanged, while prices of food away from home rose 0.1%.
Energy prices rose 4.6%, including a 9.1% increase in gasoline prices. Medical care prices rose 0.3%. Apparel prices fell 0.1%.
Prices of commodities rose 0.8% in August, while services prices rose 0.2%. Prices of commodities excluding food and energy fell 0.3%. Education and communication prices rose 0.2%. Recreation prices rose 0.1% “
Thanks for the update. Did Qual VAR forecast the recession? In a response post in August last year Mr Dueker seemed to suggest a signal had not yet been given:
https://econbrowser.com/archives/2008/08/not_exactly_a_b.html#more
Simon,
If you zoom in on the business cycle index in the early part of the recession, you see that the recession was not very deep and the business cycle index was also increasing during the spring and summer of 2008. In the real-time estimates, that movement was taking place much closer to zero. This was a case where the model did better at predicting a recession just ahead of time than it did in recognizing it in the early stages.
Recall also that the 2.8 percent GDP number released for 2008Q2 also led many to conclude that a recession had not started yet.