During the last two years, the Federal Reserve responded to problems in the financial markets through what I have described as monetary policy using the asset side of the Fed’s balance sheet, replacing its traditional holdings of Treasury securities with a variety of new lending programs and alternative assets. I’ve been taking a look at what effect these operations seem to have had on the problems they were designed to address.
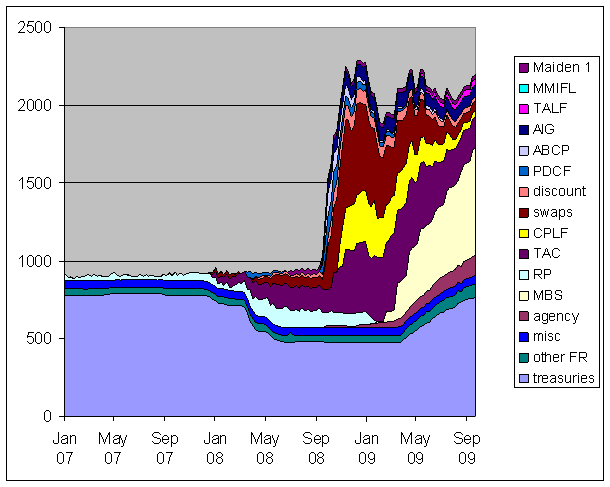 |
Rather than trying to sort out which of the asset-side actions by the Fed were most effective, I was curious to see what conclusions emerge if you just lump all the Fed’s targeted liquidity measures together, as proxied by the difference between the Fed’s total assets and its holding of conventional Treasury securities. Thus for purposes of the discussion below I propose to measure the overall magnitude of targeted liquidity actions by the sum at any given date of everything other than the light blue area in the graph above.
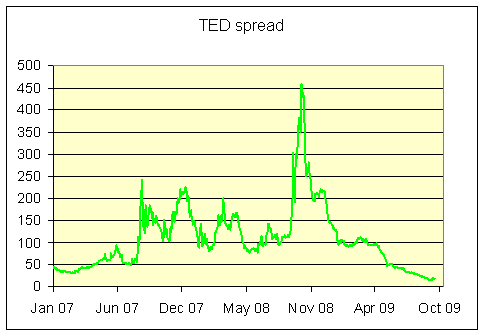
One indicator of the financial stress to which the Fed was responding is the gap between the 3-month LIBOR rate and the 3-month T-bill rate, often described as the TED spread. This spread went through a series of four dramatic waves over the last two years. I looked at each of these four surges in the TED spread as potential case studies for the effects that targeted liquidity actions might have.
 |
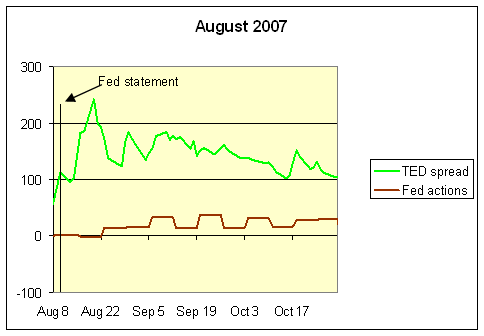
The first episode began with the freezing of BNP Paribus assets on August 9, 2007, subsequent to which the TED spread reached a peak of 242 basis points on August 20. Targeted liquidity operations consisted only of a quite minor and temporary expansion of repos and discount borrowing. The sole special action by the Fed that made it onto the New York Fed’s Financial Turmoil Timeline is an announcement by the Fed on August 10 that it would provide liquidity as needed. It seems safe to conclude that in this case, interest rate spreads rose in spite of the Fed announcement, and eased for reasons other than an increase in the volume of targeted liquidity operations by the Fed.
 |
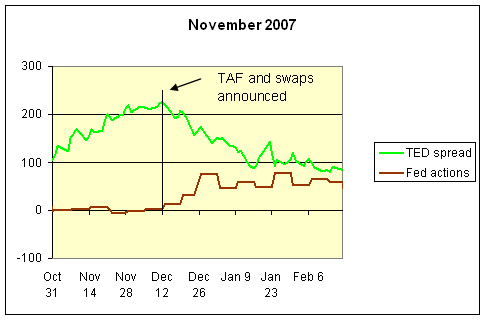
The second episode occurred in the fall of 2007 as problem bank assets became acknowledged. Taylor and Williams pointed to the fact that the TED spread turned down well before targeted liquidity operations were cranked up as evidence that the latter were not the cause of the former. However, Christensen, Lopez and Rudebusch noted that the Fed announced its intention to make aggressive use of the Term Auction Facility and currency swaps on December 12. The TED spread peaked at 225 basis points on December 12, and fell steadily after the Fed’s announcement. This episode could thus be viewed as consistent with the claim that targeted Fed liquidity measures are a potentially powerful tool for changing this interest rate spread, so much so that simply announcing their intended implementation can have dramatic effects.
 |
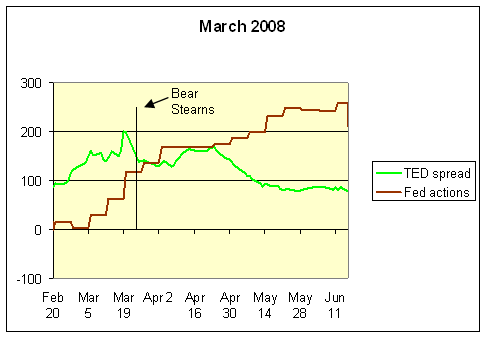
In the spring of 2008, the TED spread exhibited a similar spike. In this case the magnitude of the Fed’s targeted liquidity operations eventually grew to three times the size of what it had implemented in December. The Fed announced its new Primary Dealer Credit Facility on March 16 and also significantly expanded its repo positions and Term Auction Credit over the next several weeks. The TED spread peaked at 200 basis points on March 19. Christensen, Lopez and Rudebusch chose March 24, the date of Bear Stearns’ rescue, as the key turning point, after which risk spreads became significantly lower than their model predicts they otherwise would have been.
 |
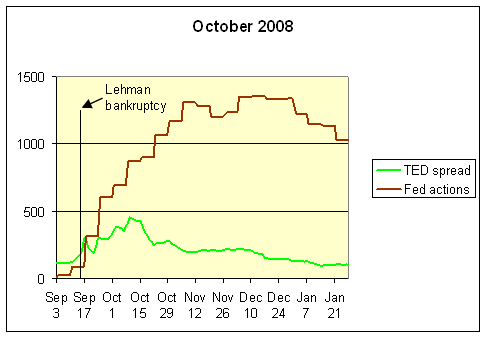
These actions were in turn dwarfed by steps adopted in the fall of 2008; note the scale on the vertical axis in the diagram below is five times as big as that in the previous three graphs. There were so many new Fed measures adopted at this time that it would be hopeless to single out any one. I’ve indicated Lehman’s September 15 filing for bankruptcy as one important reference date on which we could all agree in the diagram below. Targeted Fed liquidity operations increased by $691 billion between September 3 and October 8, despite which the TED spread rose from 114 to 385 basis points and would continue to rise until peaking at 458 basis points on October 10. By November 12 nonstandard Fed assets had expanded by $1312 billion.
 |
To get a sense of the overall connection between targeted liquidity actions and the TED spread over this period, we can look at a scatter plot such as that shown below. Each square in this plot corresponds to a particular week over the period January 10, 2007 through September 16, 2009. The horizontal axis represents the change in targeted liquidity operations over that week, while the vertical axis records the change in the TED spread over that week. If we thought that the correlation between these two variables resulted from the effects of liquidity operations on the spread, we would have expected a negative correlation– when the Fed expands its balance sheet, the intention is to bring the spread down rather than up. In fact the regression line relating the two variables has a positive slope– if the Fed expanded its balance sheet in a given week, the TED spread was more likely to go up rather than down that week, though the slope is statistically indistinguishable from zero.
 |
Of course, the reason that the line slopes up rather than down is that the correlation does not simply reflect the response of the economy to the Fed’s actions. It also results from the response of the Fed to the economy. Specifically, when the TED spread increased, the Fed responded by increasing its targeted liquidity operations. Presumably it is this endogenous response by the Fed that produces the overall positive correlation in the data. This is a familiar problem in interpreting statistical correlations, and unfortunately it is difficult for any method to resolve. All we can say is that, presumably because of this endogeneity of the Fed’s response, a beneficial effect of targeted liquidity operations on credit spreads is not the dominant feature one sees in the data.
Or to put it another way, it’s not that we saw that things got better whenever the Fed expanded its targeted liquidity operations. Instead the most we could claim that if the Fed had not implemented its actions, things would have been much worse.
Professor,
When I read your second sentence I shouted hallelujah. No one in government and very few economists actually look at policies to see if they actually accomplish what the proponents claimed. I printed off your post and was prepared to dig into the analysis. I read through you information and was excited to find all the analysis you did and your clear results.
Finally I got to your last paragraph. Or to put it another way, it’s not that we saw that things got better whenever the Fed expanded its targeted liquidity operations. Instead the most we could claim that if the Fed had not implemented its actions, things would have been much worse. Professor, I wanted to cry. After so much great analysis to fall back on the same old mantra of, “well it didn’t make things better but it could have been worse without it.” Professor, that is a conclusion with absolutely no evidence or support. It is just conjecture.
Please tell me that this was tongue-in-cheek.
Mr. Fox is irrational and it’s because everything he reads is read in context with his hate for Obama. No different here than on the forum he takes part on. Supplysideforum.com
But more importantly, rather than go about the business of destroying all the necessary moves the Obama team make to bring your country back from the verge of depression, why not pull along with the greatest economic minds in your country. It’s a new century professor!
“Instead the most we could claim that if the Fed had not implemented its actions, things would have been much worse.”
Since we were facing a Debt-Deflationary Spiral, isn’t that enough? I think that there’s room for criticism, but I’m also happy that many others were not in charge.
As Burke said:
“… all that wise men ever aim at is to keep things from coming to the worst. Those who expect perfect reformations, either deceive or are deceived miserably.”
When I first looked at the graph, your method was the first thought to cross my mind. However, I wonder about short-term correlation analysis. Simply looking at the first graph and the TED spread spike in November 2008 makes it look to me as though, big picture, the Fed’s actions probably calmed the markets.
Professor Hamilton, I don’t get the conclusion. How can we distinguish between your interpretation, and the interpretation that there’s no effect?
We can all rail against DickF, but it seems to me a legitimate question. A conclusion that depends on interpretation is one that depends on a particular theory, rather the empirical evidence, no?
Even if the Fed did prevent a worse outcome, can we consider this “stimulus”? The essence of stimulative policy is that it “jump starts” some economic dynamic that then runs on its own.
So how do the Fed’s actions measure up in light of this “jump start” requirement? The dollar-for-dollar increase in Excess Reserves of the banking system tells us that the Fed’s balance sheet expansion cannot be considered stimulative. What about ZIRP? Again, the presence of large excess reserves and contracting private credit implies that zero policy rates have not stimulated aggregate demand via the credit mechanism. Some would say the Fed did accomplish targeted industrial policy (i.e. buy lowering mortgage rates), and that is stimulative, but the overall effect is a small one given the bleak prospects for a recovery in housing investment. Lastly, one could argue that “preventing the worst” was stimulative because, insofar as companies cut inventories in expectation of the “worst”, this has now resulted in an inventory restocking “mini-cycle”. That is no doubt positive for the economy in the short term, but whether it is the spark that ignites final demand or business investment is another story.
So let’s agree, for the sake of argument, that the Fed DID prevent a worse outcome. That really has nothing to do with stimulating self-sustaining growth in Aggregate Demand. We may find this point highly relevant once we are through with this inventory mini-cycle. At that point, the Fed may have to decide whether to maintain its current “prevent the worst” policy or engage in a real policy of stimulating aggregate demand.
But in the long term, all short interest rates seemed to go to near zero, and stay there.
Is there some way to give the Fed credit for that?
Plus my gut tells me Ben’s $600B in foreign currency swaps had to do something, since this wasn’t just a US only problem. Other CBs were doing their thing too.
Besides the short term stuff the Fed does doesn’t bother me much. It’s the 1.75 trillion in QE they did. That was done in the open market trying to manipulate rates in a 11 trillion mortgage market and 7 trillion treasury market. That seems rather futile, and sooner or later they have to get the “liquidity” back somehow, which could be rather expensive.
Plus commercial real estate is on the way. By the time Ben gets some shopping malls and real estate on the Fed balance sheet he will be ready to declare statehood. Or maybe something like Vatican City. I always hear Fed independance is important.
Here it comes. Think about this in the context of the current run up in the price of gold.
http://www.nypost.com/p/news/business/dollar_loses_reserve_status_to_yen_hFyfwvpBW1YYLykSJwTTEL;jsessionid=65E301CF47ED50D15170F8D6530791C5
Dollar loses reserve status to yen & euro
Excerpt:
Over the last three months, banks put 63 percent of their new cash into euros and yen — not the greenbacks — a nearly complete reversal of the dollar’s onetime dominance for reserves, according to Barclays Capital. The dollar’s share of new cash in the central banks was down to 37 percent — compared with two-thirds a decade ago.
Bernanke could go down in economic history as the man who killed the greenback on the operating table.
Liquidity ops for the sole purpose of trying to hide the element of fraud behind through honouring of particular sets of contracts called financial instruments did not and still does not strike me as a legitimate policy goal, may that have prevented the worst or not. You might see the above point emerge as this trap door shuts on both Fed and the Treasury. Trying to macro plaster these micro events onto some wrong headed graphs does also not offer any particular help/insight in the above-mentioned state of affairs.
…so, despite your totally off the wall last sentence, your analysis suggests that the Fed’s various asset initiatives ultimately did not improve our economic condition–and may even have worsened the contemporaneous situation. No?
What will be more important is the longer term impacts of the Fed’s actions, and I can’t think of a set of longer term economic indicators that one can link to the Fed’s actions.
Indeed, using the style of conjecture reflected in the last sentence of this piece, one can conjecture that the Fed’s action will have more adverse effects on the US and global economy than if it hadn’t done anything at all through inflation, currency devaluation, greater current account deficits, etc. That’s as valid as your conjecture to the contrary.
Folks,
I have an internet stalker, who has posted here as “Michael Gray.” He is now following me around the internet. Because of that I will cease posting as DickF. I will continue to enter the discussion, but it will be with various aliases so that I can avoid the stalker as much as possible.
My stalker has also attacked others on another site so I want to act quickly. I do not want him to ruin the discussion for those of you on this site who are serious economists.
He started stalking me on another site. If I assume an alias on that site it will disrupt discussion, so we have been blocking his access but he continues to work around the blocks to disrupt us. Hopefully this will end his disruption here quickly.
Please do not respond to him. He feeds on recognition especially if it is negative and I would not want him latching onto anyone else.
He really needs to get a life. I simply don’t understand why there are people who find enjoyment in making others uncomfortable. I do not understand how someone enjoys pushing in where he is not welcome and seems to thrive on annoying others.
This is my first stalker, but I have friends who have faced stalkers in the real world. Stalkers exhibit a level of insanity and an inability to reason. I do not know how dangerous he is. My only hope is that he does not act this out physically with others in his own community.
The international money markets (the loans and borrowings between banks were frozen) as the trust and confidence among them was based on mutual suspiscion.
It is worth noting that those inter banks loans are of substantial amounts multiple of ten million bearing very little margins (slim reward)when everything is remaining the same.
Could the gap between the 3-month LIBOR rate and the 3-month T-bill rate,be the mere reflexion of Fed the time lag of intervention?
You make a very good point on the Dec. 12 2007 TED spread peak coinciding with the Fed announcement.
However, I think your analysis of the fall 2008 period was too focused on a hunt for evidence of similar immediate impacts from Fed policy changes, which you didn’t find. I have to agree with DickF that your suggested explanation of why you didn’t find it is pure empty conjecture. Better to simply say the slope was statistically indistinguishable from zero, the chart shows no conclusive relationship of any kind between the x and y axes, and leave it at that.
Which isn’t surprsing. The Dec 12 2007 Fed announcement was very big relative to the market’s (very underestimated) perception of the scale of the problems. By fall 2008 everybody knew the whole financial system was insolvent, so even the much bigger policy changes that the Fed announced and enacted during that period could not be expected to have the same immediate calming effect.
I’m sure the Fed’s and Treasury’s actions resulted in lower TED spreads than if they had done nothing. I find it hard to imagine how anyone could disagree. They were not only injecting liquidity, they were also bailing out specific institutions, directly addressing the market’s counterparty solvency concerns that had caused the TED spread to widen.
But recessions and crises are a natural healing and re-alignment process, and we interfere with those processes at the risk of preventing or delaying real healing and re-alignment. I think the Fed and Treasury needed to react, but in more thoughtful ways. They bailed out too many sloppy speculators, and injected too much liquidity, which will encourage even sloppier speculation.
I know it’s terribly unpopular these days, but I’m sticking to the classical view that the US became the world’s foremost economy in large part through generations of brave and careful speculation. By speculation I mean any kind of action based on one’s estimation of what the future could look like, from building the right product to buying the right asset. We won’t get anywhere with the sort of cavalier and careless speculation that people engage in when they expect to be bailed out if they fail.
Seems to me that before 2008, the Fed was “behind the curve” while in 2008 the Fed was trying to anticipate looming problems. So I think what we see here is a Fed implementing remedial actions ahead of the crises. Then the crisis hits. It’s like boarding up your house before a hurricane, then when the storm hits and does damage, the statistician claims the boards didn’t help because there’s a positive correlation between boarding a house and storm damage.
It is possible that things would have been worse without these Fed actions, but the evidence I’ve seen certainly does not prove it. In kindness to that view, let me mention that announcement effects may very well led to changes in TED Spread before the full action was completed by the Fed, so there may be more of an effect than we are seeing in the charts.
Jolly Rancher, I think your analogy misses the point. In the hurricane analogy, the causal connections (e.g. between storm and damage, or between sealing windows and keeping wind & rain out) are quite well established.
In the case of Fed policy, causal connections are complex, and exactly what are in dispute. An empirical test is conducted to sort these things out. But the result, which would seem to show no effect, is claimed to be a positive result supporting the hypothesis; but the “positive” result depends entirely on interpretation, i.e. reference to the hypothesized causal connections. This is no longer an empirical test, IMO.
One thing I noticed is that the TED spread is now approaching zero where it was running at about 50 basis points before “Paulson’s Panic”. I see this as evidence that confidence in our 3-month T-bill has eroded to the point that the TED spread may not tell us what it used to. As confidence continues to fall, might we see a negative spread indicating that there is more confidence loaning to European banks than loaning to our government? We also lost trillions of dollars of wealth, which should concern anyone analyzing the situation. If we cannot show that the policies did any good and there is visible damage to our economic future, I would consider government policies through this crisis as a failed experiment.
Professor – The TED spread in a given reflects bond market risk expectations, which are based on many more factors than what the Fed did that particular week. To the extent that the Fed’s actions do affect risk calculations, I suspect this effect would be somewhat delayed. Have you tried plotting the last chart with a time offset between Fed actions and TED spread? Have you considered using a chart type that shows the temporal relationship between the scatter points?