Travis Berge and Oscar Jorda of the University of California, Davis have an interesting new paper on statistical criteria for distinguishing economic expansions from recessions.
Berge and Jorda evaluate rules of the form that would declare the economy to be in a recession when some indicator Yt falls below a specified threshold c, for example, saying that the economy is in a recession whenever GDP growth comes in below -0.6%. For any choice of the threshold c, there is some observed fraction of observations for which the economy wasn’t in a recession and yet Yt was less than c (the false positive rate), and a fraction of the time when the economy was in a recession and Yt was less than c (the true positive rate). By choosing a lower value for c, there will be fewer false positives and fewer true positives.
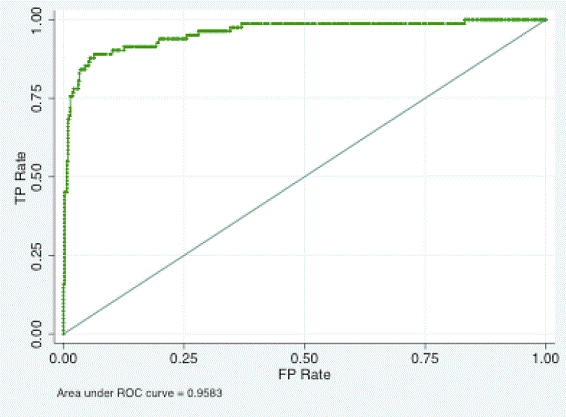
The receiver operating characteristics curve plots the false positive rate on the horizontal axis and the true positive rate on the vertical axis, moving along the curve by specifying alternative possible values for c. For example, here’s Berge and Jorda’s estimate of the ROC for Yt corresponding to the Chicago Fed National Activity Index. The greater the area under the ROC, the more useful that indicator Yt would be for identifying recessions.
 |
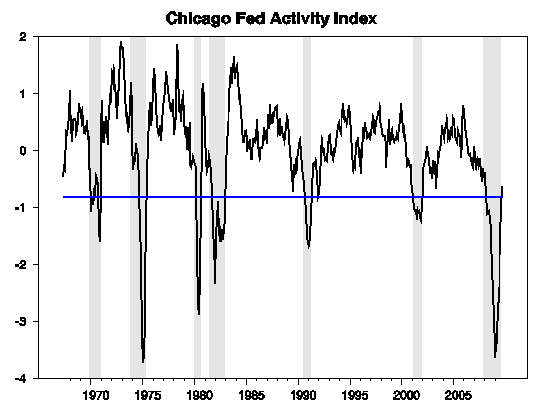
Berge and Jorda evaluate a number of possible indicator series Yt that one might use for this purpose, and find that the Chicago Fed index is one of the best. If you put equal weight on the two kinds of errors you can make with this measure (declaring a false positive versus missing a true positive), Berge and Jorda calculate you’d use an optimal threshold of c = -0.82, that is, declare the economy to be in a recession whenever the Chicago Fed index falls below -0.82. The figure below plots the values for the Chicago Fed index, with shaded regions corresponding to recessions as dated by the NBER. On the basis of this indicator, Berge and Jorda would say that the U.S. recovery began in September, for which the index came in at -0.69, its first reading above -0.82.
 |
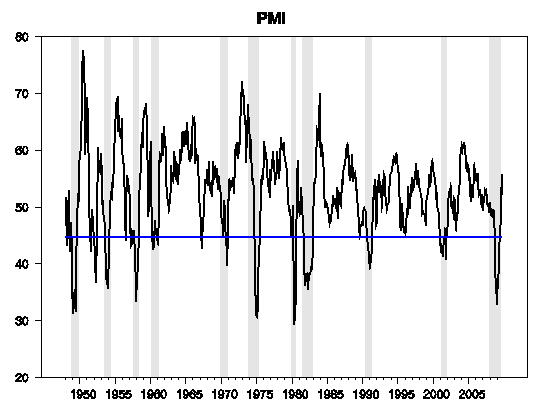
Another indicator that comes out well on the basis of the area under the ROC is the ISM Manufacturing PMI Composite Index, for which Berge and Jorda propose a threshold of c = 44.7. Note that this is below the Yt = 50 reading at which as many managers are reporting improvement as report deterioration– things need to be getting significantly worse before it would be characterized as a recession. By this indicator, the recovery began in July.
 |
So, with much work and some decent math we may achieve 20/20 hindsight. Well done, econometricians!
A teacher in Spain is in trouble for teaching pre-teens how to pleasure themselves. Apart from the fact that monkeys are born knowing this, such teaching might be of value here for geeky young math students with a tendancy towards the study of economics. Give them something else to, um, work on.
Can we build a model with these two variables to achieve a better ROC? I am sure we can.
With what appears to be a 100% correlation with the current method of labeling recessions, I fail to see the benefit. Perhaps more timely?
Right, 17+% of the work force is unemployed, under-employed, or just plain fed up. Those employed in manufacturing are working fewer hours, and lots of folks in many professions have not had a pay increase in a while. And the recession is over. Its over!
Dear Jim,
Thank you for the very nice post on our paper. And thank you for the comments others have submitted. Here is some further explanation of what we do in the paper.
If the same observation of quarterly GDP growth of 1% is sometimes observed in periods classified as an “expansion” but other times in periods classified as a “recession,” then the notion that we implicitly entertain is that the classification expansion/recession does not refer to a mechanical record of periods of positive/negative growth (such as the two quarters of negative growth rule used by the media to determine the onset of a recession). Rather, it must refer to some underlying features of the economy that make it behave differently in expansions and in recessions. A 1% GDP growth observed in one quarter may be due to “bad luck” (a weather event that temporarily disrupts production of oil, for example) or it may be a typical observation in a recessionary period. In the former case we would not expect the government to enact major stimulative fiscal policy but we may in the second case.
The dating of recessions by the NBER is the gold standard followed by economists, the public and policy makers alike. In our paper we tried to ask three questions: (1) How good a job is the NBER doing at dating recessions and expansions? (Answer: very, very good); (2) Since the NBER releases information about the current state of the business cycle with a 12-18 month delay, are there any indicators that are useful to classify economic activity in real time? (Answer: yes, the Chicago Fed Index, the Philadelphia Fed Index (ADS), PMI, and I will let you in on a secret, initial claims of unemployment); and (3) Can we predict turning points into the future? (Answer: pretty well during the first 12 months, increasingly less so further into the future. We also show which indicators work best and when).
The ROC approach that we use in our paper is popular in biostatistics (also in other scientific fields) for medical diagnostic testing. For example, in a PSA blood test for prostate cancer, levels of 4ng/ml or lower are considered normal, levels above 10ng/ml are considered “high,” anything in-between is considered “intermediate.” Suppose your blood test comes in at 6ng/ml, Should you have a biopsy of your prostate? A very conservative doctor may send any patient with a reading above 4ng/ml to the operating room but clearly many patients will go through an unnecessary procedure. A less conservative doctor may send only those patients with readings above 10ng/ml, but then he will miss some patients that have prostate cancer. The ROC curve methodology allows one to articulate what the “optimal” (used here very loosely but not in our paper) cut-off reading for the PSA test is to decide whether or not to send a patient to have a biopsy. Likewise, we have a similar problem in using economic indicators (the equivalent of the PSA blood test) when trying to decide whether it is best to classify the data as a recession (having cancer) or as an expansion (not having cancer).
It has become commonplace to rib academics and policymakers alike about announcing the end of the recession while unemployment remains high. This turns out to be nothing extraordinary, just a common feature in the data. We show that the employment recovery tends to lag by 6 to 9 months the end of the recession. We should be cautious here in that this is a statement about the historical average over post-World War II data but in more detailed work by Engemann and Owyang (forthcoming in Macroeconomic Dynamics), they show that employment seems to recover with increasing sluggishness in the more recent recessions. Perhaps a better approach would be to distinguish “output recessions” from “employment recessions” to avoid this frustration of calling the end of the recession while the public struggles to find employment. But for now, it may be reasonable to expect that employment will not recover for at least another 6 to 9 months after this recession is over.
I still think that the light at the end of the tunnel is an oncoming train.
From a NYTimes Article “U.S. Home Building Unexpectedly Slumps in October”
“Part of the overall decline in housing construction might be explained by the uncertainty in October over whether Congress would extend a tax credit for first-time home buyers.”
I want to use the quote above to explain why econometric or statistical analysis without praxeological considerations is foolishness when dealing with the real world.
I am always amazed that no one is surprised that uncertainty is created by the government when extension of such programs as the first-time tax credit are questionable, but they don’t see that government confiscation of major businesses creates even more uncertainty. The markets can live with over-regulation, inflation and deflation, and high taxes, but when faced with uncertainty they come to a screeching halt. Just as questions about the first-time tax credit make buyers postpone decisions the government confiscation and threats of take-over do more to create economic contraction than any other one element.
If you study the economic declines of the past you will see the hand of government right in the middle creating uncertainty and by extension dragging down economic activity, both consumption and production, as people try to figure out what to do.
Studies like these may be academically interesting, but they are meaningless in the face of potential increased taxes that could confiscate business profits. Until government brings some level of sanity back to the economy by stopping their meddling and interventions we will repeat the stagnation just as we did during the Great Depression. Only the government can take a small business downturn and turn it into an economic disaster of unprecedented proportions.
A rather obscurist title for a paper about defining and predicting business cycles. And this on the back of Menzie’s widget algebra, which was really about the ARRA’s impact on employment. Coincidence, or a conspiracy to shake off some readers?
Tom: Sometimes I choose a title that I think will interest search engines rather than humans. If I used a more appropriate-for-humans title, it would be essentially the same title as for umpteen other econbrowser posts.
The ploy worked, by the way. Google “receiver operating characteristics curve” and you’ll find us #1!
> Can we build a model with these two
> variables to achieve a better ROC?
Yes, of course – there’s an enormous amount of work on that in machine learning.
Essentially, there are a number of weak-to-moderate predictors (Chicago Fed index, etc.), and standard techniques (HMM, Boosting, etc.) can be used to combine them to produce a predictor that’s stronger than any one of the inputs.
Pitt: indeed, there is a lot of interesting work in machine learning that is now being formalized in Statistics. A good reference is the 2nd edition by Hastie, Tibshirani and Friedman (the first two are statisticians at Stanford and the latter has done a lot of work in computer science).
Oscar Jorda: You can snicker at the public and say that it is “commonplace to rib academics and policymakers alike about announcing the end of the recession while unemployment remains high”, but be reminded from Macroeconomics 101 that the NBER does not declare recessions (start or end) based on GDP growth rates alone – as you imply in your article and your comments here. The NBER uses at least 4 factors in a hard to quantify judgment. I find it hard to believe that I have to remind an economics professor about these fundamentals.
Your tool is useful in single factor optimizations, so go do some research and get yourself some interesting single factor economics problems to solve. Capital adequacy at banks for picking the optimal point for the FDIC to close them might be an example. Probably you can think of some. Your single factor tool will not work well on a multi-factor decision. But the good news is you can probably get several papers published from different single factor examples.
Mike: Indeed, the NBER looks at GDP, gross domestic income, manufacturing and trade sales, two measures of employment (payroll and household), industrial production and personal income. In the paper we look at each and everyone of these variables. This is where we find the differences in the timing of peaks and troughs across indicators and the employment result to which you allude. We also looked at current business conditions indices and the index of leading indicators, one at at time.
As to the question of combining data (in factors, perhaps) to come up with a “better” binary classification of economic activity – here is when things get a little dicey. First, this was not a question we set out to investigate (there is a limit to how many ideas one can pursue in one article). Second, there is no question it would be interesting to look into what you suggest but then one has to come up with a criterion that spells out how each indicator is to be combined. A factor model is a variance reduction technique – by itself, the factors may or many not have economic meaning. Pretty much one would need to specify the appropriate loss function of the NBER, which we do not know. If we set the NBER aside and ask what would be the “optimal” classification mechanism to know how “best” we should combine the data, this requires that we state what the goal of the chronology is. If we are concerned about policy, then focusing on output measures may be the ticket in the sense of catching the “recession” early. Of course, the recovery in employment may still lag that of output and you may always find the phase shift that we report and that is well known in the literature.