What do current financial indicators tell us about where the economy is headed?
Macroeconomists have long observed that changes in financial indicators often presage future changes in the economy. For example, a big gap between yields on long-term relative to short-term bonds often signals that faster real economic growth is coming, while an increase in the spread between risky and safer yields is often observed prior to an economic downturn. Stock prices and yield spreads are both used by the Conference Board’s index of leading economic indicators.
Most recently, researchers have tried to gauge the degree of financial stress using indicators such as the LIBOR-OIS spread ([1], [2]) or deviations of yields from predictions of interest rate models (e.g., the recent paper by Christensen, Lopez, and Rudebusch). There are also a number of composite indexes that various private-sector analysts rely on, such as the Bloomberg financial conditions index.
Two private-sector analysts (Jan Hatzius of Goldman Sachs and Peter Hooper of Deutsche Bank) have recently teamed up with three academics (Rick Mishkin of Columbia, Kermit Schoenholtz of NYU, and Mark Watson of Princeton) to produce a new financial conditions index that attempts to combine the information of 44 separate series including those mentioned above along with a great number of others. One of the differences between their approach and previous work is that HHMSW seek to isolate the separate information of the financial indicators from aggregate business cycle movements by looking at the residuals from a regression of each indicator on lags of inflation and real GDP growth rates. The researchers then extracted a variable similar to a principal component from the residuals across the 44 indicators. HHMSW demonstrate that the resulting series can be quite helpful for predicting real GDP growth, though there is evidence that these predictive relations may change over time.
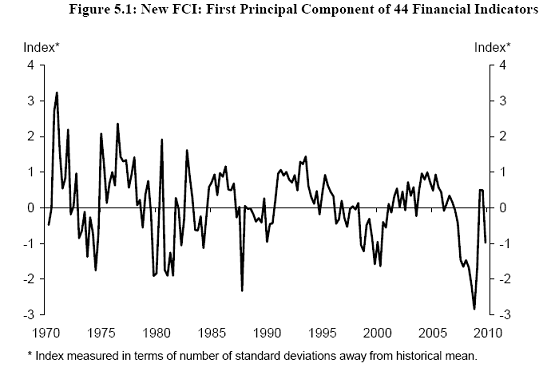 |
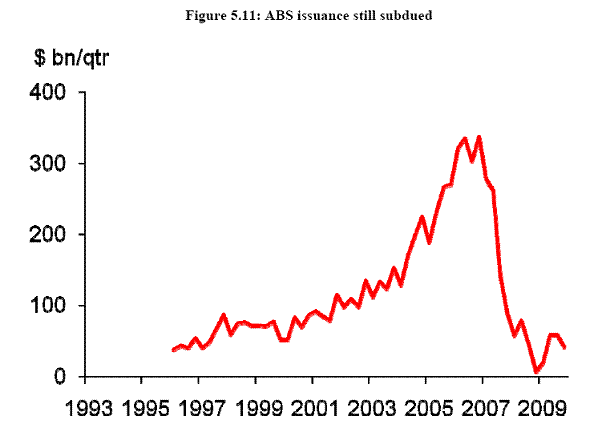
Of particular interest at the moment is the fact that the HHMSW index, unlike most other indicators, shows a renewed deterioration subsequent to the initial recovery in the first part of 2009, a somewhat surprising result given the current steeply-sloping yield curve, low TED spread, and booming stock market. The surprising contrary inference from the HHMSW index appears to be due to two factors. First, the HHMSW index is based on the deviation of the financial indicators from what one would have predicted given recent economic conditions. Many indicators have not improved as much as one would have expected given the return to GDP growth, and the departure from a typical recovery pattern is viewed by the index as a highly pessimistic development. Second, the HHMSW index makes use not just of the yields themselves but also of the quantities of various assets, and many of these show little improvement so far. For example, issuance of new asset-backed securities remains quite low.
 |
Will real GDP follow the HHMSW index back down? That’s not what I’m expecting. But if it does, it wouldn’t be the first time I’ve been wrong.
Professor,
GDP actually measures two things. It does in fact measure economic production of the private sector but it also measures government spending. The greater government spending as a percentage of GDP the greater the change in GDP actually reflects government spending versus actually economic production.
In a period of contraction actual economic production declines because of two things, demand and consumption decline and businesses retrench, or in other words trim fat and increase savings so that they can increase investment when demand returns.
In today’s world we concurrently see an increase in government spending to attempt a Keynesian or monetarist “stimulation” of the economy. The result is that as GDP declines government spending actually drives GDP more than it does during a prosperous period.
For this reason among others GDP is not a reliable measure of recovery and becomes even more unreliable the deeper we fall into economic contraction.
Economics is a behavioral science and while few economists deny this, they often act as if it was not true. If you really wish to determine recovery you need to look at government decisions. Government moves to pay for more unemployment, to hinder companies from producing, to fine successful companies, to pull resources from production especially through taxes, all work against recovery. Not until government decisions makers release the productive capacity of the economy and allow the markets to purge the system will we see a recovery. A double dip, or triple dip, will be the norm as long as demigods in government continue to prevent recovery.
The best signs of recovery will be a Democrat rout at the polls in the fall, but that is not to say a Republican victory. During the Bush administration the Republicans proved themselves to be just as bad as and at times even worse than Democrats. But a Democrat rout in the fall will be a sign that a new injection of freedom loving politicians will be coming to Washington and that will signal recovery.
Thanks for the posting Jim. You are right that the new FCI (which we have decided to dub the USMPF FCI–for Monetary Policy Forum) indicates less stimulus to growth than standard FCIs. But this does not mean it is anticipating a decline in GDP. At its Q4 level, it was pointing to something like 2% GDP growth over the year ahead, with a standard deviation of well over 1% pt. This projection is based on a pretty simple autoregressive structure that may well miss a good deal of what could be driving GDP ahead. Moreover, the FCI’s Q4 read may have been temporarily depressed by some regulatory uncertainties affecting ABS securitization and by the fact that the Fed’s senior loan officer survey, which is taken very early in the quarter, has since improved noticeably. We will be dealing with some of these issues in an upcoming revision. For now, the bottom line is that while this index still sees overall financial conditions being a net drag on growth, it is nevertheless consistent with a moderate expansion of GDP during 2010.
The HHMSW looks handy to have. I think it’s more useful to look at its parts individually than the index as a whole.
The days of quickly checking the 10 year Treasury rate and Libor rate in the morning to determine if it’s a “risk on” or “risk off” day are over I think. We need more sophisticated tools to determine whether it’s safe to get out of bed in the morning. Greenspan says he checks the 10 year Treasury rate once in the morning and once in the afternoon, but no one listens to him anymore.
However, this is consistent with what many people think is going on. Private sector credit growth can’t/won’t be the driver of GDP growth, securititized products have become rather unpopular, and we have a new and improved personal savings rate. So the government is doing their duty and growing public sector credit so nothing bad happens to our GDP number. Problem solved.
There still is the possibility that the USG does the “Mistake of 1937” boo-boo, but a chorus of economists are warning us of that, so maybe we won’t go there again.
Krugman just posted a 300+ year chart showing how Britain went to a 250% debt/GDP ratio TWICE in His/Hers Majesty’s post Renaissance history. So we can take some comfort in that data series. They even made it thru WW2 without changing the name of the island or the name of the currency!
They did used to press gang the unemployed into the Royal Navy, so I’m not sure if that makes a difference or not. Then they had debtors’ prison instead of non-recourse mortgages, which would be a little different than the present day. And if you where lucky enough to be released from prison, you were expected to somehow pay the friendly prisonkeeper for the food you ate whilst visiting the establishment. Again, this sounds very different than the Food Stamps program, but maybe Dr.PK will give us a followup post fleshing out the relevancy of his data series. 🙂
RicardoZ, tax rates and tax revenue are at a 70 year low right now.
RicardoZ: GDP measures several things: consumer expenditures, government expenditures, exports, imports (-), private gross capital formation (investment).
Y = C + G + (X-M) + I
Changes in government expenditures do influence GDP; however, private investment is by far the most volatile part. Changes in private investment are driven by expectations of worthwhile risk-adjusted returns. Consumer expenditures can be further broken down into consumer durables and consumer non-durables. Consumer durables tend to be volatile and sensitive to the same drivers as private investment.
All this to say, studying the intersection of finance and macroeconomics is key to understanding macroeconomic fluctuations (business cycles), and is attracting additional attention post-2008. Bond market tea-leaf reading is a favourite pass-time of active investors.
Changes in government spending are usually classed as fiscal policy. The central bank manages monetary policy.
I find it curious that you attribute such an important role to government spending in terms of igniting an economy recovery (presumably from a recession) and at the same time support the freedom-loving Republicans. I would guess that the vast majority of graduate-trained economists in North America frown on discrete fiscal stimulation and credit exogenous heavy lifting, if any, to monetary policy.
As usual, this excercise in “tweeking” conventional macro modeling theory of GDP suffers the same limitations as previous models:
My great fear is that THE FINANCIAL WORLD VIEW, measured in GDP and based purely on price, yield, and asset volatility results in distorted short-term thinking. There’s a big qualitative difference between organic manufacturing growth and government service expenditures. I would like to see quant efforts in defining factors that affect long-term TRADABLE tangible production.
The abrupt changes of the composite 44 financial indicators suggest a Nonlinear Macroeconomic model is operative ….
The One Hundred and Fifty-Two Year US Equity Great Second Fractal Cataclysmic Collapse: 5 March 2010: A Fractal Replica of 11 October 2007?
Though the Federal Reserve has grossly distorted the normal activity of supply and demand in the debt markets, buying over ten months 300 billion dollars of US treasuries ex nihilo, the equivalent entire annual quantity normally available for equity speculation and money based structural support, a review of two years of readily available weekly and monthly trading valuation patterns for the US CRB and composite indices of US , European, and Japanese equities, nevertheless, easily demonstrates currently occurring saturation areas along the tops of the money supply based asset valuation trading curves.
Will money entering and exiting at these markets’ saturation areas occur nonlinearly and predictably according the quantum principles of saturation macroeconomics?
For the saturation macroeconomist/scientist who follows the simple mathematical quantum fractal patterns, the next three weeks in March 2010 will be among the most interesting days and weeks of asset valuation/fractal time unit observation. A spectacular 152 year nonlinear event is expected to occur in the third week of the next three week trading period. March 2010 is the 93 month of a 46/92 :: x/2x monthly pattern starting in October 1998 which began a major extension of the 70/140 year first and second fractal series for United States equity equivalents with extensional successive debt-money bubbles in sequentially the PC-internet industry, the real estate-financial industry, and now the central bankng industry.
Expected is the cataclysmic (beyond October 1987) nonlinear asset (equity and commodity ) devolution trading event that will define and validate the science of Saturation Macroeconomics.
The 93 month second fractal is made of a 14/35/28/19 of 21 month ideal x/2.5x/2x/1.5x fractal series. March, April, and May represent the terminal three months of the 19,20, and 21st month ideal fourth fractal.
.
[edited by JDH for length]
Besides some of the things MarkS said, can anybody guess what else is missing?
The model initiative is welcome,as its underlying principles (should my reading be accurate) is to provide for less transitivity laws as produced by the financial markets and so widely accepted in the OECD LEI or ECRI leading indicators.
The model is asking for some seasonal adjustment – way too much noise, especially early on in the time series. I can just count exactly 5 very obvious peaks between 1970-1975 and 1975-1980. After that there are sometimes a couple of smaller and much smaller peaks but the pattern still holds.
“…given the current steeply-sloping yield curve, low TED spread, and booming stock market.
This is an exotic piece of reasoning, Mr. Hamilton–to say the least.
In some cases these data points could indicate a recovery; however, this case doesn’t seem to be supported by many other indicators (housing, employment, savings, real personal income, declining revenue, etc etc–all of this is documented enough elsewhere). I suppose on different planes of existence from the one you seem to dwell in, that is, a distant world where people have to shop for their own groceries as the economic downturn has caused them to lay the butler off.
Given that there’s not much corresponding data to bolster a “recovery” prediction (unless we want to taut the CNBC mantra of Dr. Copper is up again, after a brief fall to start the year). However, resisting the urge to reach into the grab bag of desperate cheerleading-data, perhaps there might be an alternative explanation for the phenomenon you mention above.
First, the yield curve is steep, and the short yield of the curve has had an impressive rally, but this shouldn’t be surprising given that there’s hot money trying to find a home, and there’s nothing more liquid than short term Treasuries in the cases that matter: time interval to liquidation and slippage. The long end of the curve is of little interest to the hot money moving around, ie hedge funds and financial institutions who want to keep their investments liquid so they’re always in a position to take advantage of trading volatility.
To further bolster this interpretation one only has to look at increasingly high percentage of take downs by the direct bidders; and the bond market propping by Primary Dealers–yet, even in spite of that, on 2/11/10 the 30 yr UST had a bid/cover of only 2.360; an ‘allotted at high’ of 61.570%; and a PD involvement of 47.39! This is about as close as the US can come to a failed bond market without it actually outright failing. With all this hot money flying around for almost a year now, I’ve been bullish on the short end of the yield, that is, until recently as this game is becoming a little too hot for me to want to play the timing game. However, possibly by the end of this year, or H1 of 2011 will be a good entry point for short selling USTs; but they probably have another 6-9 months of rally left
Next, as for the TED spread, with the US government and the Federal Reserve ready to jump at a moments notice to save any and all too-big-to-fail financial institutions basically leaving us with a menage a trois with the governments (especially the US and British), central banks, and financial institutions why should the market make any distinction between a short term T-bill and Interbank lending when at this point in the game it’s been made clear that one will fail only if the other does. The spreads widening in the past, even the very recent past, was when this relationship was possibly assumed or speculated, but not outright demonstrated.
Further, counter party credit risk analysis is a difficult game in this economy, given everything from countries hiding debt through currency swaps, owning credit default swaps without owning the underlying assets, marked-to-model asset valuation in the financials, and potentially book cooking among the corporations (not that we haven’t seen that before).
And a booming stock market? Really? We’re flat for the year, in a ten year bear market for stocks, the market is still overvalued on whatever criteria based on this reality, volume is anemic, and insider trading is massive on the sell side. Around the beginning of 2008 the S & P was ~1500, by mid 2008 it was ~1300, and then by March, 2009 it crashed to 666; and today, amongst this boom!, we’re still only around 1100. Now, the three types of parties that avoided direct damage from this meltdown were: (1) investors who pulled out in time, (2) those who just entered around the March lows (somewhat of a boom for them, true0, and (3) those who never enter the stock market. For most involved, they were caught up in the melt down, and they’re still down from the highs.
So, let me run these numbers off the top of my head, and let’s see how much of a boom we’ve really had; that is, assuming one was in the market at the top, as most involved were (from investors to retirements).
From the S & P 500 going from 1500 to 666 we have about a 55% loss, which is massive. Then from 666 we have a bounce to the current 1100, about a 65% gain, which certainly is very impressive, but only if one had entered at the low. One who suffered the loss would still have to go from 1100 to 1500. You would still be down about 26%, and which would require about another 36% gain just to get back to even. Yes, the bounce was certainly impressive, but even after that, you would still be down, big.
I don’t suspect that many who have had their retirement slaughtered twice in the last 10 years by the stock market (and three times in the last 23 years) think that the stock market is booming.
And let’s us not be so naive as to believe that this ramp up was organic–one only has to correspond the Fed’s $300 billion in quantitative easing funds disbursement through the NY Fed’s open market operations and the market’s ramp in Q2 and Q3 of 2009.
For sometime now the stock market has been moving sideways, and I am not convinced that flat lining constitutes a boom!.
And with looming resource shortages in the near to intermediate future, that is, beyond the week over week analysis of media pundits, this will more than likely continue the bull market in commodities; and we have yet to see a simultaneous bull market in commodities and stock in terms of their asset class.
Ricardo wrote – “The greater government spending as a percentage of GDP the greater the change in GDP actually reflects government spending versus actually economic production.”
It is often hard to tell whether mistakes like this one are intentional, or merely reflect the absorption of the mistakes of others. Early in the paragraph which includes this sentence, Ricardo noted that government spending and private production are both part of GDP. In the second sentence, though, “actual” is substituted for “private”. Whether this is merely an effort at slick insertion of propaganda we cannot know, but government production is production, and it is actual.
“Not until government decisions makers release the productive capacity of the economy and allow the markets to purge the system will we see a recovery.”
By this point, we are down to pure liquidationist thinking. In order to get to this point, Ricardo has had to engage in a bunch of questionable assertions. Yes, there are some proposed new taxes, but no actual new taxes at the federal level. Ricardo doesn’t seem to know that, or doesn’t want his reader to know that. (If it is the latter, this is a very odd place to try this sort of misdirection.) Taxing the “successful” in the current context seems to mean taxing bankers who have turned massive subsidy into profit. I’m not sure how that distorts incentives.
Overall, though, what we have is a lecture on the world according to Ricardo, with no supporting evidence. In the end, we see that the real goal is one that Republicans have long attempted – labeling Democrats bad economic managers. The record, of course, is quite the contrary. Growth under Democrats has been reliably better than under Republicans. Deficits have been reliably higher under Republicans than Democrats. That is partly because higher taxes have, in recent decades, been associated with better growth than lower taxes. Obama’s tenure in office may dent that record, but that remains to be seen. Meanwhile, let’s hope “freedom loving politicians” (sic) flock to DC, but don’t hold your breath that they will love each person’s freedom equally.
And in terms of trying to use the TED spread to gauge counterparty risk this time around, it may not be so useful. In 2007-08, the “attacks” that was causing “credit events” were one financial institution either demanding a margin call from another financial institution or a demand on a swap payout, and of course many of these institutions became exposed to “attack” as their revenue streams collapsed and their cash holding deteriorated. Basically, interbanking funds are going to be more expensive to borrow as institutions need their own cash to fend off “attack”, or the high rates themselves become a form of “attack”–not to mention that the institution your lending was very likely to not pay you back. In essence, Wall Street began to cannibalize itself, and this set off a panic among other institutions that pulled their money out of holdings and financial instruments and ran to USTs, that is, the institution with the printing press.
There’s still plenty of counterparty rick out there; not just from internal threats like balance sheet implosions due to the suspension of mark-to-market; but the banks now face a threat of public perception turning into a panic and causing a run–and we can see preparation taking place whether it be in the money market fund mangers having the power of suspension or capital control on banking accounts (Chase holding deposited checks for 24 hrs, Citi announcing the enforcement of customers to give a 7 day notice on withdrawals on any account), and so on. Who knows what will happen, but this much looks certain: the banks and government are at least preparing for the real possibility of a bank run
And those monetary reserves that everyone keeps looking at as the banks keep money with the Fed? Forget it about them ever being used for lending. First, banks don’t use nor need monetary reserves for lending because they first create the credit in the form of a loan, and then create a deposit; and anyone who has gotten a bank loan knows that they open an account for you for that loan (ie a deposit). The whole notion of having a banking cartel under a central bank is so the banks don’t need monetary reserves to lend from. However, creating credit from deposits is much sounder and stable, and therefore that is why it’s promoted (but not necessary).
Those monetary reserves are for a rainy day, which can come in many different ways, or in simultaneous storms, such as: a bank run; massive misallocation of asset valuation thus leading to under capitalization in tier capital (which the major banks could be over valuating their assets by more than three trillion dollars); a credit event, like a wave of sovereign defaults; or it may be something to the effect that for political reasons the Fed is simply unable or unwilling to come to the banks aid, and so they can draw down from the reserves in the meantime.
The point is, the risk is out there and it is threatening from all directions, even to the point that the monetary reserves are at record levels, and they’re not for traditional bank lending (or else the Fed wouldn’t pay out an interest rate for them to keep it there).
Krugman is right that with interest so low, it makes sense to borrow
However, I rationalized Bush’s spending that way (especially since defense spending was providing both jobs and practical training to the young people hardest hit by the recession). But what I’m worried about is that the low interest rate isn’t real (not suggesting there’s deflation) in that investors are irrationally lending to the government, and because they are afraid to make real investments because of what the government is doing and considering doing.
Instead of a housing bubble, I think right now we have an education bubble and Government debt bubble.
I’d generally say it’d be stupid not to borrow at near zero percent. But it is important how the money is used. First thing is first. The government needs to get into the mortgage business and pass those low rates on people who have existing debt. So long as the people who still have jobs’ income is tied up in servicing debt and taxes, they cannot spend or invest.
GNP wrote:
I find it curious that you attribute such an important role to government spending in terms of igniting an economy recovery (presumably from a recession) and at the same time support the freedom-loving Republicans.
Not sure either of your assumptions is true.
Government spending des not ignite an economic recovery. Quite the contrary government spending hinders economic recovery by distorting market signals and removing resources from productive activities.
Second, I am not sure what freedom-loving Republicans you are talking about. I am hard pressed to find a Republican I can support just because they are not freedom-loving. They are central planners often as strongly as Democrats. The only thing is they want to use the government to plan different things. Republican plans still distort markets and waste resources on the whole.
I am becoming more of a George Washington anarchist every day.
“The government needs to get into the mortgage business and pass those low rates on people who have existing debt.”
Why do you think mortgage rates are hovering near all time lows?
The sale of existing homes adds virtually nothing to economic growth (apart from a few fees). Yet, here we are subsidizing their sale to the tune of hundreds of billions a year (housing tax credit, mortgage interest tax deduction, FHA domination of mi market, FNM/FRE bailout, HUD distressed sales, FHLB support of lenders). And then we have the more egregious problem — the direct or indirect subsidy of a TRILLION or so to prop up the balance sheets of financial institutions. None of this activity is stimulating production or innovation. Its all about wealth transfer from the moronic middle class to the rich elite. A more succint definition is to call it looting.
I must say that watching an empire retreat into barbarism is certainly entertaining!
I was think more along the lines of the goverment buying those mortgages made between 2005 and 2008 that are still in good standing changing the rate to 4% fixed.
These kinds of macroeconomic indicators are what policymakers look at, and that is probably unfortunate.
It would be much more helpful for policymakers to see what the particular nature of creative destruction that has gone on in a recession involved, so that they can see how the mix of factors in the economy is changing and get ahead of it, than it is for them to see hot and cold growth indicators.
Peter Hooper, one of the authors of this paper, makes curious comments about it. First, is is curious that most of the comments are negative about the model that his group just published. Second and even more curious, is the form of his critiques. They are oblique and off topic. For example, he says the model generates a 2% growth outlook, but the index is created from deviation calculations (if I understand the summary correctly). He says it may be missing some things that would project a higher growth rate, but he does not elaborate on these missing items, or how they would also affect the deviation calculations that are apparently more important for the index results. Then come two more sentences about what “may have been” or “may be”, but again no impact statement. And lastly we get to the dog that did not bark. He closes with the comment that the model is consistent with modest growth, but he does not mention that the -1 reading in the chart is consistent (in every case) with an equity decline via either recession or an international financial panic (1998 was LTCM).
Then one adds in MarkS’s observation that the model does not consider debt, deleveraging, stimulus programs, and state and local financial crises. I will add international debt and bank crises to the list of missing forces. All of these are measurable. And I get even more curious about the tone and the reasons for the choice of comments that Peter Hooper made about his own model.
It looks like the government has been counting GDP in such a way that includes the gains from offshoring.
http://www.nytimes.com/2010/03/06/opinion/06Tonelson.html
Mr. Hamilton, still using the TED spread to evaluate counterparty risk? Here’s a little piece for your reading pleasure. If what Ms. Tavakoli is saying is true (which I personally cannot verify, but she is not only a very astute person and a respected member of the investment community), then counterparty risk is skyrocketing.
The TED spread may, and probably will, eventually widen; but by that time it would too late to hedge against the risk, as it more than likely suggests that governments are no longer willing, or cannot, backstop the financial institutions.
Gold demonstrates once again why it is one of the ultimate counterparty risk indicators–and this would still be in the face of the constant attempt to manipulate the gold price, if in fact it is true (although there is some strong suggestions that this is true).
Correction on my above first post: the link to the 30yr UST should have redirected the reader to here, instead of redirecting to the 5yr auction results.
Thanks Tom Shillock for providing the link to the NYTimes Tonelson/Kearns piece… Its refreshing that specific criticism of a BLS statistic is published in the lay press. Its equally cool that the “We’re fooling ourselves with blind-faith acceptence of government statistics” theme gets some play time.
@RicardoZ
“GDP actually measures two things. It does in fact measure economic production of the private sector but it also measures government spending. The greater government spending as a percentage of GDP the greater the change in GDP actually reflects government spending versus actually economic production.”
Robert Baro makes similar observations. I also tried to argue that C+I is more important than GDP to my macro prof, but as a keynesian he wouldn’t hear of it.
Do we *want* a shadow banking sector that is growing at the pre-recession pace these days?
@RicardoZ:
“Government spending does not ignite an economic recovery. Quite the contrary government spending hinders economic recovery by distorting market signals and removing resources from productive activities.”
Here again, we have a statement that is based purely on believe. The problem with the libertarian believes about the government as root cause of all problems, because it would distort the “free market”, is that it is immune against any testing against empirical data. Since there is always government, the government is always being blamed, if things don’t work out as they should according to the libertarian ideal world. What does this make the libertarian believe system? It makes this believe system a metaphysical one.
rc
@Tom Shillock:
“It looks like the government has been counting GDP in such a way that includes the gains from offshoring.
http://www.nytimes.com/2010/03/06/opinion/06Tonelson.html”
Sorry, I don’t understand this. The GDP measures the price sum of all domestic production/services in a time period. What gains in the GDP would that be, which comes from off-shoring and is wrongly included in the GDP according to you?
rc
If the government borrows from overseas to purchase GDP components, this is artificially propping up production of services the free market does not value enough to pay for. There is a time limit on how long this can go on, since debt can only get so high before foreign savers panic.
The current public borrowing replaces the previous consumer borrowing from overseas. This model was also limited in time, as eventually consumers could not service the debt. Debt based economies are not stable in the long run. That is, the US cannot indefinitely serve in the role as consumer of last resort for the entire world.
World central banks are collectively setting up an unstable system by stealing purchasing power via the electronic printing press, and lending the loot back its victims. This system results in ever more debt slavery to the banks. At some point, consumers tire of the lower standard of living, and endless overtime needed to service the debt.
The simplest way to avoid ever more debt is to just stop printing. That is, let CPI prices go lower as productivity gets better. That way all consumers benefit equally from improved productivity. Consumers collectively can buy the extra goods they produce without excessive debt. The median standard of living automatically rises over time under this scenario, unlike the current system.
The disadvantage is that banks can no longer control the business cycle. However, since their “ever more debt” method of control is not stable in the long run, it is a worthless model anyway. The build up of debt caused the Great Depression, and now the current crises. Debt must be maintained within reasonable bounds for the system to remain stable in the long run.
RichardOz: You were being “tongue-in-cheek” and I obviously misunderstood.
Thanks for the discussion of this interesting new index.
RE: “Of particular interest at the moment is the fact that the HHMSW index…shows a renewed deterioration subsequent to the initial recovery in the first part of 2009…”
I don’t find it surprising. I do believe,and have extensively written about, the idea that we are currently experiencing transient financial strength – which will lead to further economic weakness, unfortunately.
There are many very troublesome economic conditions and statistics clearly evident.
Many informative posts here. The type of discussion that is helpful in understanding the current state of affairs. I agree with Mark S’s comment. We have, essentially, one prior observation for a situation with huge debt burdens, and going back to 1960 doesn’t even catch that one.
Re: JH’s interpretation and Peter’s response, isn’t 2% growth a decline from the current level?
Re: Long Run – if the government borrows from abroad to finance its operations, this may result in greater government services, but it also results in smaller tradeable goods production, as the trade balance must turn negative to match the foreign capital inflow.
Re: Ricardo Z’s point, it is true that the make-up of GDP changes if government spending constitutes a bigger share of the total. However, taking federal and state and local governments together, there does not seem to have been much change in the overall government share. Certainly the change is much less marked than the impression one gets looking merely at the federal share.
thank you for bringing this new indicator to our attention.
can anybody tell me where i can find updates of this index in the future?
thanks a lot!