Although many people are concerned about the possibility of a second economic downturn, I continue to see an economy that is growing, albeit significantly more slowly than we would have wanted.
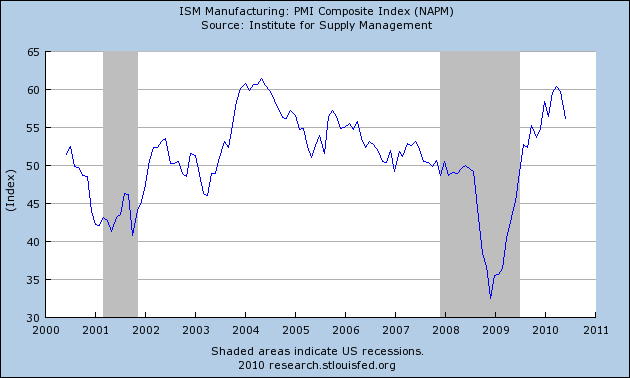
The ISM manufacturing PMI index for June was 56.2, the lowest value since December. But any value above 50 means that a plurality of managers reported that June was better than May. The uninterrupted string of above 50 readings we’ve seen going back to August of 2009 means that mangers have seen improvements month after month. A value of 56.2 is higher than that seen in 80% of the months over the last ten years.
|
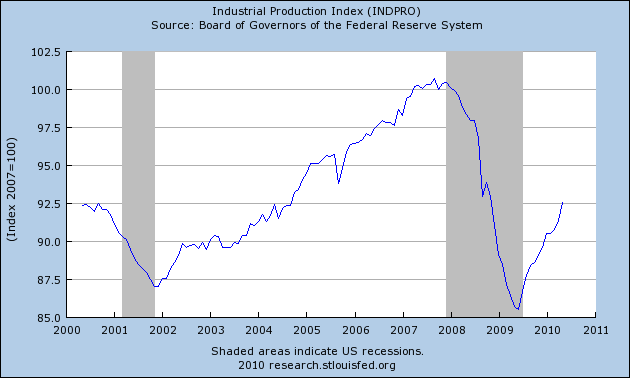
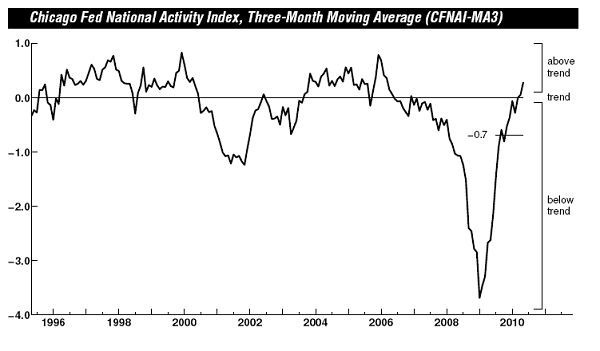
The Federal Reserve’s index of industrial production and the Chicago Fed National Activity Index both paint a pretty favorable picture of continuing growth in May.
|
|
What about the Bureau of Labor Statistics’ estimate that seasonally adjusted U.S. nonfarm payrolls decreased by 125,000 jobs in June? We discounted last month’s BLS estimate of 431,000 new jobs in May on the grounds that 411,000 of these were temporary Census workers. But if you didn’t count those as a plus in May, you shouldn’t count the elimination of 225,000 of those temporary positions in June as a minus. Net of temporary Census hiring, the U.S. economy created 100,000 new jobs in June. I think that Steven Blitz of Majestic Research has the right perspective:
Adding 83,000 private sector jobs, of which 20,500 are temporary positions, and losing 10,000 state and local government positions, is not the stuff of robust recovery but it also isn’t the makings of a double dip.
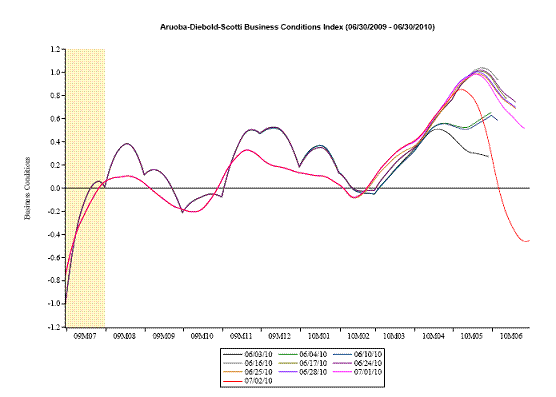
The Aruoba-Diebold-Scotti Business Conditions Index, which feeds off the raw NFP numbers without adjusting for the temporary Census positions, was shocked back into negative readings by the latest BLS report.
 |
I see employment overall as still growing, not contracting, but the growth is not enough to keep up with growing population, let alone make a dent in the huge number of unemployed.
|
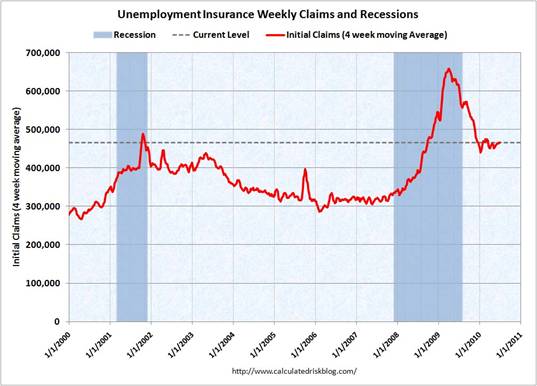
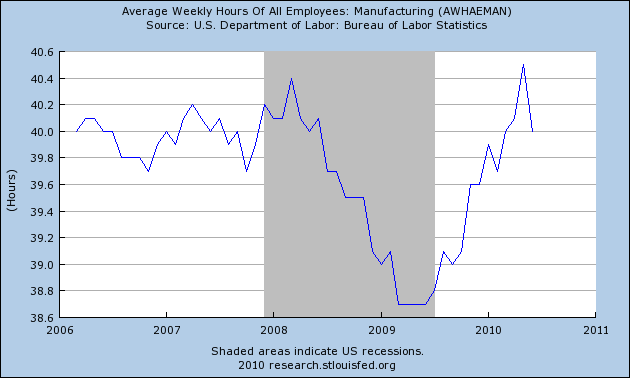
The Conference Board regards nonfarm payrolls as a coincident economic indicator, but new claims for unemployment insurance and average weekly manufacturing hours as leading indicators. New claims have been stuck at a regretfully high plateau since December.
|
And although it can be a mistake to read too much into one month’s figures, whatever you say about the sharp drop in manufacturing hours in June, it can’t be good.
|
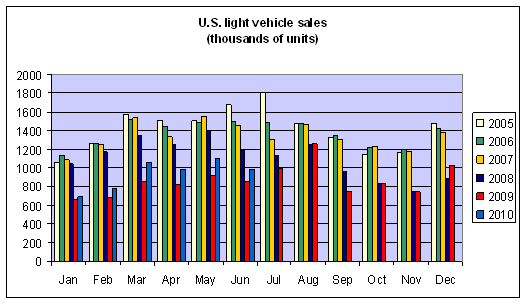
It’s also safe to say that autos are not yet providing the stimulus to growth that I had thought they could. The seasonally unadjusted number of light vehicles sold in June was below the values for May or March and about the same as April. We still seem closer to the bottom than the top.
 |
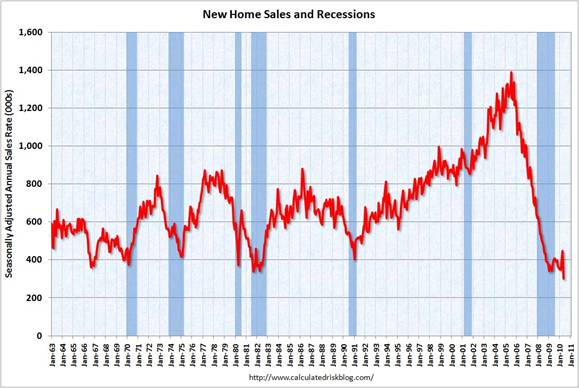
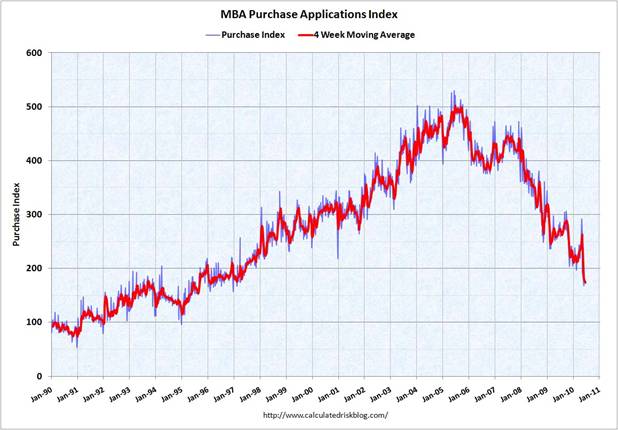
Housing continues to lurch up and down with the expiration of tax credits. New home sales and pending home sales were both at record lows for May, while mortgage purchasing applications were near a 13-year low.
 |
 |
Historically, a deep recession would usually be followed by a sharp recovery. What’s different this time? Bill McBride notes that it’s harder to recover from a collapsed credit bubble, and two key drivers of many postwar recession recoveries– lower rates from the Fed and resurgence in the housing sector– are not going to help us this time.
What I’m still seeing is what I had been expecting and what I continue to expect for the rest of this year– weak growth, but growth nonetheless.
Kinda a dumb post. Yes, balance sheet recessions are different, and inflating housing values ain’t going to happen unless we follow the Japan playbook and drop mortgage rates to 2-3% somehow.
Things may no longer be collapsing but the fact remains that we’ve collapsed and are just picking stuff out of the rubble of the Bush Economy.
The 99 week EUC is absorbing a lot of systemic stresses. Once that stops, we’ll be moving back down.
We’ve got an unsustainable level of government services going on now; we’ve got to either raise taxes, cut gov’t paychecks, or print.
We’ll probably do all 3 but the dominant component of this remedy will be deflationary.
Complicating matters is energy movement. The 80s and 90s benefited from North Sea and non-OPEC oil coming online, putting more money in household budgets.
Troy said: “Complicating matters is energy movement. The 80s and 90s benefited from North Sea and non-OPEC oil coming online, putting more money in household budgets.” And we will not see any energy movement die to liberal anti-carbon policies, regulations, and ongoing demonizations.
Dr Hamilton, I hope you are correct, but the data do not show a very positive scenario. Looks as though we are teetering. Hope nothing happens to push us the wrong direction.
I agree that the data doesn’t show a very positive economic scenario.
While the June ISM Manufacturing Index showed that 56% of managers thought June was a better month than May, the trend is still declining. I also question how much weight of the overall health of the economy should be given to this survey as it covers just one area of the economy and is very subjective.
I believe the unemployment chart is a much better indicator as to where the economy stands. This slow job growth is going to keep consumer spending down for quite some time. As long as people can’t find jobs we will not see an increases in big purchase items like homes and cars.
I work in the auto industry in Oregon and sales have been way down since Cash for Clunkers ended. Customers are just not coming in the doors.
Overall, I can agree with your statement that the economy is growing; however it is growing at such a slow rate that we might not get back to previous levels during this whole decade.
Interesting observations could be drawn from the Fed St Louis charts and diagrams:
Tracking the global economy other OECD countries and regions
http://research.stlouisfed.org/economy/
Tracking the G7 and Australia
The countries in recession Denmark,Finland,Norway,Ireland,Sweden,Switzerland are countries having the lesser stocks of public debt over GDP ratios (save Ireland undertaking a drastic diet on debts) by contrast expansion is financed by public debts increases for countries in expansion.
World bank quarterly external debts statistics
http://ddp-ext.worldbank.org/ext/ddpreports/ViewSharedReport?REPORT_ID=13523&REQUEST_TYPE=VIEWADVANCED
Assuming that trust and confidence in an economy is reflected in real gross fixed domestic investments besides Brazil, Korea,Canada the pictures do not portend a vote of full confidence by the private sectors in many of the other markets economies.
Very good analysis indeed. I only miss the expectation reflected by the financial markets. The 10 years treasury bond at 2,95%… Well, it is very very low. In any case, that tends to confirm your opinion.
The Fourth of July this year lacks its usual punch for me. Our nation has made mistakes. We did not respond properly to our bounty when we had it. Grown-ups will respond with corrective action. Children will complain and blame others.
The lesson for me from all these charts is the sobering realization that our economy could stay stuck on slow growth for years.
The manufacturing sector is an important growth possibility but the unwillingness of the Congress and the population to restrict imports will hold back this sector of the economy.
I would agree with Troy that constraints on energy will constrain possible future growth.
We are probably near (or after) peak oil. As wells go deeper and deeper after shallower wells deplete, the rock temperature increases and as a result, the proportion of natural gas produced gets higher (e.g., the deep Macondo well is already 40% natural gas). Natural gas, however, has not peaked yet (perhaps still a decade away). And we won’t reach peak coal for perhaps two decades. However, we have to consider two strong accelerators of the oil downslope that will put increasing additional demands on not-yet-peaked natural gas and coal. These are growth of internal demand in exporting countries and reduced net energy (reduced energy return on energy investment) as we turn to drill harder and harder prospects. Those two depletion accelerators also apply to natural gas and coal.
We are entering historically unfamiliar territory for industrial civilization with a deep recession and a persisting debt hangover, but without the prospect of exponential growth in energy supply to save the day when the money problems preventing growth are ironed out.
i ran into this article in the WSJ this week: States Budget Woes Only A Modest Drag, San Francisco Fed….ive been focusing on fiscal problems at the state & local levels…so i dug up the fed report: http://www.frbsf.org/publications/economics/letter/2010/el2010-20.html and read through it (see what a sick puppy i am?) and posted versions of this question on several econ sites without getting an answer: i’d like someone to tell me where my figuring here is wrong (seriously) – local governments are in the same revenue boat as the states…that SF FED report calls the impact modest and states: “Recent data from the Center on Budget and Policy Priorities show that the combined budget gap states faced heading into fiscal year 2009 was $110 billion, or around 15% of total state general fund budgets. The gap heading into fiscal 2010 was even larger, $200 billion, or roughly 30% of general funds.” …elsewhere i found: Henchman says all American local governments combined (cities, counties, etc.) collect about $500 billion in taxes. Add that to total state tax take and you get over $1.3 trillion. (this source: http://inteldaily.com/news/173/ARTICLE/13219/2009-12-25.html ) ok, ive got $1.3T in state & local spending, or about 9% of GDP; a 30% shortfall on 9% of GDP is about a 2.7% hit to GDP… “modest”, huh?
One problem with the some of the gauges you’re using is the reversion to mean. It seems rather obvious that a diffusion index like the ISM can look pretty impressive after a singularly deep and prolonged fall.
For instance, in 2004 when the ISM numbers were comparable to the recent ones, the manufacturing index from the Fed’s industrial production data was near even where it was at the 2000 peak. In May, that index was still 10% below it’s 2007 peak.
The ISM figures are useful in measuring the breadth of a recovery, but not it’s magnitude, which seems to be how you’re characterizing them, and the way the press often does.
There may or may not be a double dip, but the fact there was a strong cyclical recovery within a historic period of debt deflation may not mean much at all.
US has about 10% employment+ 10% underemployment..so say avg 15% payroll deficit..
now if avg compensation is reduced for remaining 80% employed by 15% and the unemployed+employed army is fully employed, this should cause no net-net deficit..(it may be even better as ~5% unemployment is considered the norm)
this can be achieved by public+private enterprise(PPE)just like NEW DEAL and can be wound down quickly (2-3 yrs) when no longer needed..
Imagine the morale boost this provides to the entire nation..and shiller etc have shown psychology is a key component to the economy…
Americans can share the sacrifices w/ their brethren and make the country better in the process..
There are two other things about this recession that are different from most garden variety recessions. First, this recession is global, so we can’t expect much help from the net export component of GDP. And second, there is a really scary risk of of deflation. It’s worth recalling that core price levels have continued to drop over the last year even though economic activity has picked up. That kind of thing really isn’t supposed to happen. It tells me that there’s still a lot of excess capacity out there. The FRB data suggests that capacity utilization is still running about 7.7 percentage points below the long run average. We seem to be stuck in the low to mid 70 percent range. So no real chance of private sector investment picking up the slack even if the private sector felt somewhat more optimistic about the future. And what about government spending? Only if Obama can find a 60th vote in the Senate. That leaves us with Mr Consumer. Good luck with that.
For those that would like to pin the blame on any one administration’s policy, perhaps a look in the mirror might be in order.
http://www.npr.org/blogs/money/2009/02/household_debt_vs_gdp.html
I suppose that government should have stopped households from borrowing, but our parents would not have gone so far into hock even if they could have. The key word is prudence; they had it and we didn’t.
We are belatedly learning the lesson of taking on too much debt, and until we pay that debt down we are spending far less. This isn’t going to change much whichever party controls Congress or the White House. Expect slow growth under any policy.
My big problem is that I don’t believe a single one of these data. We know that unemployment is bogus. We know that CPI is bogus. We know that bank balance sheets are bogus. Why should believe the rest?
The “recovery” has been driven by government stimulus, principally in the form of massive handouts to the banks and housing industry. Cash-for-clunkers failed and so has Moolah-for-Mansions. The banks have hidden their losses and used the money to pay record bonuses once again.
20% unemployment and an economy that depends far too much on finance and homebuilding. A recipe for disaster when finance enrichens a few on Wall Street and we have record inventories of houses (as well as continuing bubble prices).
I think we will consider ourselves lucky to have 1 to 2% percent nominal growth for the next ten to twenty years.
Real growth will, of course, be negative, but not on Wall Street or in Washington, and isn’t that what really matters?
rjs,
You note that local/state tax revenue is 1.3T and equate that to local/state spending. But if your 30% shortfall is correct then local/state spending is closer to 2T (.7*2T = 1.4T) because the shortfall is being borrowed and then spent. So there is no short term hit to GDP. However, when local/state governments cut/freeze spending and/or raise taxes to balance the books, then we will see the hit to GDP.
You are correct to highlight the enormity of this problem. Our Federal governemnt increased it debty by borrowing/printing stimulus funds, some of which went to state governments to keep them ‘afloat’. As that flow dries up, local/state governments are cutting services/benefits/workers. It looks like government tax revenue will stay below average for the forseeable future so there will be a push for a bailout for states. It will be a tough sell. The government workforce is heavily unionized with higher pay and better pensions compared to the average private sector job. Maybe in a futre post, James or Menzie can explain the economic rationale for having taxpayers subsidize the unionization of public sector workers.
This article is missing an explanation of why you don’t see a double dip coming. Is there anything in this data that tells you that slow growth will continue for the rest of this year? You don’t say, not a word.
tj,
“The government workforce is heavily unionized with higher pay and better pensions compared to the average private sector job. Maybe in a futre post, James or Menzie can explain the economic rationale for having taxpayers subsidize the unionization of public sector workers.”
Until then you might want to bone up on the facts. A comparison between private sector and public sector pension plans is not at all straightforward. For example, a lot of public sector employees do not contribute to Social Security and so a portion of their defined benefits reflect an accounting shift from SS to a defined plan…towards which public sector employees do contribute the same amount as they would in FICA taxes. And if they quit the public sector and go work in the private sector, they will begin paying FICA taxes but will generally not be allowed to received SS benefits. And public sector employees are subject to criminal sanctions that private sector employees aren’t. For example, in the federal govt it is not only illegal to strike, but it is also illegal to quit a job without the government’s permission. This provision is rarely invoked, but rarely isn’t the same as never and I do know of a few cases in which the federal govt refused to allow key employees to quit in order to pursue a private sector job. This blurb from the Minneapolis Fed is useful:
http://www.minneapolisfed.org/publications_papers/pub_display.cfm?id=1353
In any event, the point of your post seems to be that ignorant voters will want to cut off their noses to spite their faces. Perhaps, but it’s hard to see how that helps a sluggish economy.
I agree with the overall assessment and the notion that the housing sector will not help the recovery this time. Neither should autos given the massive ramp up in auto ownership during recent years.
But I disagree that low bank rates are not helping. Low overnight rates and boosted central bank balance sheets are probably the key factors driving this recovery and helping oil, copper and other commodity prices stay high.
Professor,
Krugman has been talking about the possibility of a third great depression. It seems like much would depend on how Germany plans to react to the Euro crisis. Do you feel that the debt crisis in Europe won’t have an impact on the US growth?
Oh, really?
The last GDP figures have been revised down twice (so far) from a ridiculous 3.7 to a supremely optimistic 3.2 to, currently, a merely hopefully 2.7 (with another revision to 2.5 in sight) and that was achieved with around 1.7 trillion stimulus money. To give that some perspective; 1.7 trillion is 12% of the 2008 GDP.
With job loses still rising, long-term unemployment benefit recipients being knocked of the list in their tens of thousands, house prices still falling, most of the stimulus effects wearing off, 46 almost insolvent States (Illinois and California have had CDSs close to 300 for the last two months higher than Portugal or Romania) in dire need of a 120 billion dollar bail-out now and another 400 for next year, state and Fed tax receipts way down, the Agencies sucking billions a month due to continuing defaults, weekly hours down, hourly rate down, consumer spending/savings numbers still going the wrong way (look at Fed consumer credit numbers) and US consumers, who make up something like 70% of US GDP are going increase their buying? Why? Or more correctly How?
While you compose an answer; check out the Feds consumer financial data that shows that the same US consumers lost about 4 trillion dollars in net wealth last year. When Obama said that the US consumers cannot continue to drive world demand he wasnt kidding!
More proof? OK, look at the price indices (and inventories) retailers (and wholesalers) are not giving discounts because sales are strong, the growth is lousy even when compared with 2009 which were catastrophic. Most export-markets (China and the EU) are tightening up (look at rail and sea freight especially BADI) plus most forward indicators (JOC, ELI) going off a cliff and people are talking about growth! Again how?
A final Q3/4 2010 GDP rise of 2% maybe be optimistic which is: back to recession. The NBER and others can catch up in six months time.
Interesting hard data, provided there is any truth to the figures. However, some elements that aren’t part of this picture may contribute to an unexpected outcome should sentiment change.
It appears there is an unprecedented amount of liquidity stashed away by americans, enough to buy the entire sp500.
http://noir.bloomberg.com/apps/cbuilder?ticker1=MZM%3AIND (cash+deposits+moneymarket)
I bet there is a similar graph showing companies hoarding cash. Bottom line: it looks like a consumer spending strike which turns into companies’ capex strike which leads to no job creation and a stalled economy that is beginning to move sideways. More than unleashing a new credit orgy, a steady confidence built-up may provide a real jump-start.
How much cash was stashed away by the public, by banks and by companies during 1929-1932? This recent deflationary incident may not be long lasting. Or, it may turn into an eternity if politicos can’t find a way to make the public believers again.
tharm,
I think that’s a little bit of a misinterpretation of what Krugman is actually saying. He is saying that the current recession is comparable to the 1873 global depression and the 1930s meltdown in that all three were global and were the result of financial sytem meltdowns as opposed to supply side shocks. I believe Krugman’s position is that it is quite possible that the current economic slump might feel like a double-dip in the sense that job recovery may take the better part of a decade even though GDP growth might be nominally positive. So by technical scoring it won’t show up as a double-dip, but to unemployed workers this will largely be a distinction without a difference.
Economic forecasts, as I say, are infallible (as was my forecast for May). The economy cascades downward in every month of the 4th qtr – Oct, Nov, & Dec. (baring added fiscal & monetary intervention/stimulus), with the DOW falling to 6,547. The bottom is in July of 2011 (with the DOW falling to 3,300).
Why? Modern monetary theory & thus policy is contractionary.
Take the Great Depression as an example. In 1936 reserve requirements were raised by 50 percent to “mop up” excess reserves (largely due to the increase in our monetary gold stocks). Then reserve requirements were raised once more in 1937 (by 33 percent). This lead to the 1937-38,sharp recession within a larger depression.
Contrary to the “experts”. Today the FED pays interest on the member bank’s excess reserves. For this reason, IORs have caused huge portfolio shifts in the earning assets among the commercial banks ($1,027,063T in new excess reserves as of June 30th).
These portfolio shifts have induced system-wide bank credit contraction (the remuneration rate on IORs will have exceeded all 4-week, 3-month & 6-month Treasury bills for 2 years as of this Nov 5th).
Because of IORs, the FED is “pushing on a string”. I.e., we don’t have a zero interest rate policy (ZIRP). The interest rate “floor” is the remuneration rate (the interest rate on excess & required reserves), now applied @ .25%.
This floor has induced an incalculable volume of dis-intermediation among the non-banks (an outflow of funds to the credit and money creating commercial banking system), and has vastly reduced the money velocity of the financial intermediaries (where savings equal investments).
Today monetary policy is more contractionary then the Depression era measures, because, unlike just raising the reserve ratios, and the member bank’s required reserves back then, IORs have induced both massive dis-intermediation among the non-banks, plus bank credit contraction.
Welcome to the second Great Depression.
2slug,
hmmmm…decisons…decisons, Should I choose A or B?
(A)goverment pension vs (B)potentially insolvent SS system with an increasing likelihood I will not receive any benefits. I’ll pick (A) every time, even if there is a less than 1 in 100 chance I might not be able to quit my government job when I want to.
By the way, do those unionized government workes have to work until the same age as private sector workes to receive their full retirement benefits?
Will a governemnt union worker receive the same retirement benefits as a private sector worker in a similar job? (Ignoring the fact that the private sector worker paid FICA tax his entire working life in addition to paying additional taxes that helped cover the government worker’s pension.)
Is working for the government so distasteful that taxpayers need to provide both higher pay and better benefits compared to many comparable jobs in the private sector?
Public sector unions aren’t good for much outside of making it hard to fire useless employees. They certainly don’t have much effect on government sector compensation. (If you think it is otherwise, consider and compare compensation of federal and state and local government enployees. You certainly wouldn’t argue that federal employee unions were in any way effective.)
Most government employees are meek types who prefer certainty of employment over higher wages. Politicians have set up a system where they have encouraged public sector workers to sacrifice higher pay for better pension benefits, but then they never funded the benefits. State and local public sector employees are in for a rude surprise if they have counted on these promises.
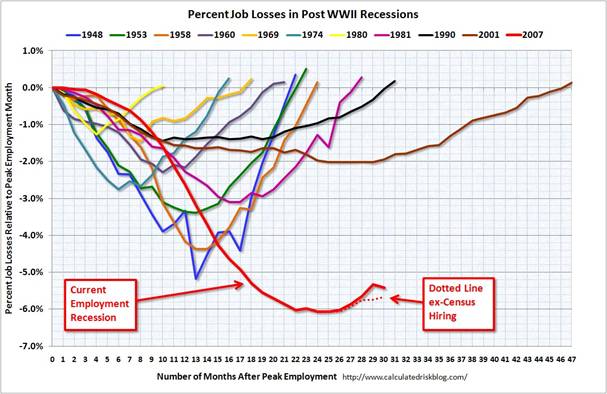
JH – you know as well as anyone that the present recession is more comparable to what happened in 1930 (financial sector stress and a huge debt overhang) than any of the post-war recessions. Why the graph comparing recessions without the GD1 experience?
tk,
First, Social Security is not insolvent and there is zero chance that it will be insolvent. Checks will still come out of SS as long as people pay FICA taxes. There is some risk that benefits might be less than promised (but note that even then they will be 125% of current benefits). The risk of insolvency for public pensions is a lot greater. Not really even a close call.
“By the way, do those unionized government workes have to work until the same age as private sector workes to receive their full retirement benefits?”
Yes, at least that’s the case with federal employees. In some cases you can retire early (age 55), but at a very steep discount in terms of benefits. And there are very few employees still on that old CSRS plan. That’s been dead for 25+ years. If you want to retire with full benefits, then you’ve got to work until your 66 or 67, depending on your birth year.
Also, CSRS federal workers did not pay FICA taxes, but they had to pay exactly the same amount into the CSRS system, so they weren’t getting away with anything. The difference is that any FICA taxes they paid while working in the private sector were forfeited. I believe that’s how it is with most state and local plans today.
From this and some of your other posts I get the sense that you work in a low paying, dirt job and feel a lot of resentment towards public sector employees. The govt is not the best employer, but it’s also not the worst. If your standard is that public sector employees should be compensated based on the worst private sector compensation package, then I guess you’re just practicing the politics of resentment. Congratulations, that makes you a fellow traveler of the Tea Party.
2slug, don’t let the facts get in your way. Keep spinning…
Check out the opinion section of the July 6th Wall Street Journal, or at http://online.wsj.com if you have a subscription.
*************************************************
“The Government Pay Bonus ”
A few excerpts-
…Even using all the standard controlsincluding race and gender, full- or part-time work, firm size, marital status, region, residence in a city or suburb, and morethe federal wage premium does not disappear. It stubbornly hovers around 12%. Most academic studies dating back to the 1970s have found similar pay differences.
…In addition to the wage premium, federal workers enjoy more generous fringe benefits than do private workers. For instance, federal workers receive a defined benefit pension with benefit levels comparable to those from private 401(k) plans, except that federal workers contribute only 0.8% of pay and are not subject to any market risk. They also receive employer matches to the defined contribution Thrift Savings Plan that significantly exceed the typical private employer match.
…A federal pay premium is unfair both to private workers, who receive less than their government peers, and to taxpayers who must cover the difference. Given our 2.7 million-strong federal work force, the government effectively overbills Americans by almost $40 billion every year just on labor costs.
… total compensation for federal workers may easily exceed $14,000 per year more than an otherwise similar private employee.
*************************************************
I don’t begrudge anyone with a government job. All I am asking is why has the public sector become so heavily unionized and why do public sector workers deserve better pay/benefits than equivalent private sector counterparts?
By the way, the last paragraph in your prior post is very revealing. It’s a common tactic. If you can’t dispute the facts, then resort to insults.
tj,
Sorry, but you’ll need better sources than the WSJ. Why not try going to the tsp website:
http://www.tsp.gov
I don’t know where the WSJ got that 0.8% figure, but it’s flat wrong. The govt contributes 1% of pay automatically. The govt will also match employee contributions up to 10%. That is fairly typical for a lot of large corporations. Of course, there are plenty of lousy companies that don’t match, but again, the baseline shouldn’t be the worst employers. And oh…funny that the WSJ didn’t mention their own retirement and benefit plan that they offer to their employees. I think most people would say that it is far more generous than anything that the Feds offer. See for yourself.
http://nyjobsource.com/dowjones.html
It’s up to 5%. Full matching for the first 3%, .5 for the next 2% for a total matching of 4% + the 1% automatic contibution for a total yielding 5% gov contribution for 5% employee.
Looking at my pay stub, FERS is about .7% of my gross. I don’t know what the benefits FERS pays out are.
http://federalretirement.net/fers_annuity.htm
Double Dip Recession? HAH!
Try a Double Dip Depression.
All you have to do is look at the fiscal condition, entitlement liabilities, pension shortfalls, and dropping tax revenues, of at least 46 states out of 50, and that will give you all the insight about where we currently are and where we’re going.
If anyone thinks (including professors) that this trend can continue for ‘years and years’ vis a vis 2% fairytale growth rates, all I can say is…………
LAY OFF THE BOOZE.