What will be the economic effects of this week’s developments in Libya? We have a fair amount of historical experience from which to try to answer that question.
In a recent paper, I surveyed the history of the oil market with a particular focus on major price movements and their economic effects. The table below summarizes the six episodes since World War II in which geopolitical events led to significant disruptions in the supply of oil. The last column reports the amount by which global oil supplies were reduced as a percent of world production at the time. The first five of the episodes listed in the table were followed by economic recessions, whereas the last was not.
| Event | Date | Lost output |
|---|---|---|
| Suez Crisis | Nov 1956 | 10% |
| OPEC embargo | Nov 1973 | 7.5% |
| Iranian revolution | Nov 1978 | 7% |
| Iran-Iraq War | Oct 1980 | 6% |
| Persian Gulf War I | Aug 1990 | 9% |
| Venezuela and Persian Gulf War II | Dec 2002 | 4% |
The table just reports the reduction in the flow of oil from the countries immediately affected by the events. In each case, there were production increases elsewhere in the world that offset some of the declines. For example, the Venezuelan strikes in 2002 and losses in Iraqi production in the Second Persian Gulf War in 2003 were pretty quickly made up for elsewhere.
|
Libya recently accounted for a little over 2% of global oil production. If this is entirely knocked out, it would represent a shock that is only 1/3 the size of the smallest of the first 5 historical disruptions summarized above, and perhaps comparable to Venezuela-Iraq in 2002-2003.
| Country | Oil production | % of world total |
|---|---|---|
| Lebanon | 0 | 0.0 |
| Tunisia | 80 | 0.1 |
| Yemen | 258 | 0.3 |
| Sudan | 508 | 0.6 |
| Egypt | 662 | 0.8 |
| Libya | 1,789 | 2.1 |
| Algeria | 2,157 | 2.5 |
| Iraq | 2,384 | 2.7 |
| Iran | 4,237 | 4.9 |
| Saudi Arabia | 10,187 | 11.7 |
Next let’s take a look at the likely economic consequences for the U.S. Americans consume about 140 billion gallons of gasoline each year. I use the rough rule of thumb that a $10/barrel increase in the price of crude oil translates into a 25 cents per gallon increase in the price consumers will eventually pay for gasoline at the pump. Thus $10 more per barrel for crude will leave consumers with about $35 billion less to spend each year on other items, consistent with a decline in consumption spending on the order of 0.2% of GDP in a $15 trillion economy. The recent turmoil in North Africa has been associated with perhaps a $20/barrel increase in the price of crude and so might be expected to shave half a percent off GDP from this rough calculation.
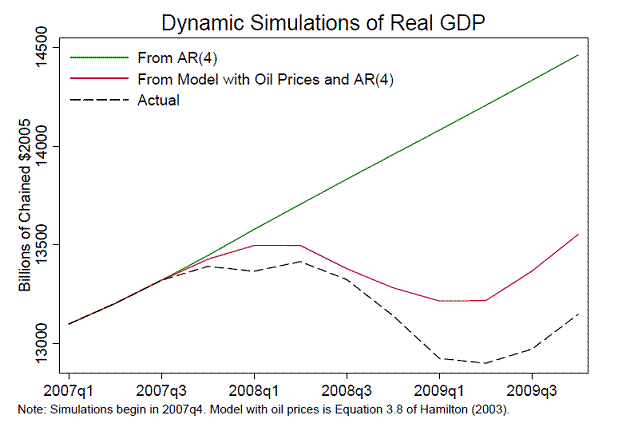
After the first five events listed in the first table above, the actual drop in consumption spending was considerably larger than rule-of-thumb calculations like these would suggest. My interpretation is that these arise from multiplier economic interactions. For example, one of the things we would see historically is a sharp drop in sales of domestically manufactured, less fuel-efficient vehicles. As employment and income in the auto sector declined, the individuals affected cut their spending on other goods, and the final drop in spending was significantly larger than that attributable to the burden of higher energy costs alone. Rising consumer pessimism that correlates with the higher energy prices also seems to have played a role. The figure below, adapted from my 2009 Brookings study, is an estimate of the degree to which these kind of nonlinear multiplier effects of the oil price increase of 2007:Q4-2008:Q2 could have contributed to the initial phase of the most recent U.S. recession. The solid line is a simple forecast for GDP over 2007:Q4 to 2009:Q4 based solely on what had been happening to GDP over 2006:Q4 to 2007:Q3 and extrapolation of the trend. The red line is a forecast based solely on GDP over 2006:Q4 to 2007:Q3 and the observed behavior of oil prices over 2007:Q4 to 2009:Q4, as predicted by a model I published in an article in the Journal of Econometrics in 2003. The dashed line is the actual behavior of GDP as we subsequently observed it.
|
How big might we expect those multiplier effects to be in the current setting? Detroit is selling more SUVs than it did at the low point of the downturn, but nowhere near back up to the levels of 2007. There just isn’t as far to fall, and not as much a bite autos can take out of GDP, given current conditions. Having recently seen $4 gasoline, I don’t think creeping back above $3 has the same psychological shock value. That suggests to me that the erosion of consumer confidence should be less severe. The gains in employment that I believe are underway are another important offsetting plus in terms of what’s going to happen to consumer sentiment.
|
The particular dynamic model from which the above Brookings figure came builds in quite strong nonlinearities and threshold effects. Interestingly, according to that specification, one wouldn’t begin to anticipate significant effects on U.S. GDP until the price of oil got above about $130 a barrel, or until the second half of this year. Prior to that, according to that specification, we’re still ok.
I don’t want to make too strong a claim about those particular details. It’s very hard to claim precise statistical evidence in support of one choice of a threshold over another. But, this particular model has held up fairly well since its original publication in 2003. So I’m not about to abandon it just yet.
My bottom line is that events as they have unfolded so far are not in the same ballpark as the major historical oil supply disruptions, and are unlikely to produce big enough economic multipliers that they could precipitate a new economic downturn. They might shave a half percent off annual GDP growth, but I don’t anticipate a whole lot worse than that.
But the worry of course is that the big geopolitical changes we’ve been seeing didn’t stop with Tunisia, and didn’t stop with Egypt. So maybe it’s not a good idea to assume it’s all going to stop with Libya, either.
|
Barsky and Kilian (2001) pointed to a number
of other factors that would have warranted an increase in the relative price of oil in the
early 1970s. Among these was the U.S. unilateral termination of the rights of foreign
central banks to convert dollars to gold. The end of the Bretton Woods system caused a
depreciation of the dollar and increase in the dollar price of most internationally traded
commodities. In addition, the nominal yield on 3-month Treasury bills was below the
realized CPI inflation rate from August 1972 to August 1974. These negative real
interest rates may also have contributed to increases in relative commodity prices
(Frankel, 2008). Between August 1971 and August 1973, the producer price index for
lumber increased 42%. The PPI for iron and steel was up 8%, while nonferrous metals
increased 19% and foodstuffs and feedstuffs 96%.
Those who do not learn from history are doomed to repeat it. 70’s stagflation started with the Dirty Fed debasing the currency to facilitate deficit spending in the wake of guns & butter debt. Sound familiar?
Break out your bell-bottoms, everybody!
I guess there are two questions here. One is the impact on the overall economy. This question I think you answered pretty convincingly. The other question is what happens to the particular market segments that are most sensitive to high fuel prices. Those two segments are the bottom 2 quintiles and the people living in a long distance commuting area (say Riverside County). My guess is that there will be disproportional response in those two populations which can cause the house pricing at the low end and at long commuting neighborhood to resume its decline. This all means higher mortgage default rates. Which brings the question of the health of the banks back to the forefront. The bottom line is that if this crisis persists old wounds might reopen.
You know, New York is still struggling. But go to Houston, and well, for a lowly Texas town, there’s an awful lot of high-end German and Italian metal to be seen in the parking lots of the oil services companies.
Not a coincidence, I think.
“But the worry of course is that the big geopolitical changes we’ve been seeing didn’t stop with Tunisia, and didn’t stop with Egypt. So maybe it’s not a good idea to assume it’s all going to stop with Libya, either.”
Of course, they will not stop until they get to Saudi and Iran and Central Asia. Libya will be over pretty soon, oil will drop some 5-8% back,but things are just starting.
This small peak in oil prices is just a beginning of a very rapidly unfolding process of supply instability, that, when Saudi, Kuwait (most likley) or Iran gets involved, will put oil at 130-140USD in April with no signs of it getting much cheaper in 2011. That would surely be high enough price to stop the USA recovery during the end of 2011.
The price of oil will fluctuate with these new events and once the world gets each event assessed, new ones will continue to appear. What about Russia, Nigeria etc? But the average price for 2011 can be safely taken in the range of 130-140 USD. What happens to the USA recovery then?
The popular myth is that Saudi Arabia has something like 4 mbpd of “Excess Capacity,” but again their recent net export history versus generally rising oil prices suggests otherwise.
Regarding Saudi Arabia, it’s really a story of two countries: (1) Saudi Arabia through 2005 and (2) the post-2005 Saudi Arabia. Let’s look at 2002 to 2010 Saudi net oil exports versus US annual spot crude oil prices (EIA):
From 2002 to 2005, the Saudis responded to rising oil prices with sharp increases in net oil exports:
2002: 7.1 mbpd & $26
2003: 8.3 mbpd & $31
2004: 8.6 mbpd & $42
2005: 9.1 mbpd & $57
But then we have post-2005 Saudi Arabia, when the Saudis responded to generally rising oil prices with declining net oil exports:
2006: 8.4 mbpd & $66
2007: 8.0 mbpd & $72
2008: 8.4 mbpd & $100
2009: 7.3 mbpd & $62
2010: 7.4* mbpd & $79
*Estimated
Post-2005 Saudi Arabia has of course shown the same pattern as Texas after 1972, i.e., declining production, relative to a prior peak, in response to rising oil prices.
In my opinion, what passes for excess capacity worldwide, including Saudi Arabia, largely consists of what Matt Simmons called “Oil stained brine.”
By increasing their output of “Oil stained brine” and by depleting inventories, I suspect that the Saudis could show some kind of short term boost in delivered oil, but I think that the time has passed when they could bring global prices down via a steady increase in net oil exports in excess of their 2005 annual rate. The Saudis have some new production coming on line, but that was true of other post-peak regions too.
For example, my frequent co-author, Sam Foucher, looked at new oil fields in the North Sea whose first full year of production was 1999 or later, and these new oil fields had a peak of about one mbpd in 2005 (versus the overall peak of six mbpd in 1999). These new fields, equivalent, at peak, to one-sixth of 1999 production only served to slow the overall decline to about 5%/year.
BTW, there were certainly have two stock markets in Saudi Arabia: (1) Through 2005 and (2) Post-2005:
http://www.tradingeconomics.com/Economics/Stock-Market.aspx?symbol=SAR
Interesting coincidence that the Saudi stock market crashed at precisely the same point that the Saudis started “voluntarily” reducing their net oil exports in the face of generally rising oil prices.
My year-end 2010 predictions on the ASPO-USA website:
No matter what specific years that one picks as the starting and ending points, the period from the late Nineties to the end of this decade was characterized by a double-digit average long-term rate of increase in average annual oil prices. For example, from 1998 to 2008 the average rate of increase in US spot crude oil prices was about 20 percent per year.
However, what I find interesting is the progression in three year-over-year annual price declines in the 1997 to 2009 time period: down to $14 in 1998, down to $26 in 2001 and down to $62 in 2009. Note that each successive year-over-year price decline was to a level that was about twice the level reached during the prior decline. If this pattern holds, the next year-over-year price decline would bring us down to an average annual oil price of about $120, in the context of a long-term average double-digit rate of increase in annual oil prices, which is what we are seeing in 2010, versus 2009.
Prof. Hamilton,
Thanks a lot for sharing your analyses and insigths. I wonder if oil-driven inflation in the face of heavy debt burden, and ¿falling median salaries? would have bigger impact than predicted, even if employment is growing.
Above table of empirical data is telling us that none of the five components of the matrix can make a rule singly or collectively,should exception not be tolerated.
On the supply side with or without shortage of oil, recessions or pick business cycles are bound to happen.
Not so easy
In June 73 a quick reading of the same table would drive to the conclusion oil shortage was leading to a pick business cycles
but even more difficult
M Chinn (Petroleum Prices and the International Dimension Econbrowser) is showing a clear correlation between decreasing consumption and prices,a non disputable time series correlation between actual price and future prices.
Where it is getting tricky,is to provide for a timing of the event
“Short run price elasticity of oil demand (as well as supply) is usually considered quite low. Then small shifts in the demand curve should induce relatively large movements”
Speculation has not been given a word,is speculation driving the economic crisis or merely preceding the crisis?
Some info on oil speculation Air transportation Last revised 2008
http://www.raa.org/LinkClick.aspx?fileticket=UdLS10ZUbgU%3D&tabid=176&mid=647
Unfortunately above link is no longer available through gogle .This very informative study has been preserved in its essence by the economic populist “In BP we trust”
Go to the web page and see references “Some info on oil speculation Air transportation Last revised 2008”
For a better lecture from the democracies and a better reading of the same democracies.For a better assessment of stocks inventories.
The material issues could be somehow alleviated,should the net derivatives purchasers of calls on all movable,consumable items be compelled to take physical deliveries of their purchases at contract term (warehouses,offices or private domiciles). The UNDP would be able to locate the shortfalls,then purchase at markets prices and supply the same, to those in needs.
Some info on oil speculation Air transportation Last revised 2008
http://www.raa.org/LinkClick.aspx?fileticket=UdLS10ZUbgU%3D&tabid=176&mid=647
Unfortunately above link is not available anymore through gogle (not the first time that gogle, has modestly given up its efforts to compete with the Alexandria library).This very informative study has been preserved in its essence by the economic populist “In BP we trust”
OK. Stupid stuff of elite folks. Oil goes from 80$US to 120$US and nothing to worry about? ‘Tis why one does not invest based on folks that got their econ degrees from Berkeley and have yet to make the list of billionaires. And never forget, economist that work for governments/public institutions have no skin in their predictions.
Doesn’t Libya export around 3% of the world market (that’s what I get when I go to the EIA link and look at oil exports)? I’ve never understood the infatuation with production – if a country consumes the oil in its borders, it doesn’t matter that much to the rest of the world how much they produced, does it? If I’m going to pay a price at the pump that’s related to world oil prices, what matters is how much goes onto the world market, and what percentage of traded oil that represents.
3% still probably isn’t enough to break the bank, but combined with higher food prices from a partially failed Chinese wheat harvest, it’s enough to make things painful for much of the world.
Professor, I was just listening to you on Bloomberg Radio. However, you’ve mentioned you weren’t sure how “Twitter” works; here is a great link: http://tweeternet.com/. No, I don’t work for Twitter, but please let me know if you deiced to join so I can follow 🙂
AB
While the absolute impact of oil increases may be smaller with high unemployment and stagnent wage growth the ability to pay and the negative cascade in consumer sentiment will spill into casual dining clothing sales and big ticket purchase. The negative effects of high oil feel more like the stagflation of the 70s than the recent past katrina based shock
Thank you JDH. And congratuations. You expected another oil shock and cosmic powers smiled sweetly upon you and delivered, faster than any of us ever expected I suspect. I agree with your conclusions. I don’t believe that long-time Libyan observers saw this revolt coming and who knows how these popular revolts against regional authoritarian governments might further spread.
Libyan oil production has declined to 1,6 M bbls/day from the 2009 average production rate of 1,8 M bbls/day. If Libyan production losses actually matter and there are any delays in restoring production, we should observe a narrowing of the light/heavy oil spreads. To the best of my knowledge, natural gas exports to Europe continue unabated. I strongly suspect that many Europeans are currently considering how to accelerate environmental assessments of new shale oil and shale gas exploration and development projects.
The fluctuations in the discount of WTI to Brent Crude are interesting to observe. I suspect that the daily movements are mostly noise. But the US$10 to US$15/bbl difference may hint at the incremental production potential of new unconventional oil extraction technologies.
P.S. Kudos to the Obama regime for grasping non-aligned movement politics and making it work in the interests of all American citizens and America’s allies
.
I haven’t anything to add to the dialogue. I just want to say great numbers and great graphs. I think this is the best economics blog on the internet. Roubini trying to cash in with “premium” content and Krugman “getting off” on politics and his own yammerings. This is solid analysis here and I appreciate it very much.
My February 6th graph of Brent price development seems rather accurate:
http://saposjoint.net/Forum/download/file.php?id=2609
It does not forecast anything good for the USA recovery in 2011, in fact, it does forecast a double dip in Q1 2012.
“But the worry of course is that the big geopolitical changes we’ve been seeing didn’t stop with Tunisia, and didn’t stop with Egypt. So maybe it’s not a good idea to assume it’s all going to stop with Libya, either.”
Not only am I not going to worry about the demise of African/Middle East dictators, I am going to cheer it on – even at the cost of higher oil prices.
There is no guarantee that the new governments that evolve in these countries will be any better (see Iran post revolution) but at least the window is open and there is the potential for improvement.
James, I enjoyed reading your post. This is a solid piece of work.
Saudi Arabia will be the key in this matter …
I wonder how the US gov will react due to the upcoming change of their saudi puppet regime.
US oil consumption to private GDP is at or near 7%, which is where it was in ’79-’80 and ’07-’08, prior to the worst recessions since the Great Depression; and this time it is occurring with the U rate at 9-17%.
Moreover, with oil consumption and imports at parity for the three major trading blocs at peak global oil production, there is no margin of safety for marginal global supply disruptions, which will now pass through quickly to the global mfg. and distribution chain, increasing price volatility, encouraging forward leveraged speculation, and increasingly cutting into profit margins and subsistence incomes for the vast majority of the world’s population, including the bottom 80% of households in the West.
During secular bear market eras, there is an increase in the number of recessions and stock bear markets, which is likely to happen this time. Those using the ’80s-’00s template, anticipating the benign “mid-cycle pause”, as in ’84, ’94, ’04, and ’04, will be surprised by the relative abruptness of the profit, investment, and GDP deceleration ahead, along with the increasing probability of a China-Asia crash.
The improving mfg. conditions are erroneous cyclical extrapolations resulting from the massive Fed printing and talking up price and asset inflation, and gov’t deficit spending, pulling forward economic activity from future quarters, which will soon be seen as misplaced, prompting an abrupt shift downward in orders, production, and employment going into the spring-summer.
There is no sustainable underlying organic private sector impetus for growth after gov’t deficit spending of 15-16% of private GDP and Fed printing of one-third of M1 and 30% of the monetary base. Once it is realized by businesses and Wall St. that this unprecedented level of artificial stimulus to an otherwise moribund private sector is unsustainable, the next business cycle downturn will already be underway.
The secular pattern for stock prices suggest that the market has been topping now for 3-10 months, setting up for another crash into ’12-’13.
Sell and prepare for the next cyclical bear market of the secular bear market and slow-motion debt-deflationary depression made worse by the ongoing structural effects of Peak Oil and population overshoot.
http://business.globaltimes.cn/china-economy/2010-02/507404.html
Note that China is likely to be the one most directly affected at the margin by Saudi Arabia being forced to turn inward and deal with the domestic demographic challenges and attempts to avoid social unrest.
Few understand just how close to peak oil exports Saudi Arabia is and how that will exacerbate the structural effects now occurring from Peak Oil.
Moreover, China is highly vulnerable to marginal supply disruptions from Saudi Arabia at the same time the US is likely to occupy the country’s oil fields and dictate production, quotas, and distribution should a crisis occur and the Saudi puppet regime fall.
This is one of many scenarios that would place China in the unenviable position that Japan was in the late 1930s, making China highly vulnerable to an oil-induced implosion.
China is a four-letter word: SELL!
EDITED: ….. If Libyan production losses actually matter and there are any delays in restoring production, we should observe a WIDENING of the light/heavy oil spreads. Refinery margins for heavier grades of oil should improve.
Is Saudi a US puppet regime? Not since 1973 at latest, I would think. I think King Abdullah is entirely capable of making up his own mind.
On the other hand, both the US economy and political climate is highly exposed to Saudi oil policy. The deployment of Saudi production reserves will be critical in determining economic growth in the US, as well as US elections in 2012.
(See “An Oil Shock in 2012?”)
Who will be in charge in the Kingdom at that time, however, is less clear.
Thanks Professor Hamilton, great work, as always!
Any concerns based on the fact that Libya has light sweet crude which according to the nytimes is more significant than if the outage came from the heavier black stuff?
Thanks!
Jim,
Excellent presentation. Many thanks.
MG
Hypothesy: 100$ increase in oil price —> about -2% direct effect in GDP —> about -4% overall.in GDP
Is that wrong?
Thanks
It is truly a shame that economists must always think in terms of “the economy” measured by a GDP number, whereas it has been becoming clearer for literally decades that America has two economies, one where the top decile of income earners live, and one where the rest of the people live.
It is easy to see that some large part of 90% of that extra $70 billion people must now spend on gasoline will be spent by those who are already up against the wall financially. A recent survey showed that 77% of Americans live paycheck to paycheck, and their are other scary numbers — 29% of Americans find it difficult to afford food.
So Jim, your sanguine conclusions about the effects of the price rise stemming from the relatively small Libyan supply shock do not do justice to what is really happening in Main Street America.
And this is yet another reason for American “consumers” to be distraught about the current state of economic thinking about social issues, thinking in which they are basically not represented. It’s not a great feeling you have on that day when you realize that some economist’s calculations have rendered you invisible.
May I suggest,to read as they exemplify the existing gaps in knowledge between pricing and sources of pricing (cause and causation)
An academic view of the OECD when reviewing the potential influence effect of index funds on commodities pricing
http://www.oecd.org/dataoecd/16/59/45534528.pdf
A professional address of this paper.
Review of Irwin and Sanders 2010 oecd reports
http://www.iatp.org/tradeobservatory/library.cfm?refID=107621
A recent Bloomberg entry on the topic – Feb 25, 2011
Hedge Funds Cut Food-Price Bets as Grains Take a Fall
O/T,
Dr. Hamilton, there are two good oil articles in the nytimes today:
http://www.nytimes.com/2011/02/25/opinion/25lynch.html?hp
http://www.nytimes.com/2011/02/25/business/economy/25econ.html?_r=1&hpw
What most people ignore is the impact oil production has on our trade deficit. Every bit we produce cuts our trade deficit by almost double. The same for tax revenue; every dollar produced is not only an increase in tax revenue, but a decrease in an expense written off.
Then, there is the signaling factor. Simply doing serious and agressive exploration turns the pressure up on current producers.
Since a good 30% of the price of crude today is based on speculative investments via Federal Reserve rich ‘investors’, I can’t see your historical stats being relevant to today’s oil price dynamics.
Libya today represents 2% of production but 3.5% of world exports. One could argue that the impact will be far greater than even the oil shock of ’73, since at that time the US imported only a small fraction of its oil and the net wealth transfer as a result of high oil prices was primarily from US consumers to the US producers. The price of oil tripled or quadrupled during that shock, I believe. And it is far from clear that we are at a new equilibrium price given the unavailability of 3.5% of global exports to world markets. The consequences of this shock could be far worse for the developed economies despite the loss of total global production being lower.
Do not forget that Saudi Arabia has lied about its oil reserves, as indicated by the cable Wikileaks.
In addition, the report of Nomura does not rule out oil reaching $ 220 .. and soon
So I suggest watching the interview to Guy McPherson is of 2008!
mamvas, see my second times link regarding Saudi oil.
Oops. I mean first link.
Professor Hamilton makes a major error interpreting his own data. In the first chart showing the 5 declines in production he states that these are declines of x percent in the area affected by the crisis. Then later he states that Libya produces 2.1 percent of world oil and therefore the hit is roughly only 1/4 of the previous 5 declines. Instead he should have taken his second chart of the countries affected , taken the total of their production roughly 25 million barrels a day and then divided Libyas 3 million barrels per day. In that scenario the percent decline of this sixth world production interruption would be 12% or —so far–higher than any previous decline.
Mark Kelly: Your criticism is beyond silly. The percentages refer in every case to dividing by total global production at the time.