On a recent visit to UCSD, NYU Professor and Nobel Laureate Rob Engle called my attention to the NYU Stern Volatility Laboratory, a great resource that anyone can use to get some very interesting real-time analysis. Here I’d like to describe some of the features available for assessing the systemic risk posed by financial institutions.
The first step that Engle and colleagues propose is to calculate what they call the Marginal Expected Shortfall (MES) associated with a given financial institution. This is an estimate, based on recent dynamic variances and correlations of observed stock prices, of how much the stock valuation of a given institution would be expected to fall today if the overall market were to decline by more than 2%. This is essentially a time-varying tail-event beta, details of whose estimation can be found here.
They next used a dynamic simulation to extrapolate from the MES an estimate of how much the stock would fall in the event of a full financial crisis, defined as a 40% decline in a broad market stock index over a space of 6 months. They estimate this number to be around 18 times the daily MES.
The last step is to compare the magnitude of the decline with the firm’s current equity and liabilities, and calculate how much more capital the firm would need to raise in order to remain solvent in the event of another financial crisis. This measure, which they describe as the “systemic risk” associated with the firm, can either be reported in terms of how big the shortfall of that firm would be (in billions of dollars), or in terms of the percentage of the shortfall across all financial firms contributed by that single institution.
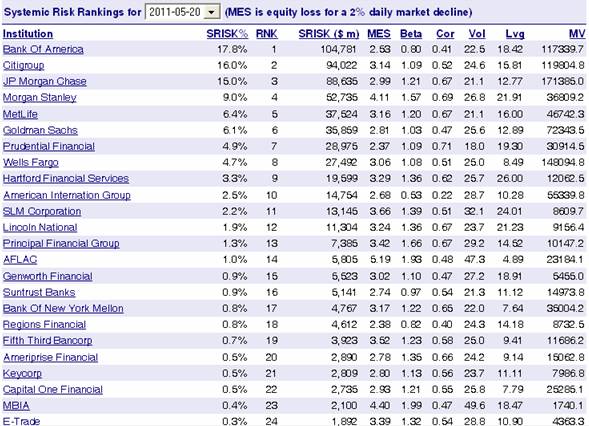
For example, here’s what their calculation gives you using Friday’s stock market data. If we were to experience a new financial crisis, three institutions– Bank of America, Citigroup, and JP Morgan Chase– would each need to raise about $100 billion, and between them would account for about half of the financial sector’s capital shortfall in the event of a major downturn.
|
By clicking on the heading for the Vlab page from which the above screenshot was taken, you can alternatively sort firms by any measure you like.
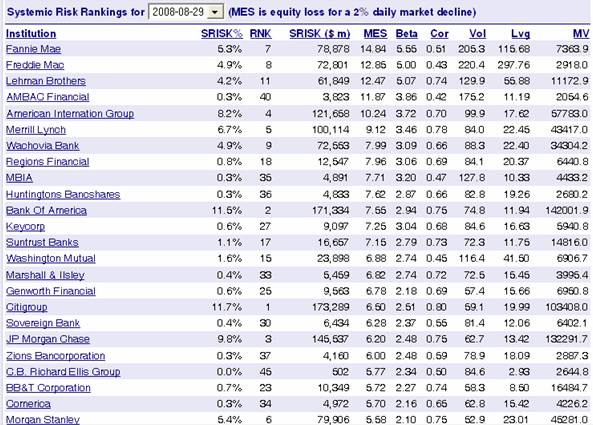
Another neat feature is you can go back in time to any date of interest. For example, here’s where things stood on August 29, 2008, right before the financial crisis, with firms sorted by MES. At that time, three firms: Fannie, Freddie, and Lehman– each had MES above 12, though several other institutions (remember AIG?) are assessed to have posed a bigger systemic risk.
|
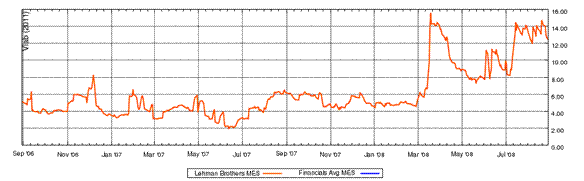
And here’s a plot of the path followed by the estimated MES for Lehman leading up to the crisis. Correlations among stock returns signaled Lehman’s growing vulnerability to a downturn.
|
I view these measures as a supplement to, rather than replacement for, other analyses based on direct linkages and derivative exposure. CDS could offer another useful market indicator. But the advantage of the NYU Stern approach is it can immediately draw out some of the implications of the latest stock market valuations and comovements for real-time use by regulators, investors, and business planners.
Didn’t almost all of the firms in the second chart need huge effective bailouts during the crisis? It looks to me as though the systemic risk for most of them was 100%
Wish someone, somewhere would construct this type of analysis using Mandlebrotian math instead of Gaussian.
Of course, the market declined a lot more than 2%.
“The last step is to compare the magnitude of the decline with the firm’s current equity and liabilities, and calculate how much more capital the firm would need to raise in order to remain solvent in the event of another financial crisis.”
I suggest doing this for the currency itself (not just the federal budget). Hopefully, this would get people to think about the concept of too much debt, whether public or private.
So 2008 created even bigger too big too fails. What is to stop Citi, JP, BoA and MS from goosing up risk. After all, AIG was bailed out, and between any probable collapse there are lots of bonuses to make!
Aig bailed out???? I have a 95% loss. I guess they bailed out that little 5% for me.
pete, your AIG stock should have been worthless.
If I understand this analysis right, they are trying to estimate capital needs based solely on stock price behavior. I guess if you’ve spent your entire career estimating volatility that might make sense, but to me it seems like an awfully naive way of going about it. What about looking at the actual loan portfolios held by the banks? Wouldn’t that be much more relevant?
Reading the positive contribution of the model of systemic risk estimates,it tells:
Shareholders,executives,board members of mostly financial companies about the magnitude of their social responsibilities.
It warns the controlling bodies of the liquidity requirement that may be needed in order to offset stocks prices downfall
It warns states representatives of the material and financial consequences that may occur should states financial support to the equities markets be withdrawn.
It drives to a status quo as regards the ways and methods of preservation of markets prices.
It does not tell
The shareholders,board members that they must make good for the capital shortfall.
The accountants that they should make a true representation of the state of affairs of the financial companies and or any companies.
The executives that they are liable for the misrepresentation of their accounts and wildful conduct of the business entrusted to them.
Most likely,this model invites all above food for thoughts all together
You always want more data: so here is what I want:
what affect would a 5% change in loan deliquency have on the capital requirements of the firm?
The key variable for the banks isn’t changes in stock prices, it is changes in the value of their loan portfolio’s.
A more accurate description of the bailouts would include the word bondholder. Our policy seems to be no bondholder will lose a dime – ever!
I agree with Brian’s post (at 7:22 am). Balance sheet equity is not stock market capitalization. In a crisis, the bank’s assets (loans, treasuries, bonds held, investments, etc.) will shrink in value until book equity is wiped out, thereby hitting insolvency. No sure why this study is focusing on stock market valuation, unless it is being used as a convenient proxy for the balance sheet process I just described. Am I missing something?
Brian and Mark: Agreed. The main advantage of the measure is that it’s so easy to calculate and update in real time. It’s for exactly these reasons that I advocate this as a “supplement to, rather than replacement for, other analyses based on direct linkages and derivative exposure.”
Engle and Co. look for the lost keys around the street lights because it would be too hard to look for them in the dark.
To take Brian and Mark’s point a step farther, Bernanke thinks that he has brought down the systemic risk because the Fed has successfuly managed to drive up the stock prices of financial institutions.
Talk about circular reasoning.
If MES is the response to a 2 percent market decline, and the estimated response to a 40 percent decline is 18 times the MES, it seems that they’re assuming a near-linear relationship between overall stock-market declines and the induced declines in financial stocks. I wonder about that.
Consider, for example, the Greek debt problem. If Greece repudiates or defaults on its sovereign debt, no doubt the European stock markets will fall some. But many of the European bank stocks will do more than just fall: absent some kind of bailout, they’ll become worthless.
Still, since market prices often incorporate information that is not widely known, regulators should be paying attention to them.
Jeff: Near-linearity was not an explicit assumption. The factor 18 was calculated by dynamic simulation of the nonlinear model.
This is a very interesting model!
But it only indicates systemic weakness that has been perceived by the markets, and that “market statement of weakness” may not be sufficient for either the management or the regulators…
First, the market (in the form of the MES “signal”) may not give the management enough warning, and second, as we saw repeatedly in 2008, even when the market is giving management warning, management typically ignores it and starts defying “the shorts”.
For the case of Lehman, the MES signal chart above would suggest the market failed to perceive Lehman’s risk of failure until March ’08. And twice between March and July the MES appeared to give an “all clear” signal. Did Lehman still have a chance in July, or was it already doomed? Would management have been willing to pursue a capital raise (dilution), or would they claim the market was “crying wolf” again? More importantly, does the MES tell you something you wouldn’t get from the stock price chart? Lehman had fallen 75% by the time the MES spiked again in July. If a 75% drop isn’t enough in and of itself to get management and regulators to take action, probably nothing is…
Furthermore, there are many black swan events which could pose a systemic risk yet not be recognized by this approach. Consider 9-11’s effects on companies in the World Trade Center… and imagine a terrorist nuke in NYC next… or after looking at the earthquake’s effect on Tokyo Electric Power Co., imagine if the quake had been a bit farther south and leveled Tokyo itself.
Finally, if this model ever becomes widely used, it will become worthless. The financial institutions’ survival demands market confidence, so they are always seeking to minimize the perception that they are risky. If systemic risk is measured by stock price fluctuations, companies will find ways to game their stock prices (…even more…). We already have huge difficulty getting adequate accounting and honest public statements!
Personally I think we need a real structural reform of how we do regulation, starting with elimination of the revolving doors, a lot more than we need new technical tools to tell who’s about to die and take the system down with them. Many many people knew the financial industry was a systemic risk in mid-2008, but if any of them were in charge, they were afraid to bite the hand that they hoped would continue to feed them…
The last step is to compare the magnitude of the decline with the firm’s current equity and liabilities, and calculate how much more capital the firm would need to raise in order to remain solvent in the event of another financial crisis. This measure, which they describe as the “systemic risk” associated with the firm…”
The definition of “systemic risk” the authors have created seems to be the risk that the system imposes on the firm, rather than the risk the firm imposes on the system. No harm in that. There is a long history of looking at finance at the firm level. However, for the purposes of dealing with systemic risk in the way that we as a society (rather than as investors) want to do, is this a helpful definition? I ask because there is that bit about “…the shortfall across all financial firms contributed by that single institution.” I’m just not sure that captures the dynamic of a systemic shock in the way we’d like.
Yep. Math it up all you like, but stock prices aren’t going to give you any insight into systemic risk, either on the system level or the firm level.
The way to figure systemic risk is to calculate the amount of fraud in the system and multiply it by the amount of ignorance. You can have quite a lot of either one or the other, but when you have too much of both (“too much” in this case a proprietary calculation), bankruptcy ensues. Or bailouts.
well welcome to VAR which has been around the financial and “risk managment” community and used and misused for 15 years.
how about the risk you have a pile of “fake” badly valued assets, and more real debt than the actual assets?