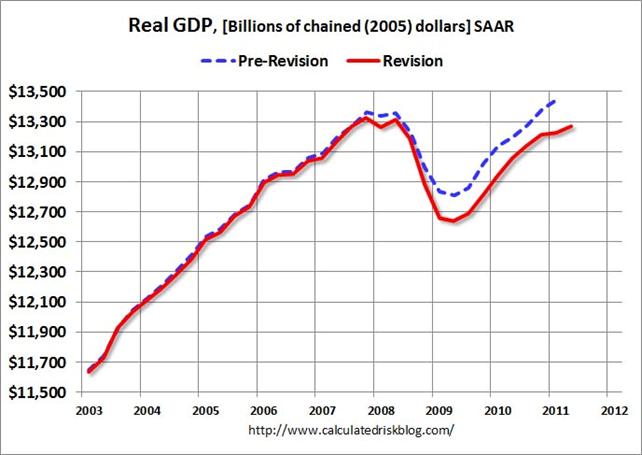
The Bureau of Economic Analysis reported today that U.S. real GDP grew at an annual rate of 1.3% during the second quarter of 2011, and revised down its estimate of first-quarter growth to an even more anemic 0.4%. We knew the first half of the year was disappointing, but this is even weaker than most of us were anticipating.
|
The downward revisions to previous quarters give a picture in which the level of real GDP is still not back up to where it had been before the recession started in 2007:Q4.
|
The latest numbers boosted our Econbrowser Recession Indicator Index up to 14.4% for 2011:Q1. This is an assessment looking back at the first quarter using today’s reported GDP figures, and is based on growth rates rather than levels. Although the growth has been very disappointing, so far it is not looking like a new economic recession.
|
In terms of the individual components of real GDP, downward revisions in consumption spending, inventories, and government spending account for the lower number now given for 2011:Q1 real GDP growth, and such growth as we had in the first quarter could now be attributed entirely to inventory rebuilding. The still-weak second quarter numbers reflect first and foremost a stagnation of consumer spending, led by a drop in consumer durables. State and local government spending cutbacks continue to drag, though in the second quarter these were partially offset by a modest increase at the federal level. Hard to imagine that won’t become a negative factor in the quarters ahead. Housing and business fixed investment are also not yet making the contribution necessary in order to get the above-average growth that could get more Americans back to work.
Phil Izzo has his usual invaluable survey of other observers, none of whom manage to put any lipstick on this report, other than the hope (and for many analysts, the expectation) that the second half will be better.
What is infuriating about this situation is that it was all predicted back in 2009. It seems that too many economists have forgotten the lessons of the Great Depression and what happened in 1937.
Obviously, the deficits aren’t big enough!
And bring on QE3 while you’re at it!
I don’t want to toot my own horn, but I predicted this on November 4, 2008 (later in the evening). I think my exact words were “We’re (expletive)!”
Not to worry, Menzie will spin it to make Obama’s ball n chain keynesian house-wrecking policies look good. And old slugboy will cry that all we need to do is SPENT more…..yes sir, spend until the ugly girl looks pretty….
Back out the gov’t borrowing and spending of an equivalent of 50% of private GDP (GDP less total gov’t spending, including personal transfers) since ’08, and the gov’t spending and Fed printing merely prevented an additional 20-25% contraction in GDP.
Similarly, the avg. trend rate of real per capita private GDP since ’00-’01 has turned negative, reducing real per capita private GDP by 25% below would otherwise would have occurred at growth continued at the long-term trend rate from ’00.
Now with the public sector drag set to take hold along with the Boomer demographic drag and structural constraints from peak global oil production, falling available net oil exports (exports less Chindia demand, credit to Jeffrey Brown) and related high energy and food prices, there is no underlying structural impetus for domestic private sector US growth. Thus, the secular trend rate of real per capita private GDP will continue to contract, with overall real per capita GDP following later in the decade.
From a secular macroeconomic perspective, we are where we were in the deflationary depressions of the 1830s-40s, 1890s, late 1930s before WW II, and ’00-’01 in Japan.
Real per capita total gov’t spending has grown 3% faster than real per capita private GDP for 10-11 years, implying that total gov’t spending must be reduced by at least 30% over the next decade and into the mid-’20s, resulting in an unprecedented fiscal drag on US economic activity. The 20-25% additional contraction in GDP we avoided from ’08 will be given back cumulatively over the course of the coming decade.
Continuing weak or contracting bank lending and slowing growth and reduction of gov’t net dissavings will hit hard M2+ (M2 + institutional MMFs), which will grow in net terms only to the extent that financial assets are liquidated and the Fed incrementally prints reserves.
The combined fiscal, net energy, and demographic constraints will subtract 2-3% from post-’00 trend GDP, resulting in a trend real rate of GDP of ~0% and 1% for nominal GDP.
Despite the fiscal mess, the implied slow or trend nominal GDP growth suggests that the 10-yr. Treasury yield will fall well below 2% in the years ahead.
Economists, politicians, CEOs, Fed policy makers, and financial media pundits will be stunned and confused (at least publicly) at how large an effect the US fiscal drag will have on US and global economic activity, stock and commodities prices, and interest rates in the years ahead.
About the only good thing you can say about this report is that it eliminates all of those arguments about the breakdown of Okum’s Law, and structural unemployment, and Taylor’s Rule. It turns out that economic performance wasn’t in contradiction to the rules. It was the numbers used in the calculations that were faulty. It turns out that this isn’t a mysterious jobless recovery. It it a recoveryless recovery.
Why you people follow them, amazes me. Anybody in their right mind would know the contraction was deeper than the BEA said.
That said, the first quarter still isn’t adding up. Reminds me of the first half of 1995. Like what?
Uh, Robert, where is the “Keynesianism”, not seeing it. Your pathetic ideals are what lead toward government siezure of capital markets in the first place. Then the economy will grow. Yes it will.
Exports were a good news story, but given the mess in Europe and the latest GDP report out of Britain, you have to wonder how long we can count on net exports for growth. But hey, Tea Party types keep preaching austerity economics!!!
Meanwhile, down here in Houston it’s a boom town. Everyone’s hiring, business is strong, the clients are clearly price insensitive. Some quotes: “If you can make it, they’ll buy it”; “everyone’s capacity is committed”, “they keep jacking up the prices on the operators (oil companies), and they’re mad, but what can they do?”
The last time we saw an environment like this was mid-2007, I would say. The city continues to suck in talent from the northeast and midwest. I met a corp. development guy who had moved from Indiana; strategy guy used to work for Morgan Stanley in New York. It is changing the feel of the city, I think.
In any event, all of this–both the Houston boom and the grim, recent GDP data–remain consistent with an oil shock.
I don’t want to toot my own horn, but I predicted this on December 12, 2000 (after the Supreme Court declared democracy unconstitutional). I think my exact words were “We’re totally @#$%^&!”
With the current revisions we now know that real GDP grew at an average annual rate of 1.4% from 2001Q1 through 2009Q1, the worst rate for a two term president in the 235 year history of the United States. It will take decades to clean up the mess from the fiscal and economic train wreck known as the Presidency of George W. Bush.
Shale oil is looking very strong. Both recent reports and meetings with industry suppliers suggest that the resource is very large, widely dispersed and economically attractive.
One client reports shales are viable at $40-50 / barrel, and that new shale fields are continually popping up: not only the Bakken and Eagle Ford, but the Unita, Niobrara and the Permian Basin in west Texas, and others as well.
Some analysts expect shale oil production to rise from around 600 kbpd in 2010 to near 1.4 mbpd in 2012–an annual increase on the order of 400 kbpd. On these trends, US shale oil output could exceed the current crude output of Iraq by 2015 or so.
And unlike natural gas, oil prices are set globally. Thus, high prices could persist for a long time, supporting a shale oil boom that could last for much of the decade.
It may be premature to call it a “revolution”, but not by much. Given the current tightness in supply, shale oil could prove truly transformative for the US economy.
The same thing has been happening in Britain. There the government announced austerity, implemented it – it’s really just beginning to bite – and argued that increased confidence would cause contraction to be expansionary. They also bet on more exports, a dodgy guess considering the pound had already dropped in value versus the Euro. My point: the confidence argument is BS. It has disappeared from the conversation in Britain because it’s no longer convenient.
Guys like Cochrane, who have their intellects invested in models that just aren’t working, have actually put out papers saying that confidence is the point. That saves their accumulated mental efforts of their careers. It’s nonsense. We are looking at massive contraction. We’ve experienced massive contraction of local and state government spending. If the markets expect anything, they expect government shrinkage, even a reduction in Medicare. Expectations theory and markets theory says that information should be reflected – and not only in stock prices but in the confidence levels of businesses because they will then produce and hire. Not happening. Models are wrong.
People feel that their relative wealth is shrinking compared to the rich. This is part of what is holding back consumption.
If people felt that wealth inequality was being dealt with by the govt or maybe a rise in wages, then consumption would build from the inside.
Increasing wealth inequality is a problem. However, at the same level of wealth inequality, if the inequality was decreasing, people would spend more because they feel like their wealth is relatively increasing.
http://www.voxeu.org/index.php?q=node/6619
2slugbaits, 40-50% of US “exports” are US supranational firms sending capital equipment, intermediate goods, components, and software and other related technology transfers to their foreign subsidiaries and contract producers primarily in China-Asia. Since NAFTA/GATT/WTO, apart from ag exports, an increase in exports to China-Asia meant a corresponding increase in US imports (“exports” from US subsidiaries in China-Asia) to follow along with an expansion of US private debt/GDP to consume the cheap imports.
Moreover, a significant share of intra-Asian “trade” is from US and Japanese firms’ subsidiaries’ shipments of components, intermediate, and finished goods between Asian countries at various stages of production, including the effects of double counting of gross value of flows across borders from multi-country production chains rather than the net incremental value add between “trading” countries.
The Anglo-American imperial trade regime, i.e., “globalization”, does not function the way the textbooks would have us believe (or many CEOs know it does not function), especially given the fact that the US imports 11-12M bbl/day of oil (nearly 3% of GDP, 60% of oil consumption, and $1,250/capita and more than $3,000/household).
Thus, when Obummer (or any politician) is advised to promote “exports”, whether he realizes it or not (or cares), he is promoting US firms building out more capacity, expand employment, and ship more capital equipment, intermediate goods, and components to China-Asia, irrespective of whether or not net new investment, production, and employment occurs in the US.
People feel that their relative wealth is shrinking compared to the rich. This is part of what is holding back consumption.
yeah unemployment tends to cause ones wealth to shrink. With a shadow unemployment rate near 16% thats a heck of a lot of shrinkage … the fact that this is a recoveryless recovery is only news to economic forecasters. Oh wait, the 2nd half will be better! not!
Steven, I won’t be surprised to see oil at $40-$50 in the next 24-30 months or so as $100 oil, Boomer demographic drag effects, and fiscal austerity coincide with another global deflationary contraction, large stock bear market, and The Great China Crash.
With $100 oil, fiscal austerity, and global economic demand set to slow or contract, the marginal net energy returns to shale oil are precarious, setting the stage for a significant shakeout in the industry.
Those shale oil wildcatters will be running for cover to bankruptcy court just like after every bubble boom period in history goes bust.
Mark, the problems we are experiencing today did not begin with Dumbya; rather, they started with peak US crude oil production and the deindustrialization and financialization of the US economy beginning in the 1970s. Over the past 30-40 years, we have created at least five times more debt-money assets than value-add industrial capital stock.
And now with high energy costs, gov’t/GDP, and debt service, we cannot afford in net energy terms per capita to replenish value-add capacity at anywhere near the level of real per capita GDP we have today.
Jonathan, yes, cuts to US gov’t spending in the years ahead will be 30%, which could be as much as a net 50% in per capita terms from the levels that otherwise would have occurred had trend growth continued. The recognition of this probable outcome has yet to occur in the mass mind, but it will, and the implications are not pretty.
Edward, yes, extreme wealth inequality is a symptom of financialization, asset inflation, and high debt/GDP in the US. The top 1-10% of US households receive 25-50% of US income and own 40-85% of all financial wealth. The top 1% of households own more wealth than the bottom 90% of households. Most of the so-called wealth for the bottom 90% is in the form of unreal estate equity, which, in fact, is really the lender’s asset, requiring the mortgagee to borrow his own wealth from the bankster at compounding interest.
Note that wealth and income inequality has risen steadily with the growth of gov’t/GDP. So big gov’t and big wealth and income inequality go together for the US imperial corporate-state.
http://www.voxeu.org/index.php?q=node/6637
http://www.voxeu.org/index.php?q=node/6525
More links to the issue of US-Asia “trade” and “imbalances”, as well as intra-Asian “trade”.
Obama poorest economic performance during first 2½ years of any modern president: Ike 3.1%, Kennedy 5.1%, LBJ 6.8%, Nixon 2.1%, Ford 2.2%, Carter 4.8%, Reagan 1.3%, Bush 1.4%, Clinton 2.9%, Bush 1.4%, Obama 1.2%. Why might this be?
People feel that their relative wealth is shrinking compared to the rich.
That’s what happens when the Fed inflates stock prices as well as food and energy prices. And screws the elderly with 0% interest on their savings.
JBH Why might this be?
Oh, I don’t know, but how about these two reasons:
(1) This is the worst recession since the Great Depression and to make matters worse it’s a financial recession, which is by far the worst type.
(2) Obama’s response was too small to do the job and according to Larry Summers they knew that it was too small. Obama’s mistake was that he thought the GOP were adults who understood that further stimulus might be needed. So Obama completely overestimated both the intelligence and the good will of the GOP.
What do you think? Just about covers it?
JBH,
I wouldn’t count the first calender quarter of a presidential term as the responsibility of the new president (or the quarter he enters as in LBJ or Ford). After all, he doesn’t even enter the Oval Office until January 20. Rarely is any major legislation signed into law by a new president before March, and almost none becomes effective before April. (In Obama’s case, ARRA was signed into law in February and the first money went out as checks to seniors in late March.) Furthermore, he usually has little chance to alter the Board of Governors membership of the Fed that fast.
And clearly, who gets assigned the responsibility for 2009Q1 greatly affects the outcome.
Thus, the comparable economic performance during first nine quarters of any modern president (from the second quarter onward): Ike 2.60%, Kennedy 5.50%, LBJ 7.17%, Nixon 1.60%, Ford 2.85%, Carter 4.76%, Reagan 0.53%, Bush 1.11%, Clinton 3.16%, Bush 1.75%, Obama 2.10%.
Note that Obama has performed more poorly than any Democratic president at this point, but better than 5 out of the six Republican presidents (all but Ford).
Why might this be? (Short answer: he’s the most Republican-like Democratic president we’ve ever had.)
“Obama poorest economic performance during first 2½ years of any modern president: Ike 3.1%, Kennedy 5.1%, LBJ 6.8%, Nixon 2.1%, Ford 2.2%, Carter 4.8%, Reagan 1.3%, Bush 1.4%, Clinton 2.9%, Bush 1.4%, Obama 1.2%. Why might this be?”
I’ll go with “lower marginal top tax rates and increased wage and wealth inequality = lowest GDP growth.” So what do I win for this obvious observation?
Is anyone really surprised? This is what an economy under liberals (aka progressives, that’s a laugh) looks like. They think the government is the source of all our blessings. Turns out that’s incorrect.
A consultation with the executioners of the yields curves and volatility in the financial sphere,confirms that everything is still lust and pleasure.
Not a large backlog, unemployed till June 2012 for the head and belly of the yield curve specialists,even not in alert for the MES.
Probability of US Recession Predicted by Treasury Spread
http://www.newyorkfed.org/research/capital_markets/Prob_Rec.pdf
http://politicalcalculations.blogspot.com/
http://3.bp.blogspot.com/-mIu8MPCMev4/ThHsvbtOstI/AAAAAAAAENY/D2v8XLugt5w/s1600/recession-probability-track-3-july-2007-through-1-july-2011.png
Systemic Risk Analysis Of U.S. Financials Using Dynamic MES
http://vlab.stern.nyu.edu/analysis/RISK.USFIN-MR.MES
The business conditions are more down to earth.
http://www.philadelphiafed.org/research-and-data/real-time-center/business-conditions-index/
Rich Berger Hmmmm. Looks to me like the economy has gotten worse as government has gotten smaller. No question that government has shrunk since the Nov 2010 elections. And no question that the economy has gotten worse. This is what you get when economically illiterate barbarians are at the gate.
The proposed debt deal looks pretty dismal for future growth prospects. Reducing some future entitlements without offering up any kind of plan to restrain the growth of what’s driving up the cost of those entitlements will have a perverse effect. Rational actors will have to start saving more of current income in order to offset expected reductions in entitlements. Not the kind of policy objective you should be looking for when the central economic problem is weak aggregate demand. That kind of policy might make some sense if the economy were suffering from too little saving; but that’s not the case. Funny how conservatives forget about Ricardian Equivalence whenever it’s convenient to forget about it.
All the borrowing would not bother me if it wasn’t simply being wasted. If it was used to reduce costs, and free up income for saving and investment, it would be welcomed. But instead of refinancing, we get low rates for people who have neither the need or desire to borrow, railroads to no-where, a more destructive EPA.
aaron free up income for saving and investment
If you think the central problem today is not enough saving from income in order to satisfy demand for new investment, then you and I live in two completely different universes. Or else you’re in a time warp and you’re stuck in 1979. At this moment Apple is sitting on more cash on hand than the US Treasury, and Apple is one of the few companies that is seeing increasing demand for its products. That should tell you something about how much excess saving there is relative to investment demand.
Obviously a different universes. I don’t know a single person named Apple.
Ladies and gentlemen – I must inform you that I am the winner of the prediction sweepstakes on this thread. I predicted today’s current economic mess back on July 6, 1946 … the day that W was born. My very words were … In 2008, we are completely and totally ‘effed.
To the issue of fairness of our income tax structure, does it not bother anyone on this thread that over 32% of the 400 highest paid Americans ($384 M in avg annual income in 2008) paid less than 15% federal income taxes? How can we balance a budget when the richest of the rich pay less than 15% federal taxes, when the LT Avg taxes collected for our entire country is 18% of GDP? How can our Republican politicians stand with a straight face and tell Americans that raising taxes are out of the question? How can our Republican politicians tell us with a straight face that we have a spending problem, and not a tax problem? I’m a Republican, but even I’m fed up with the lies coming out of the mouths of the politicians I voted for. We need income tax fairness in our country. Taxes must be raised on the wealthiest in our country. NOW.
Steven Kopits,
Your observations about Texas are very interesting. We are beginning to see two Americas. The unemployment rate for the US is 9.2%. Here are the states above the US average: Nevada (12.2), California (44.8), Rhode Island (10.8), Florida (10.6), South Carolina (10.5), Michigan (10.5), District of Columbia (10.4).
Seven states are driving unemployment. Of these only South Carolina voted Republican in the last election. Both Florida and South Carolina have taken a hard turn to become even more red so expect the unemployment rates in these states to fall.
Elections do have consequences and so does state policy. I didn’t have time to check it but I wonder which states received the most “stimulus.”
A question to ponder: What do you expect to happen to the unemployment rate in California (here is a hint: their governor is Jerry Brown)? How about Wisconsin (here is a hint: teachers are no longe being laid off)?
Ricardo,
There’s a number of problems with your analysis of relative state performance.
First of all, it’s not possible to guarantee the good perfomance of a state’s economy based mainly on resource exploitation, as in Texas, for the simple reason commodity prices are very volatile.
Second, your list of states with very high unemployment rates technically includes no states that I would consider to be very Democratic.
Local party control matters more for local performance than presidential voting patterns. Republicans control both houses and the governorship in Florida, Michigan and South Carolina. Republicans also control the governorship in Nevada. And the governor of Rhode Island is an independent who was a Republican up until fairly recently (and I know of no one who would regard him as a Democrat). California had a Republican governor until January. And DC is strictly speaking not even a state.
Also, if you extend your analysis to all states with above average unemployment rates you get a bevy of very red states. The following states all have Republican controlled legislatures and Republican governors and all have above average unemployment rates: Alabama (9.9%), Arizona (9.3%), Georgia (9.9%), Idaho (9.4%), Mississippi (10.3%), Tennessee (9.8%). There’s only three other states with above average unemployment and those all have Republican control of at least one legislative body or a Republican governor: Kentucky (9.6%), New Jersey (9.5%) and North Carolina (9.9%).
The interesting thing is that of these 16 states, 10 are so called “right to work” states, or what those of us in the rest of the country call “right to fire” states. On the other hand, of the 29 states (counting DC) that have free collective bargaining, only 6 have above average unemployment rates.
Finally, it’s also worth considering which states *do* have very blue local government. In addition to California and DC, the following states have Democratic control of both legislative bodies and the governorship: Arkansas (8.1%), Colorado (8.5%), Connecticutt (9.1%), Delaware (8.0%), Hawaii (6.0%), Illinois (9.2%), Maryland (7.0%), Massachusetts (7.6%), Vermont (5.5%), Washington (9.2%) and West Virginia (8.5%). Note that none of these states have above average unemployment. Note also that all of them have free collective bargaining except Arkansas.
P.S. Of the 18 states that performed as well or better than Texas in Gross State Product growth last year, 6 were of the 13 states that had all Democratic control (counting DC), 7 were of the 17 states that had divided control and only 5 were of the 21 states that had all Republican control. Thus, Texas, along with North Dakota, is something of a commodities driven anomaly.
http://www.bea.gov/newsreleases/regional/gdp_state/gsp_newsrelease.htm
Ricardo wrote:
“I didn’t have time to check it but I wonder which states received the most “stimulus.”‘
The Center for American Progress compiled state-by-state figures along with its own state estimates based on existing funding formulas. The totals only estimated, however, what each state would recieve under established programs where it was clear how the money would be distributed. That covered about 70% of the fiscal stimulus bill.
Of the 24 states that recieved funds equal to 4.0% or more of 2007 Gross State Product, only 4 were of the 13 states that have all Democratic local control (counting DC), 7 were of the 17 states that had divided local control and 13 were of the 21 states that have all Republican local control. Thus, a disproportionate amount of the fiscal stimulus appears to have gone to red states.
http://www.americanprogress.org/issues/2009/02/compromise_map.html
Mark,
You did not have to live under Republican? governor Charlie Crist. He almost destroyed the Florida economy after being left with a surplus by Jeb Bush. Concerning South Carolina, neither were they well represented, but not only that when your unemployment rate is above the national average and you still have to fight the Obama administration NLRB to get jobs in your state something is wrong.