The Bureau of Economic Analysis reported today that U.S. real GDP grew at an annual rate of 2.8% during the fourth quarter of 2011. That’s better than any of the previous 5 quarters, which tells you more about how disappointing the previous year and a half has been than it does about how great the fourth quarter was. The average historical growth rate for the U.S. economy over the last 60 years has been about 3.2%.
|
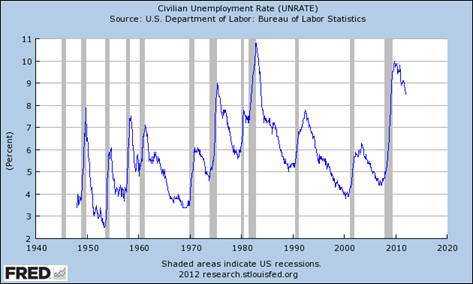
A key reason to be concerned about continuing below-average GDP growth is Okun’s Law, which originally held that to get the unemployment rate to decline by 1 percentage point, we’d need a year of GDP growth 3% above average. Okun based that estimate on data for the U.S. economy prior to 1960, but it has held up pretty well in the half century since then, with 2.5% above-average GDP growth a better summary of the requirement based on the full sample of data now available. Using data from 1949:Q1 to 2011:Q4, here’s a quarterly regression of the year-over year change in the unemployment rate on the year-over-year percent change in real GDP (Newey-West standard errors with 8 lags in parentheses):


|
According to the above relation, if real GDP grows by less than 3.3% over a year, the unemployment rate is more likely to rise than fall. The fact that the unemployment rate fell by 0.9 percentage points in 2011 despite GDP growth of only 1.6% for the year is thus a little surprising, and attributable in part to a declining labor force participation rate. If we want to see real progress in 2012, we have to hope for better GDP numbers than we had for the fourth quarter.
|
Though disappointing, 2.8% real GDP growth would unambiguously be characterized by economists as expansion rather than recession. The latest GDP numbers helped bring the Econbrowser Recession Indicator Index down to 7.4%. For purposes of calculating this number, we allow one quarter for data revision and trend recognition, so the latest value, although it uses today’s released GDP numbers, is actually an assessment of where the economy was as of the end of the third quarter of 2011. The index would have to rise above 67% before our algorithm would declare that the U.S. had entered a new recession.
|
Another disappointment in the latest GDP numbers is that inventory accumulation accounted for 1.9 percentage points of the 2.8% 2011:Q4 growth rate– we were producing more goods, but not succeeding in selling them to final buyers. Also noteworthy is the -0.9% contribution from lower government spending at the federal, state, and local levels. I know you’ve heard this before, but it doesn’t hurt if objective analysts keep repeating the obvious: fiscal contraction is contractionary.
Let’s presume that expanding government spending is economically expansionary and spending contraction is contractionary.
Would it then follow that the economy would be less prone to serious recessions and inflationary periods if government followed the simple principle of borrowing more [increase debt to maintain spending] to lessen a downturn and paying back more [decrease spending to lessen debt] to lessen expansionary inflation? Sort of like a reasonable person might do to keep the household budget from getting out of control?
We only hear the first part of the argument.
Further to the inventory story, real final sales to domestic purchasers (a sort of “core” GDP measure) rose at just a 0.9% annualized pace in Q4. That’s the smallest rise in 3 quarters, and really close to tipping over into recession.
It’s pretty good odds that inventories will be a drag on growth in this quarter, given the outsized contribution in Q4.
Yeah, but final purchases were stronger(thus GDP stronger) before the 4th quarter. I suspect some upward revisions coming, espcially the 3rd quarter.
Purchases looked to pick back up again in December so that tells me the holiday season was “good enough” for a level of purchases to be performed continuing into the 1st quarter.
As I have said several times. These quarterly reports are dumb. There should be 1 report every January of every year about the previous years growth. They do 10 years of revisions already.
Dr. Hamilton,
Nowhere in your brief posting was there a mention that the 2011 US Annual GDP was 1.7%. Rather, your discussion was limited to the 2.8% Q4 increase biased by excess inventories and Christmas shopping. If you subtract out the $1.3 Trillion of Federal deficit spending last year, you’re left with a REAL NET GDP of approximately minus 7%… Which of course does not factor in the $600 Billion QE2 goose by the Federal Reserve!!!
I believe that you, as an academic economist, are ethically bound to advocate government statistical indicies that capture overall economic and financial activity. Marginal GDP growth, discussed in isolation of the huge scale of deficit spending it takes to achieve it, is precisely what has propelled 40 years of mismanagement and graft in Washington.
Its time to advocate a responsible adult interpretation of the economy.
MarkS: To quote myself above, “The fact that the unemployment rate fell by 0.9 percentage points in 2011 despite GDP growth of only 1.6% for the year is thus a little surprising, and attributable in part to a declining labor force participation rate.”
So, if US 2011 GDP growth was 1.7% and oil consumption fell by 1.6%, then the headline efficiency gain of oil consumption per unit of GDP is 3.3%. Pretty impressive.
However, I would guess that the oil patch (anyone has numbers on this?) probably contributed, directly and indirectly, maybe 1% of GDP. (Is that too much?)
So figure that oil consumption efficiency in GDP increased by probably 2.0-2.5%. The 2% is the standard “forced march” pace used by both us and BP. (This means that we believe that the economy can continue to adapt to higher oil prices with a sustainable annual efficiency gain of 2%.) But the efficiency gain appears above 2%: the US is on a veritable Atkins diet for oil consumption.
If we think GDP growth should have been 3.2%, and we believe that the financial sector’s impact on GDP would have been zero (a big ‘if’ admittedly), then high oil prices might have reduced GDP 1.5% below what it would have otherwise been by this metric.
We can cross-check this against vehicle miles traveled, which fell by 1.3% in 2011, whereas we would have expected an increase of 2.4% in a normal year. The total deviation is thus 3.7%. If we allow a forced march efficiency gain of 2.0%, then the GDP sacrificed is on the order of 1.7%.
So that’s a pretty crude approximation of the effect of oil prices on the economy: drag of 1.7% compared to no oil price pressure.
We can contemplate what this foregone GDP growth might mean. For example, what would Italy’s bond market position be if its growth rate were 1.7% higher?
To continue this thought:
If we think US GDP was 1.5% below what it should have been, then that’s $250 bn. To have achieved this with normal oil consumption would have required an additional 470,000 barrels per day, valued at $17 bn per year.
If all of the difference is attributable to oil, then the GDP-to-oil multiplier is 15. This is consitent with the 10-12 figure I calculated by another method in an earlier post.
Do you do numbers for the fiscal drag created by the states?
Steven Kopits –
As the US substitutes more and more natural gas and coal for oil, you might consider updating your oil/GDP parameter with Total-Energy/GDP. Better yet, we might fixate on a more relevant parameter like Total-Energy/Total-Tradable-Goods that would indicate our resource use efficiency.
JDH – I allowed poor reading and my own prejudices to impugn your motives. I am ashamed and beg your pardon.
Bruce Hall if government followed the simple principle of borrowing more [increase debt to maintain spending] to lessen a downturn and paying back more [decrease spending to lessen debt] to lessen expansionary inflation?
Didn’t Clinton run a surplus in the late 90s? Didn’t Bush #43 argue that Clinton’s surpluses were wrong because the government was keeping the taxpayers’ money? Wasn’t that Bush’s main argument for his tax cuts? Remember, Bush specifically rejected the idea of tax cuts to stimulate aggregate demand.
But I’m glad you agree that a sensible policy is to run surpluses to lean against contractionary forces (especially at the zero bound), and to run surpluses during the boom times.
Hi James, we are discussing here the scenario “EU without Greece”, and how this calamity (or not) would affect US GDP.
If you have some time left and interest in this topic too, please let me know your opinion in one of your very welcomed posts.
Thanks, have a nice weekend.
“If you subtract out the $1.3 Trillion of Federal deficit spending last year, you’re left with a REAL NET GDP of approximately minus 7%… Which of course does not factor in the $600 Billion QE2 goose by the Federal Reserve!!! ”
Thank God for deficit spending eh?
2slugbaits,
Keeping spending high and tax revenues higher is one way to interpret what I wrote, but reducing taxation somewhat while reducing spending more is another. Rather than raising interest rates and putting more burden on consumers and businesses as a means to “manage” the economy ala the Federal Reserve, why not take government out of some of the spending and let that be the adjustment factor?
Or in Washington “real world” terms: don’t increase spending quite as much. 😉
Bruce Hall
Or in Washington “real world” terms: don’t increase spending quite as much. 😉
You are suggesting draconian cuts :))
Bruce Hall Fiscal policy should not be the first tool policymakers reach for when trying to manage the business cycle. I’m in favor of an aggressive fiscal policy right now, but that is only because conventional monetary policy is very weak at the zero interest bound. If conservatives want to weaken Obama’s case for a more aggressive fiscal policy, then they should quit threatening Ben Bernanke and let the Fed get on with QE3, QE4, QE?.
Dear Professor Hamilton,
Humble learning point: Using Excel I ran the GDP_Unemployment rate model per your prescription and got similar results [except for computing the Newley-West adjustments]. Reading about Newley-West and series with auto correlation, I see some comments about perhaps R squared being over stated if autocorrelation of residuals is present. Any application here for a reduced R squared?
MarkS:
I distinguish between oil and power. Oil is uniquely used in transportation. No other fuel comes close. When we say we are “addicted to oil”, we are not speaking of a moral failing, we’re referring the strength of oil’s comparative advantage. Nothing else can easily substitute.
Therefore, the transmission mechanism for oil into the economy–the reason the economic multiplier for oil appears so high–is posited to be its impact on mobility. If high oil prices prevent me from, say, going on vacation, then the economic activity associated with that vacation–a number potentially much greater than the value of the oil itself–may also be compromised.
So that’s a thesis, but it does not necessarily negate the notion of thinking about aggregate energy budgets or consumption. But the focus here is on the mobility impact, rather than, say industrial production or residential heating.
Now, to suggest that oil prices are preventing 1.5-1.7% of GDP growth, that’s a very strong statement. I am suggesting that half of incremental economic performance is being held hostage to oil prices. This notion either needs to be aggressively refuted, to claim that oil really doesn’t matter; or it needs to be embraced, and thoroughly examined.
So where is that analysis? I criticized the AEA Conference because this whole topic was completely marginalized. If you read through the agenda, you’d think oil a marginal issue at best. Is it? I don’t think so. I think it is the issue.
Barkley –
As regards Iran, I might suggest you read the feature in this week’s New York Times Magazine, “Israel versus Iran”. Whatever else may have happened, this issue has not gone away.
MarkS, you wrote:
How do you get to a GDP of “minus 7%”? Or do you mean the change in the GDP?
If you mean the change in the GDP, then I don’t think you have applied the right mathematical relations to get to a GDP change of “minus 7%”. The federal deficit of 1.3 T$ is not a contribution to the GDP change. It’s a contribution to the absolute value of the GDP. To get the contribution to the GDP change from the deficit you have to use the change in the deficit, not the absolute value of the deficit. This would be the correct level of comparison.
James Hamilton, you wrote:
Don’t you think one should not draw any conclusion at all about what the first release of a GDP estimate tells us in relation to the estimates of previous quarters, if the difference between those estimates does not clearly exceed the noise level? We just don’t know yet whether Q4 2011 was really better than any of the five quarters before, considering the significant revisions GDP estimates undergo. The first estimate of Q3 2011 GDP change was 2.5%. The “advance” estimate of Q4 2010, which is also one of the five quarters you mentioned, showed even a 3.2% increase in the GDP. Back then, did you conclude things had finally gotten evidently better, since the GDP change exceeded plus 3%?
And even after the x-th revision, a meaningful conclusion that GDP estimates from one quarter were better or worse than the ones from others can only be drawn, if those differences are statistically significant, taking into account the quarterly variability in the time series.
AS Unlike you, I have not not crunched the regression numbers, but on the face of it I would not expect autocorrelation to be a big issue with that particular data set. Autocorrelation is mainly a problem with time series data; the data in JDH’s unemployment/GDP model is cross sectional data. With cross sectional data the big concern is heteroskedasticity, meaning the variance is not uniform. Newey-West is one way to make the variances uniform. Note that with heteroskedasticity correcting for it does not change the values of the coefficients in the regression, but affects the error terms. For example, if you don’t correct for heteroskedasticity the standard error terms might be overstated and thereby understating the statistical significance. In JDH’s model the coefficients are all highly significant…not even close really.
There are various ways to correct for autocorrelation with time series data. You might want to consult JDH’s book…except it’s a bit pricey for a book that’s 15 years old (sorry, JDH). One quick and dirty way to correct for autocorrelation is to add an “AR” term to the RHS of the equation. Most econometric software (e.g., EViews, LIMDEP, RATS, SAS ETS, etc.) will let you do this.
AS and 2slugbaits: This is a time-series regression, and the errors will be serially correlated if nothing else because the observations (quarterly observations on year-over-year changes) are overlapping. One issue with R2 for serially correlated observations is that if you include a variable that picks up the short-run trend (such as include lagged values of the left-hand variable), that usually explains a good fraction of the unconditional variance. I wouldn’t consider that an argument for using an alternative measure of R2. The R2 is what is it is by construction, namely, a summary of the fraction of the unconditional sample variance that is accounted for by the regression. Whether you find that interesting is up to you.
I report the R2 here primarily because whenever I don’t, there’s some reader who complains that they want to see it.
And by the way, my book would still be a bargain at twice the price! But that’s just my opinion.
MarkS you’re left with a REAL NET GDP of approximately minus 7%
Okay, I give up. What is “REAL NET GDP”? I understand the concept of real net domestic product, but what is real net gross domestic product?
Dear Professor Hamilton,
Thanks! I do find your comments interesting.
I was not questioning your judgment; I am just confused about readings such as Gujarati’s comment in his 4th edition of Basic Econometrics, p.455, where he says under a section titled, OLS Estimation Disregarding Autocorrelation, “…we are likely to overestimate R 2”, since according to him the residual variance estimator is likely to underestimate the true variance.
For fun, I ran a regression of the residuals at one lag and at eight lags; interesting to see the trend pattern at one lag and the random pattern at eight lags.
Regarding your book, I would buy it if I were at a high enough level of understanding.
2slugs: thanks to you also.
Rootless – Sorry for being sloppy, again. I should have dimensioned the term (Real delta-GDP/yr).
2slugbaits – My coining of “REAL NET GDP” is meant to discriminate un-leveraged financial transactions from those that burden the future with promissory notes. Because US non-governmental credit credit market debt remained flat at about $30 Trillion in 2011, virtually all the credit (debt) change was due to Federal Government deficits. My motivation in adopting an un-leveraged measure of GDP is that it helps to prevent scallywags from burdening future generations with today’s self-deception and avarice.
Our objective should be to LIMIT Total Credit Market Debt in the economy to a low and sustainable level. Doing so will result in better allocation of resources, will moderate and reduce the severity of business cycles, and reduce the level of corruption in both government and the financial system.
JDH,
Wouldn’t the fact that you used the changes in unemployment and changes in GDP rather than levels tend to dampen most of the usual sources of serial correlation? The fact that you can reorder the regression and that GDP rather than time is on the x-axis makes this more of a cross sectional regression than what I would normally think of as a time series. There could be some autocorrelation problems, but given the nature of the regression I would expect heteroskedasticity to be a bigger concern.
Don’t get me wrong, I’m recommending your book even at the price. I just think the price of textbooks today is ridiculous given all of the technological advances that have dramatically lowered the cost to publish a book.
MarkS,
Still, it’s the deficit change that contributes to the GDP change, not the deficit itself. The deficit itself compares to the level of spending, like the terms in GDP = C + I + G + X. So deriving a “net” GDP change of minus 7% using the level of the deficit doesn’t make much sense.
2slugs:
See the “t” subscript in estimated equations. That is generally how economists denote “t”ime series. Cross-sectional makes use of the “i” subscript on variables. If Prof Hamilton had run a regression comparing the variables across countries in a particular year, that would be cross sectional. He analyzed the variables across time for the US, making it time series.
MarkOhio Yes, subscripts of “i” is the usual convention for cross sectional regressions and subscripts of “t” is the usual convention for time series. Nevertheless, look at the form of the regression. The regression model is one that looks for a relationship between the change in GDP and the change in unemployment. Time is not a variable. In fact, you could reorder the observations anyway you want and still get the same answer. You can’t do that with time series analysis. You could also randomly remove half the observations allowing for different time intervals between between observations and you would still come up with the same regression.
Oh…the “t” in the subcript here signifies that each dependent observation is contemporaneous with the independent observation. When econometricians use a “t” in a cross sectional regression, that is what it usually means.
Rootless
I made the Net Real delta-GDP/year estimate as an alternative way of looking at GDP change. As you already know, vast numbers of politicians, economists, and contributors to this blog frequently discuss “GDP growth”. From a political perspective, “GDP growth” is a proxy for economic progress and increased wealth by media and the lay public. “GDP growth” gains its imprimatur principally because economic “professionals” frequently continue its circulation without discussion of how unrestricted growth in credit can actually degrade general welfare and national wealth.
“Net Real GDP” (NRGDP) is similar to “Net Worth” because it describes the market value of all final goods and services less net debt creation. NPGDP = C+G+(X-M)+I – (delta-D), or NGDP = (GDP at producer prices) – (delta-D), or NPGDP = COE+GOS+GMI+T–S-(delta-D) ; where (delta-D) is the change in Total Credit Market Debt.
If you can’t understand why “Net Real GDP” would be a more honest and valuable parameter than GDP, which ignores debt burden, I pity your family and business associates.
2slugbaits: As long as people are asking for some econometric instruction, let me pontificate a little on a point that is often misunderstood even by people with a pretty strong background in econometrics. Although it would be possible to randomly reorder the observations in the above regression, such reshuffling would not make the observations at different dates independent. One way to see this is to note that the standard errors for the original regression should be adjusted for serial correlation. But when you shuffle the observations, the OLS coefficient estimates and standard errors will be numerically identical to those of the original. That means that if OLS standard errors were inappropriate for the original regression, then they are also inappropriate for the shuffled regression. Mathematically, if the variance-covariance matrix of the original OLS residuals has any nonzero off-diagonal elements, then every off-diagonal element of the variance-covariance matrix of the shuffled residuals is nonzero (and equal to every other off-diagonal element), with a value that comes from the average of the off-diagonal elements of the original variance matrix. The values of the OLS coefficients themselves, as well as a correct calculation of their standard errors, would be identical whether or not you shuffle the observations.
MarkS,
Your moral judgment about honesty or dishonesty of debt is really not of any interest to me. Your religion is your private business. Your pity for me is the same kind of pity, which I experience from evangelicals or other religious sect members, just because I don’t follow their morals.
Instead, I made a comment about the validity of the mathematical relations, which you had applied for your assertion that the GDP change would have been minus 7% without the federal deficit of 1.3 T$. I do not see how the equations, which you have written down now contradict in any way what I have said regarding this.
So, how do you get to the minus 7% that you claimed, for the “real net” GDP change?
Thanks for the clarification on time series vs cross-sectional. I guess this is a cross-sectional analysis with one cross section? The US? Seems weird to me, and an odd use of these terms, as generally understood. It seems that you couldn’t re-shuffle the original un-differenced data and get the same results: i.e., y[t]-y[t-1] n.e. y[t]-y[t-k], for k n.e. 1. So the time-order of the un-differenced data is critical to the analysis. And isn’t the intercept term in the regression an implicit estimate of a coefficient on t? It has been awhile since I was in an econometrics course, although I often employ econometrics in my job, so maybe things have changed.
MarkOhio: This is a time-series data set. By shuffling the data set I meant, for example, putting the change between 1970:Q2 and 1970:Q3 first in the shuffled sample, not using a change between 1970:Q2 and some other random quarter to go first in the shuffled sample.