Last week’s data suggest that the U.S. economic recovery is continuing to gain some strength.
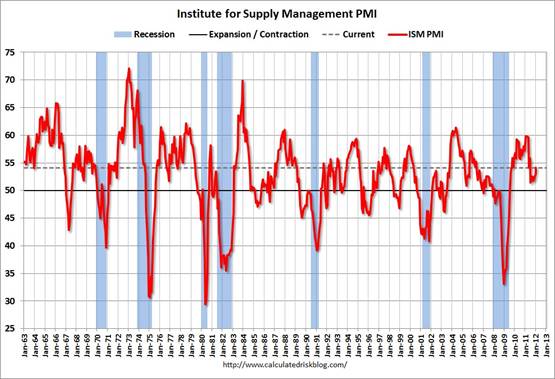
On Wednesday the Institute for Supply Management announced that its PMI manufacturing composite index rose to 54.1 for January, its highest value since June. A reading above 50 signals that more establishments experienced improvements than saw deterioration in key measures during January, and a value above 52.7 is a weak indicator of above-average real GDP growth. ISM’s non-manufacturing index came in with an even stronger reading of 56.8.
|
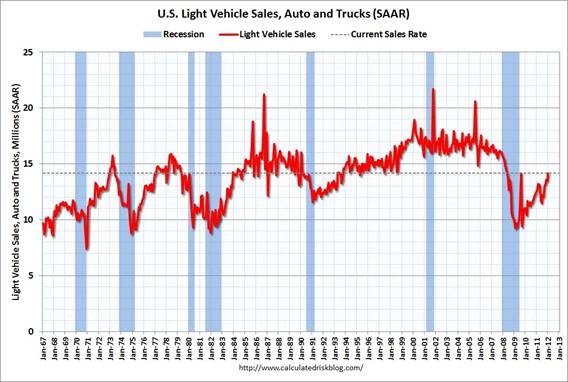
Auto sales, another key cyclical indicator and early barometer for the economic effects of higher oil prices, were back up in January to the levels associated with the early months of the 2007-2009 recession. Four years ago, those levels were a drag on the economy, but compared to what we saw over the subsequent four years, they don’t look so bad.
|
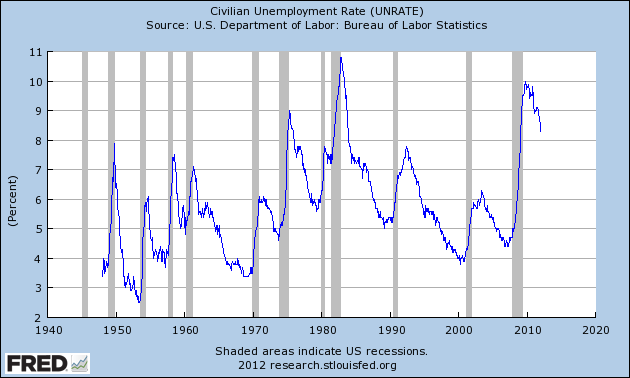
The most important monthly indicator is the BLS estimate of the number of Americans on nonfarm payrolls, which was up by 243,000 workers on a seasonally adjusted basis in January. The BLS estimate of the unemployment rate also continued to improve, falling to 8.3% in January. The 0.8 percentage point drop in the unemployment rate since August is somewhat surprising– usually we’d expect to see stronger growth in real GDP and in nonfarm payrolls than we have in order to realize that much improvement in the unemployment rate.
|
The unemployment numbers come from a BLS survey of households that is completely separate from the survey of establishments on which the nonfarm payroll numbers are based. The household survey also produces its own measure of total employment, which is generally regarded as less reliable than the establishment-based estimate, though sometimes the household survey has been a little quicker to recognize cyclical turning points. To get employment numbers from the household survey, one needs not just the employment rates among respondents, but also separate estimates of the population. Each January the BLS updates its population estimates, this time incorporating an assumed population that is 1.5 million larger than that used for December. The result is that the reported December-to-January changes in certain categories were huge because they imputed to a single month some changes that in fact accumulated over the year. This led some commentators to misinterpret the January labor force report, a point clarified by Bonddad Blog and Calculated Risk.
It’s worth noting that the BLS also reports an estimate of what the December-to-January change in employment would have been based on the household survey if there had been no population adjustments. That number turns out to be a monthly gain of 631,000 jobs– a significantly more bullish estimate than the nonfarm payroll number.
But even if we ignore the household survey altogether, it is accurate to say that things are looking better than they did a week ago.
Professor Hamilton,
November’s trade deficit was nearly $48 billion.
Could this be adding to the rebound in jobs in the US?
Thank you
whether those who quit looking for work did so in one month or over a whole year isnt really the question; quoting BLS:
“the civilian noninstitutional population increased by 1,510,000, the civilian labor force increased by 258,000, persons not in the labor force was up 1,252,000, those employed increased by 216,000, and unemployment was up 42,000″…
so even though “those not in the labor force” decreased in january, the apparent reported increase was 1,177,000, the labor force participation rate for january fell 0.3% to 63.7%, taking out a low set back before reagan busted the unions & forced mothers to join the workforce…
by examining and analyzing a couple of other leading indicators (http://im-an-economist.blogspot.com/2012/02/business-cycle-tracking-usa.html), I failed to reach the same conclusion – in fact, there’s more that the indicators say against an upcoming recovery, than in favour of it.
rjs: You are quoting the effect of the population controls alone. Specifically, the reported Dec-Jan employment change was 847,000 based on the household survey, the population adjustments contributed 216,000 to this, so the Dec-Jan change after removing the population control effect was 631,000, the number that I highlighted above.
Raskolnikov: A higher trade deficit reflects low demand for domestically produced goods and services, low profitability of same, and high cost of imported oil, all of which have a negative effect on U.S. employment.
A stable currency is more important to recovery than most seem to realize. It is instructive to look at a graph of the price of gold from 1975 to the present. http://www.kitco.com/scripts/hist_charts/yearly_graphs.plx
The period from the mid-70s through the early 1980s was a period of significant increase in the gold price signaling a significant decline in the value of the dollar. Around 1982 the price of gold stabilized and remained almost flat during the prosperous years of the 1980s and 1990s, one of the longest periods of prosperity in the nation’s history. Around 2005 we see the effects of monetary expansion on the price of gold as the slope of the graph jumps to better than a 45 degree angle. It is also instructive to note that since August 2011 the price of gold has been relatively stable. With this stability has come some economic improvement.
Now it would be easy to dismiss this correlation as coincidence if it had not be a trend over 30 years of time. With such a track record we must recognize that there has to be something in the correlation. Perhaps those who are calling for a stable currency as opposed to QE3 have some reason and perhaps those calling for more quantative easing should be taken with a grain of salt.
Professor,
The unemployment rate is an awful number to use when talking economic recovery. You would do better to use total employed or the delta in employed. This number much less subjective than the highly manipulated unemployment percentage.
All the more reason Bernanke should hurry up on QE3. As it is, he is going to be hard pressed to justify it. Come on Bernanke, go all in!
I am kidding, of course. Bernanke should ask himself why periods FOLLOWING bouts of QE have been of much softer growth. The answer is that the commodity speculation he ignites via QE is hitting the economy enough to take off 0.5-1% off the growth rate. Of course, naysayers like me are not liked in the echo chamber that the Fed has become. Healthy discourse is shunned. Anyone asking a question is called a traitor. I would have thought the crisis would lead to soul searching by the Fed. Turns out this Fed has no soul.