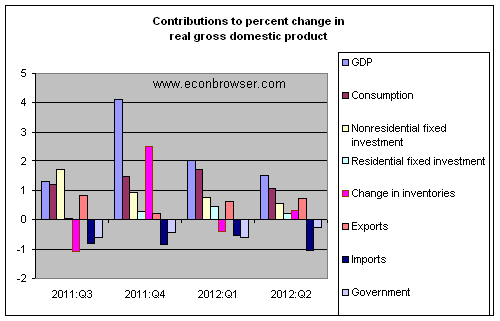
The Bureau of Economic Analysis reported Friday that U.S. real GDP grew at an anemic 1.5% annual rate during the second quarter. When the same bad thing keeps happening to you again and again, “disappointed” no longer seems the appropriate word to use.
Lower spending by state and local government and lower net exports each subtracted about 0.3% from the annual GDP growth rate. And there just wasn’t any oomph anywhere else to make up for it. Consumer spending grew at the same meager rate as GDP itself, with an outright decline in spending on durable goods, the big ticket purchases that consumers postpone when they’re worried about the economy. Nonresidential investment and housing made modest positive contributions.

And things have been “disappointing” like this for quite a while. Although the 2011:Q4 growth has been revised up to what might seem to be an encouraging 4.1% value, most of this was inventory accumulation; growth in real private spending for Q4 was 1.6%, the same sort of anemic numbers we’d been seeing before and since.
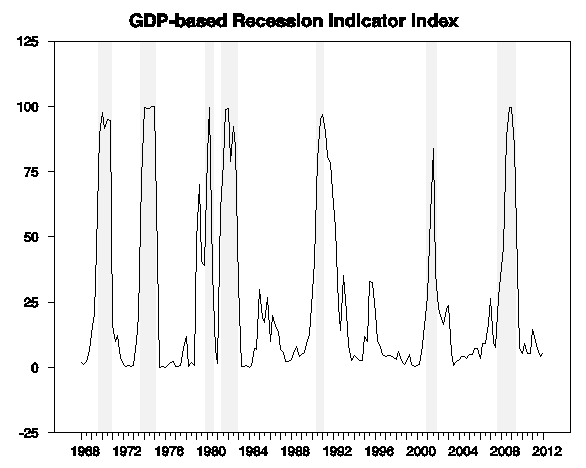
Even so, we’d still unambiguously describe the economy as continuing to experience overall economic growth. The latest GDP report puts our
Econbrowser Recession Indicator Index at 5.7%. For purposes of calculating this number, we allow one quarter for data revision and trend recognition, so the latest value, although it uses today’s released GDP numbers, is actually an assessment of where the economy was as of the end of the first quarter of 2012. The index would have to rise above 67% before our algorithm would declare that the U.S. had entered a new recession.
 |
Not a recession, and not really a surprise, but nonetheless very discouraging. The graph below plots the level of real GDP on a logarithmic scale, so that a vertical move of 1 unit on this graph corresponds to a 1% change in the level of real GDP. U.S. real GDP today is up only 2.9% from where we were 5 years ago. That’s worse– by far– than any 5-year postwar period before 2007. Even 1983:Q2, which marked the low point in the second of back-to-back recessions, saw a level of GDP 6.7% above that in 1978:Q2. And even if you don’t start counting until the current recovery began, we’ve only seen an average annual real GDP growth rate since 2009:Q2 of 2.2%, significantly worse than the 2.6% average annual growth rate during the disappointing and discouraging 2002:Q1-2007:Q4 economic expansion. Oh, for the good old days!
 |
I still see potential for a large temporary boost from housing and autos. However, there is also potential for a much bigger negative shock from both fiscal policy and developments in Europe. Aside from these issues, there seems reason also to be concerned about what looks to be a long-run trend of declining U.S. growth. Time for us all to ask again, what could America be good at?
In regards to inventory accumulation versus end-consumer purchases, the following class action lawsuit might be of interest.
http://www.faruqilaw.com/GM
The taxpayers forked over billions to bail out GM for a 32% share of the company.
http://www.nytimes.com/2012/05/04/business/gm-profit-falls-but-surpasses-forecasts.html?pagewanted=all
Based on G.M.’s current stock price of $22.37, taxpayers would lose an estimated $15 billion if the government’s shares were sold today.
GM is $19.51 today.having fallen from a 2012 high of $27.34.
8.6%.
No, it isn’t the latest unemployment number, and it certainly isn’t the yield on 10-year Treasuries.
Rather, it was America’s share of global initial public offerings last year. The home of the deepest, most liquid capital markets in the world produced fewer than one-tenth of the IPOs around the globe in 2011.
Troubling on its own, our share of this pie has plummeted from more than half of the world’s initial offerings during the early 1990s.
Sarbanes-Oxley Has Devastated The U.S. IPO Market
Is it any wonder that the US is stagnant when innovation is racing away from our shores? Unless we discover our way to attracting entrepreneurs the US will quickly find ourselves paying royalties to foreign companies to use their IP. When will we realize we are in serious decline?
Oh we may maintain an illusion of some growth through the phoney numbers generated by GDP measurements of government spending – for a while – but for how long?
It may be worth to look at these charts, not to take the pulse of the banks, but the prices status of the secured lending. Many corollaries may ensue, households precautionary deleveraging same for the corporations and prices that may be sticky. Assets prices leverages are enduring phenomena.
Assets at Banks whose ALLL exceeds their Nonperforming Loans (LLRNPT)
http://research.stlouisfed.org/fred2/series/LLRNPT?cid=93
One may have to recognize the less mentioned benefit of Quantitative easing that is a more subdued financial stress,as reflected through hereunder.
St. Louis Financial Stress Index (STLFSI)
http://research.stlouisfed.org/fred2/series/STLFSI
Until proved otherwise, this is not a typifying situation restricted to the USA.
US oil consumption, even allowing for a normal recession, is 3.5 mbpd (16%) off trend from 2005. Meanwhile, Brent today is $106, a solid $10 above the carrying capacity of the US economy.
This is not a lack of demand we’re seeing, it’s the US being starved of oil. Do we think that’s likely affecting the economy?
Thanks ppcm.
As usual, you cut through all the bluster, and focus on what’s important: After more than $1.6 Trillion in QE, only 30% of US bank assets are adequately collateralized for lease and loan losses.
The real estate behind the 2006 $20T US mortgage market has shed 35% of its value from its peak…Or $7 Trillion in RE assets have gone up in smoke.
Anyone that thinks that the US can re-inflate the economy with the current total financial debt burden at 350% of GDP and a banking system that is inadequate provisioning for loan losses is smoking some bad weed. Somebody has to eat the remaining $5 Trillion in RE losses before the banking system can hope to recover. A capitalistic system cannot function if capital is not available for business formation and expansion.
One of America’s major competitive advantages is historic investment in government funded infrastructure. Ag and coal are competitive due to rail and water transportation networks, irrigation projects and power projects. Almost all of this was either government funded or heavily regulated and/or subsidized. Why not go back to what we used to do and build ourselves back to competitiveness? We’re too busy giving handouts to corporate interests to use the government to create prosperity. As an example, checkout what wind power would cost per kwh if developed on the model of Reclamation projects. About the same amount that we pay in incentives over and above a full market price, and we don’t even own the generation.
That government is shrinking is a plus, and a necessary process.
MarkS,
What you are saying is that the $1.6T in QE was too little, and a cumulative total of $5T in printed money is needed.
I agree. There is no inflation, so the spigots should be loosened considerably.
“When the same bad thing keeps happening to you again and again, “disappointed” no longer seems the appropriate word to use.”
Here, here.
Isn’t it also time stop using the word ‘crisis’ so much? Can you really be in a debt ‘crisis’ for years?
Haven’t the banks collected more than enough interest on that debt to cover their loses?
Darren-
Obviously you didn’t read my comment… Another $5 Trillion in QE doesn’t solve the problem. It just changes who’s holding the impaired securities. Instead of the banks, insurance companies, and pension funds that were responsible for the fraud, we load the losses onto the backs of everybody else, particularly generations of young people starting out in life. It bails out the miscreants, leaving the same dirt-bags in power.
I firmly believe that there have to be consequences for the fiduciary irresponsibility in banking, finance and government. Force the bankruptcies, trim the credit load, and allow productive commerce to flourish. Continue the corruption and the economy may never recover.
Steve Kopits
Very strange assertions to me.
3.5m b/d down is probably the result of 1). structural change (oil intensive activities moving offshore) and 2). reduction in demand due to less economic activity.
But the largest single factor is almost certainly greater efficiency in the use of energy (more use of rail, more efficient vehicles, more efficient shipping and delivery practices, better home insulation in the NE etc.) by the American economy in the usual lagged response to a strong increase in price (the same thing we saw in the early 90s). And discretionary switches away from gas consumption (go the mall less often, telecommute, go on shorter driving holidays etc.).
As to ‘$100’ as some sustainable level of price, that strikes me as an arbitrary ‘line in the sand’.
The reality is the US economy can function with $50 oil, and $150 oil. Oil is price inelastic in the short run, but almost certainly less so in the long run. A $150 oil price doesn’t kill the US economy, but it will hurt as households and businesses adjust.