A lot of attention has been given to the optimistic assessments of future U.S. and Iraqi oil production in the IEA’s World Energy Outlook 2012. However, perhaps even more dramatic is the report’s prediction of a significant long-term decline in petroleum consumption from the OECD countries. For example, the report predicts about a 1 mb/d drop in U.S. oil consumption by 2020 and a 5 mb/d drop by 2035 relative to current levels. I was curious to examine some of the fundamentals behind petroleum consumption to assess the plausibility of the IEA projections.
 |
Fuel efficiency of vehicles sold in the United States has been increasing rapidly over the last five years, meaning that the typical new car gets substantially more miles per gallon than older vehicles. If Americans just keep buying cars that are no more efficient than the typical model sold in 2012, average fuel efficiency of the existing fleet will continue to rise over time, as older cars are scrapped and replaced with new models.
 |
To get a quick idea for the likely magnitude of this effect, I assumed that the age of the existing fleet can be described using an exponential distribution, according to which the fraction of cars less than x years old can be calculated from the formula
1 – e-gx where g is a parameter that characterizes the distribution. This distribution would arise, for example, if there were no changes over time and if a constant fraction g of existing cars were scrapped and replaced with a new car each year independent of age. Although one could build much more detailed models that take into account differential scrappage and utilization rates by age, the exponential distribution seems appropriate for the kind of ballpark calculations I’m interested in here. The average age of cars currently being driven has been separately estimated to be around 11 years, which would imply a value of g = 1/11. As a separate check on the plausibility of the assumption of an exponential distribution, the model predicts that a fraction 1 – e-1/11 = 0.087 of the cars currently on the road should be less than 1 year old. In 2010 there were 131 million automobiles registered in the United States and 11.5 million new passenger vehicles sold, for a directly calculated ratio of 11.5/131 = 0.088. So I’m comfortable using the exponential distribution for calculations like the ones I’m about to report.
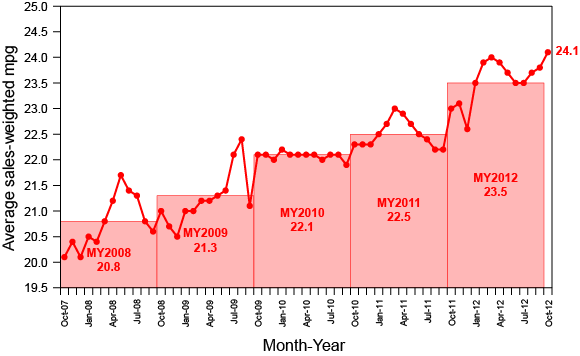
To use this distribution, I need a longer time series for the fuel efficiency of new vehicles, for which I used figures reported by the NHTSA shown in the graph below. These systematically report miles per gallon to be a higher number than the EPA sticker figures in the graph above. However, all the key calculations below refer to changes over time, so if the official NHTSA figures at least have accurate estimates of the rate of change in mpg of new cars sold from one year to the next, the estimates below will still be accurate.
 |
Given the history of the average mileage of new vehicles sold each year (the blue line in the figure above) and an assumed fraction of cars of each age still on the road implied by the exponential distribution, I calculated the current average fuel economy of the existing fleet to be 27 mpg– this is essentially just a geometric weighted average of the most recent values for the blue line in the graph above. If new cars offer 33 mpg, the average fuel economy of the existing fleet will continue to rise with time even if nothing else changes. For example, if the fuel efficiency of new cars sold in 2013 is no better than it was in 2012, the average fuel economy of the typical car on the road will improve to 27.6 mpg next year as more 33 mpg cars replace some of the less fuel-efficient models currently on the road. If there are no further improvements in fuel efficiency over the next decade, I calculate that the average car on the road would be getting 30.5 mpg by 2020.
However, current Corporate Average Fuel Economy (CAFE) rules call for increasing mileage standards over this decade. MIT Professor Christopher Knittel estimates that technological progress would allow average miles per gallon to grow by about 2% per year with constant vehicle size and horsepower, and torque, and faster if we gradually move to smaller cars. In Scenario 2 in the graph above, I assume that the average miles per gallon of newly sold vehicles increases by 2.5% per year. That would result in slightly better mileage each year than anticipated to result from current CAFE standards. Under this scenario, the average efficiency for existing cars would rise to 27.7 mpg in 2013 and 32.8 by 2020, when the average new car sold in 2020 is assumed to get 40.5 mpg as measured by the NHTSA (translating into a presumed EPA sticker mileage of perhaps 30 mpg).
The next question is how much a reduction in consumption this would translate into. First suppose that the total number of miles driven never goes up from 2012 levels. That would mean a ratio of gallons consumed in 2013 to gallons consumed in 2012 of (27.0/27.6) = 0.978 or a 2.2% reduction under Scenario 1 and a 2.4% reduction under Scenario 2. By 2020 we would have an 11.4% reduction under Scenario 1 and a 17.8% reduction under Scenario 2.
| Scenario 1 | Scenario 2 | |
|---|---|---|
| current mpg | 27.0 | 27.0 |
| 2013 mpg | 27.6 | 27.7 |
| 2020 mpg | 30.5 | 32.8 |
| oil demand change by 2013 (vmt constant) | -2.2% | -2.4% |
| oil demand change by 2020 (vmt constant) | -11.4% | -17.8% |
| oil demand change by 2013 (vmt grows 1.3%/yr) | -0.9% | -1.1% |
| oil demand change by 2020 (vmt grows 1.3%/yr) | -1.0% | -7.4% |
But does it make any sense to expect that total miles driven remains frozen? Historically, it would usually take both a significant recession and a big spike in oil prices to produce a temporary dip down in U.S. vehicle miles traveled. Nevertheless, so far there is no sign of U.S. miles driven climbing back up to where it had been prior to the Great Recession.
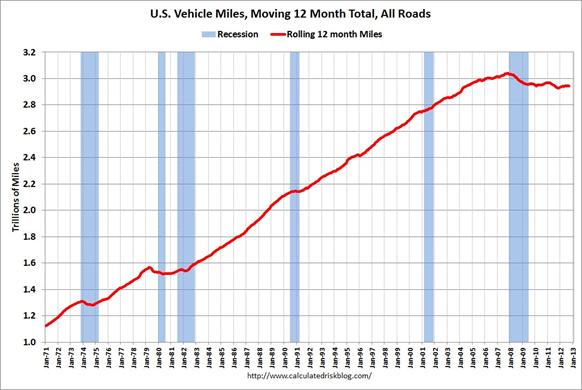 |
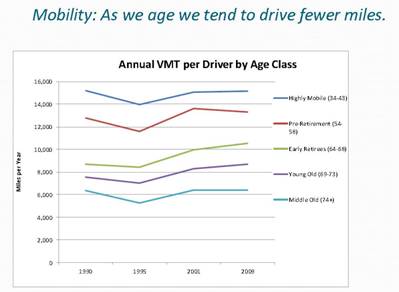
Bill McBride notes that the drop in miles driven since 2007 is not just due to higher gasoline prices and the weak economy. Older people drive less than younger, so as America ages, that would be a factor offsetting the effects of higher income and a growing population and leading us to expect a slower growth rate over the next decade than we have seen previously. Bill also reports evidence of a values shift of younger people away from cars, and some changes in patterns of home and work location that reduce total driving.
 |
Miles driven grew at an average annual rate of 2.7% between 1980 and 2005. Suppose for illustration we believed that demographic and values shifts will result in growth at less than half that rate over the next decade. That would mean a net drop in U.S. oil consumption next year of 1.3 – 2.2 = -0.9% under Scenario 1 and a drop by 2020 of (8)(1.3) – 11.4 = -1.0%. By contrast, under Scenario 2 we’d be talking about a 7.4% decline by 2020. With current oil consumption around 18.7 mb/d, that would correspond to a saving of 1.4 mb/d by 2020.
Note these calculations do not take into account further possible reductions from increased use of biofuels and natural gas for transportation.
My conclusion is that if the price of oil remains at its current value, an ongoing decline in U.S. oil consumption over the next decade is a plausible baseline scenario even without the currently planned CAFE standards. If the price rises modestly from its current value (as the IEA analysis assumes), given the increased commitment to conservation already embodied in current standards, a reduction in consumption by 2020 of the size assumed in the IEA report looks reasonable.
And a supply side analysis:
Some definitions:
GNE = Top 33 net exporters in 2005, BP + Minor EIA data, total petroleum liquids
CNI = Chindia’s Net Imports
If the GNE/CNI ratio were to hit 1.0, the Chindia region alone would theoretically consume 100% of GNE, which most of us think can’t happen, but the rate of decline in the ratio has accelerated in recent years, at least through 2011.
So, we are currently headed–at an accelerating rate of decline–toward a theoretical situation that would kill off most of the world economy.
Ratio of GNE to CNI versus annual Brent crude oil prices:
http://i1095.photobucket.com/albums/i475/westexas/Slide02.jpg
In 2002, there were 11 barrels of GNE for every one barrel that Chindia net imported, and the annual Brent price was $25.
In 2011, there were 5.3 barrels of GNE for every one barrel that Chindia net imported, and the annual Brent price was $111.
At the 2005 to 2011 rate of decline in the ratio of GNE to CNI, in 2030 there would be one barrel of GNE for every one barrel that Chindia would net import.
Professor,
Excellent analysis! But will the rest of the world increase consumption such that total world oil consumption will increase significantly? It seems to me that both China and India would be seeing increases in oil consumption as they become more affluent.
Ricardo, China has reached the “middle-income trap” and peak demographics with oil at $85-$110 vs. constant-dollar oil below $20 when Japan reached the same level, and in the $20s-$30s for the US. China’s growth boom is over. They will run trade deficits for energy, food, and materials, and experience net capital outflows hereafter.
China is 40-80 years too late to the auto- and oil-based development model, and the country will grow old before growing rich.
Tangentially to Jeffrey’s characteristically salient points, Peak Oil and oil exports are constraining global real GDP per capita growth while diverting scarce resources to extracting costlier crude oil and substitutes, restraining economic activity outside the energy sector.
Said differently, we cannot have profitable extraction of deep water, tar sands, and shale at $85-$110 AND have growth of real GDP per capita, especially not private real GDP per capita.
Looking out a business cycle or so, we are deploying scarce resources to extract costly crude substitutes but without growth of real GDP per capita to sustain demand that justifies the increasing capital investment in substitutes. I suspect sooner rather than later, we will discover that we have a lot more expensive deep water, shale, and tar sands extraction capacity at high fixed costs than demand will support, resulting in the risk of a cyclical crash in the price of crude and substitutes, a plunge in extraction, and huge write-downs for idle capacity.
This type of analysis won’t sit well with the folks that want to tax carbon dioxide.
It also seems that as auto sales increase in China over the next decades, technology “transfer” will result in an extremely efficient Chinese vehicle fleet.
Does anyone know the assumptions made with respect to fuel efficiency for the Chinese and developing economies fleet?
“Bill also reports evidence of a values shift of younger people away from cars, and some changes in patterns of home and work location that reduce total driving.”
Yes, and these folks decided they love their parents and decided to move in with them at the same time.
How remarkable that people just decided to leave the labor force, age out, and move in with loved ones just as the worst recession–and an oil shock–hit the economy.
Oh, please.
If there had been no oil shock and no recession, VMT would have continued to increase at a decreasing rate, but there would have been no collapse and no decline.
Plot out monthly vehicles sales and monthly US oil consumption from 2008 to the present. It will show US auto sales recovering (latest at 15.5 m SAAR, according to Bill McBride), and oil consumption continuing to decline. (Actually, this would be instructive for the readers to see.)
We’re being priced out of oil markets plain and simple.
As I have earlier noted, US oil consumption can reasonably be expected to decline at a 1.5% per annum rate (-1.6% in October).
If we allow a 2.5% annual efficiency improvement–I think this quite possible–then the most VMT can increase is 1.0% per year.
According to UMTRI, new car MPG has been increasing at a 3.7% CAGR in last few years. If we alow this pace, then VMT could ultimately increase by 2.2% per year. I don’t know, however, if a 3.7% pace is possible over an extended period of time.
So: I think efficiency gains will be on the high side, but I am pretty comfortable at present forecasting oil consumption to decline at 1.5%. (And keep in mind, my forecast is predicated on 100 mbpd of oil production in 2030–a higher level than the IEA, for example.)
Thus, I could see VMT gradually improving to a 1.5% per annum increase–a little higher than Jim’s number, but the same ballpark.
But if VMT had been going up at 2.7%, and we’re saying 1.3-1.5% going forward, then the US will be mobility constrained compared to earlier periods. Consequently, we should expect the country will also be GDP constrained (whether due to a lack of oil or demographics).
At the high end, potential GDP will be reduced by 1.2-1.4%, assuming a direct correlation between mobility and GDP.
However, growth will tend to migrate to non-mobility sectors. I think the recent correlation between mobility and GDP is something like 0.6 (I should go check this), so declining oil consumption might be expected to take something like 0.7-1.0% off of potential GDP growth.
My subjective sense puts the range at greater than 0.7% and less than 1.4%, probably 0.9-1.2%, figure a round 1.0% best guess.
This might be a useful number to keep in mind during US budget negotiations.
Uh, TJ, people who want to tax carbon don’t give a hoot about the fixed cost of oil.
Awhile ago I read an NBER paper that found a much stronger elasticity response to a permanent gasoline tax increase than was found with a comparable price increase due to normal market supply & demand factors. So a relatively modest increase in the gasoline tax could have a very pronounced effect on gasoline consumption. The intuition seems to be that a gasoline tax is regarded as permanent and people adjust long term decisions to reflect that permanently higher gasoline price; whereas normal market price changes are regarded as so much background noise. It takes awhile before people become convinced that a higher price due to fundamental supply & demand factors is in fact permanent.
http://www.businessweek.com/ap/2012-12-04/experian-more-subprime-buyers-getting-auto-loans
http://www.sacbee.com/2012/12/04/5030815/driving-off-fiscal-cliff-could.html
Steven, speaking of auto sales, note that as much as 40-45% of peak sales for the current Kitchin cycle to date are being financed by subprime auto loans, which are just below the ’07 peak. Oops!
Consider what auto sales would be were loans not being made to people who can’t afford to repay the loans.
http://loans.org/student/news/student-funding-delinquencies-record-high-92554
And the same situation applies for student loans, which are becoming, by definition, subprime loans, owing to the fact that most borrowers will not be able to obtain gainful employment so that they can afford to repay the loans “to the US gov’t”.
Peak Oil will eventually result in an end to what might be referred to as “DWP”: “driving while poor” (credit to Charles Hugh Smith), as well as borrowing to obtain a credential so that one can compete for a low-paying, part-time job with no benefits that does not require a post-secondary credential.
Peak Oil means the de facto end to the 20th-century auto- and oil-based suburban/exurban/penturban model of social, economic, and political organization.
By extension, China-Asia will not be able to replicate the model; ergo, global growth is over, only it’s still a bit early for there to be mass-social recognition.
Total VMT per capita topped out at 11000 miles per year in 2004 and is now hovering around 10000. Shouldn’t VMT per capita hit some kind of theoretical maximum where people can’t possibly spend any more time in their car? We’re already at 30 miles a day, which is probably about an hour in the car every day.
If VMT per capita stays roughly constant (it’s hard to imagine that driving 11,000 miles a year is “mobility constrained”), then VMT should increase at ~1% per year, just like population.
I still believe that the shock has changed driving behavior for the worse, we’d be a lot more efficient it if people drove more quickly and smoothly.
I suspect we should have seen a much better reduction in fuel consumption for the VMT drop we had. I think people slowing down in response to high fuel prices is a constrain to growth going forward. The cost in time is worse than fuel.
My commute is certainly worse than it was 5 years ago, despite there supposedly being less traffic.
(ie., I drive times will be worse than 2005 if we ever get back to traffic levels, particularly during peak times in marginally congested areas).
Given the aging fleet, and likely replacement of a large portion, it way washout the fuel inefficiency. But the time burder in the real cost.
In addition to the point about the amount of time people are willing/able to spend in their cars, what is the carrying capacity of our roads and highways? I don’t know what it’s like where you live, but here in the Boston metro area, traffic is unbearable most of the time. And that’s _after_ completion of the “Big Dig” project. I consider myself lucky in that I can easily bike to work and most errands and drive less than 100 miles a month, but the majority are still stuck in traffic jams. Why on earth would you _want_ to drive any more?
Link to interview with Mark Lewis, who along with Steve Kopits, and others, spoke at the recent ASPO-USA conference:
http://video.cnbc.com/gallery/?play=1&video=3000132570
(I thought that Mark and Steve, and many others, gave great presentations.)
The number of road vehicles has increased faster than number of people in America for decades. Most of us live in urban / suburban areas. Road miles cannot be added fast enough to accommodate the growth of cars and population in these areas because space is physically limited and expensive. Adding traffic signals slows flows exponentially. The result is greater congestion and that tends to reduce the utility of driving and VMT.
Did I miss something or are you applying your projected percentage reductions in light vehicle oil consumption to all domestic oil use (which is about double the light vehicle usage)?
In reality, although increasing gasoline prices, a gas tax increase, CAFE, and infrastructure reducing the need for VMT growth are all going to contribute to reduced oil consumption, there is even more fertile ground for reduction in U.S. oil consumption in sectors other than light vehicle transportation.
Eliminating primary use of heating oil and propane furnaces would reduce oil consumption by about 5%. Converting our 25,000 locomotives to LNG would reduce national oil consumption by 1%.
Existing fleet heavy truck efficiency improvements of 20%(primarily aerodynamic, but nitrogen and lightweight rims and super-singles, etc too), ala Smartway would reduce national oil consumption by 3%.
Just now getting to this post, Prof. Great stuff.
cf http://www.eia.gov/forecasts/aeo/er/early_production.cfm
What’s especially interesting is a potential build-out of natgas infrastructure to take advantage of the prolific resource here in N. America, suggesting N. America could become not only a lower-cost production province but a far greener economy as it grows. Amazing turn of events.
Hi Professor Hamilton,
I was trying to replicate your calculation for the age distribution of cars, and I have a question: Do the 11.5 million new vehicles sales in 2010 also include light trucks?
PB: Yes.