Now that we’ve closed the books on 2012, I thought it might be useful to take a look at where monetary policy has led us over the last four years.
The fireworks began when the collapse of Lehman Brothers in September 2008 led to a freezing of credit for all kinds of essential economic activities. The Fed stepped in with a number of emergency lending programs such as the Commercial Paper Lending Facility to help the commercial paper market continue to function, currency swaps to assist foreign central banks cope with emergency dollar needs, and the Term Auction Facility to provide direct liquidity to U.S. banks. These programs totaled over $1.7 trillion at the end of 2008, but have since all been wound down. The Fed came out of it all making a profit that was returned to the U.S. Treasury.
 |
The need for these facilities began to ease in 2009, but the economy was far from healthy, with unemployment continuing to shoot up. This led to the Fed’s decision in March 2009 to replace the emergency lending with large-scale purchases of mortgage-backed securities guaranteed by Government Sponsored Enterprises (the light yellow region in the graph below) and to a lesser extent long-term U.S. Treasury securities (light blue). These purchases were popularly described in the financial press as the first round of quantitative easing, or QE1. Their effect was to keep the total value of assets held by the Federal Reserve from falling as the emergency lending programs declined.
 |
Although the recession officially ended in June of 2009, the recovery proved to be disappointingly weak. In November of 2010, the Fed committed to a new round of long-term Treasury purchases in what became known as QE2. This shows up as a second growth phase in Fed assets in the graph above, which brought Fed assets up to $2.9 trillion by June 2011. A third growth phase (QE3, consisting of ongoing purchases of more MBS) began last September, as a result of which Fed assets should move above $3 trillion for the first time this month.
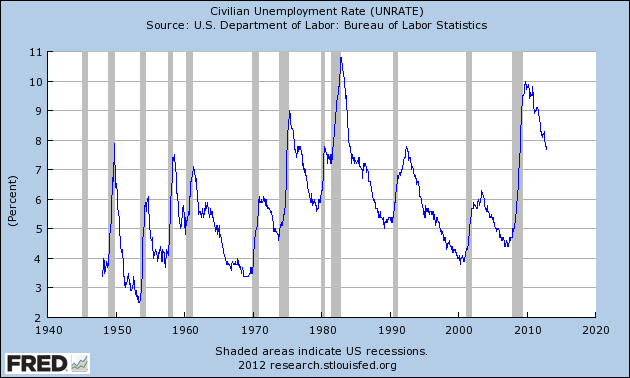
Why is the Fed doing this? Congress has given the Fed a dual mandate, instructing it to help the economy achieve maximum employment while maintaining price stability. There should not be much argument that we are still a long way from the first objective. The unemployment rate currently is at 7.7%, quite high by historical standards. At the most recent FOMC meeting, the Fed signaled that QE3 purchases the low fed funds rate will continue as long as the unemployment rate remains above 6.5% and inflation below 2.5%. [Note Dave Altig’s correction to my original wording.]
 |
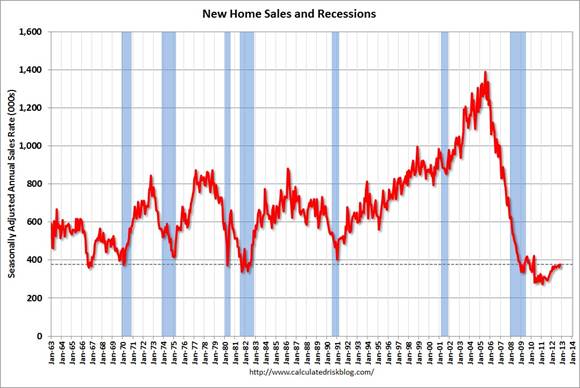
A key reason for the sluggish recovery is that, unlike other historical recessions, housing failed to make a positive contribution to GDP growth during the first three years of the current recovery. This is of course related to the fact that the Fed and other regulators let the housing boom get out of control in the earlier part of the decade. Nevertheless, getting the construction sector back to work is critical for the U.S. economy to fire on all cylinders. The Fed’s hope has been that by keeping mortgage borrowing costs low, QE1-QE3 may have given some boost to still-depressed sectors like housing. And in the latest data, we’re finally seeing some initial signs of that long-awaited recovery.
 |
The second part of the Fed’s dual mandate is controlling inflation. The Fed paid for QE1-QE3 by crediting the accounts of the banks that sold it assets with new funds in their accounts known as reserves. Banks could, if they wished, ask the Fed to redeem these reserves in the form of green currency delivered in armored trucks. But so far, currency held by the public has increased very little as a result of these operations. Contrary to popular impression, the Fed has not been “printing money like crazy.” Instead, banks have so far been content to end each day holding a huge volume of reserve deposits in their accounts with the Fed, as seen in the graph below of the liability side of the Fed’s balance sheet.
 |
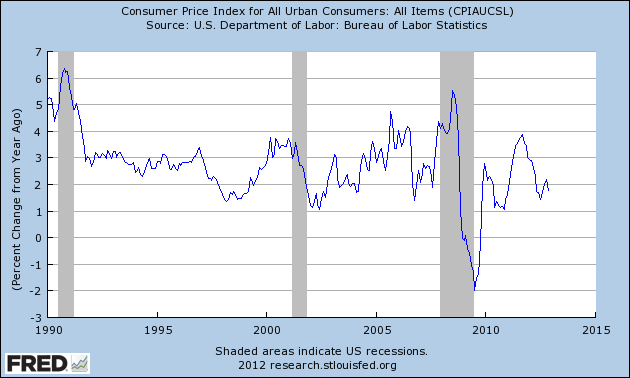
And how much inflation has all this produced so far? Very little, according to the consumer price index, which is up only 1.8% from last year.
 |
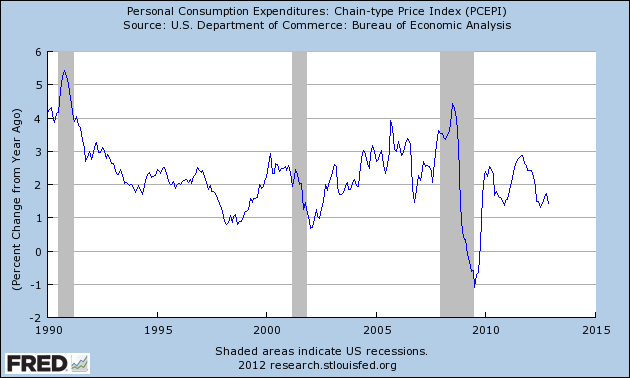
To be sure, the CPI is not without its flaws, among other concerns being its treatment of housing costs. But the separate inflation measure from the Bureau of Economic Analysis based on actual purchases of consumption goods and services shows only 1.4% inflation over the last 12 months.
 |
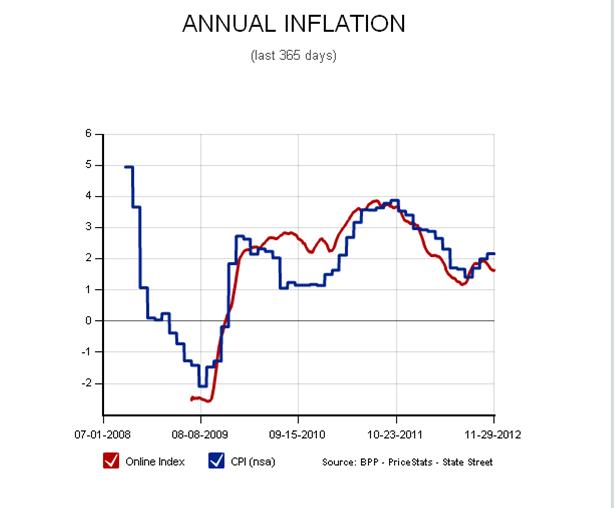
Those who insist that no government statistics are to be believed may prefer instead the Billion Prices Project run out of MIT, which comes up with an inflation measure based on prices of goods marketed on the internet. This index tells exactly the same story as the government statistics.
 |
Or you could look at what the Survey of Professional Forecasters expects for the years ahead. Answer– more of the same.
|
Headline CPI
|
Core CPI
|
Headline PCE
|
Core PCE
|
|||||
|---|---|---|---|---|---|---|---|---|
|
Previous
|
Current
|
Previous
|
Current
|
Previous
|
Current
|
Previous
|
Current
|
|
| Quarterly | ||||||||
| 2012:Q4 |
2.0
|
2.3
|
2.0
|
1.8
|
2.0
|
2.0
|
1.8
|
1.6
|
| 2013:Q1 |
2.1
|
2.1
|
2.0
|
1.9
|
2.0
|
1.8
|
1.9
|
1.8
|
| 2013:Q2 |
2.1
|
2.2
|
2.0
|
2.0
|
2.0
|
2.0
|
2.0
|
1.9
|
| 2013:Q3 |
2.2
|
2.2
|
2.1
|
2.0
|
2.1
|
2.0
|
2.0
|
1.9
|
| 2013:Q4 |
N.A.
|
2.3
|
N.A.
|
2.0
|
N.A.
|
2.1
|
N.A.
|
1.9
|
| Q4/Q4 Annual Averages | ||||||||
| 2012 |
1.8
|
1.9
|
2.2
|
2.0
|
1.7
|
1.7
|
1.9
|
1.7
|
| 2013 |
2.2
|
2.2
|
2.0
|
2.0
|
2.0
|
2.0
|
2.0
|
1.9
|
| 2014 |
2.3
|
2.3
|
2.2
|
2.2
|
2.2
|
2.2
|
2.0
|
2.0
|
| Long-Term Annual Averages | ||||||||
| 2012-2016 |
2.20
|
2.28
|
N.A.
|
N.A.
|
2.00
|
2.00
|
N.A.
|
N.A.
|
| 2012-2021 |
2.35
|
2.30
|
N.A.
|
N.A.
|
2.20
|
2.10
|
N.A.
|
N.A.
|
I also like Paul Krugman’s suggested inflation measure– the change over time in the dollar price for a one-year subscription to Shadowstats. Six years ago, it would cost you $175 to get a one-year subscription. For 2013, Shadowstats is offering a one year subscription for … $175.
Managing a $3 trillion balance sheet may prove to be more of a challenge for the Fed once conditions finally begin to improve. But based on what has been seen in the data so far, an objective observer would have to conclude that, when evaluated in terms of the Fed’s legislative mandate, QE1-QE3 have helped a little in terms of the employment goal and done no harm in terms of inflation.
Very good overview. One question…what specific challenges do you foresee in managing a $3+ trillion balance sheet?
Joshua Wojnilower: The challenge is to make sure that banks continue to want to hold $1.5 trillion in reserves. At the moment, that’s easy, because demand is essentially infinitely elastic. But as banks perceive more favorable outside investments, that will change. In principle the Fed should be able to control demand by raising the interest rate paid on reserves, or lower supply by selling assets. But getting the number exactly right might be tricky on a balance of $1.5 T; in the old days, just $1 B in excess reserves was enough to have some effects. It might be particularly tricky if inflation expectations start to pick up at the same time that unemployment is weak and/or concerns about fiscal sustainability or full subscription to Treasury auctions come to the fore. “Challenging” is I believe the correct word to use in talking about making the right decisions in such an environment.
Note that I do not insist that such a situation will arise, only that it could.
I’m not quite sure how much I like Krugman’s measure, even if I do enjoy the irony. That’s on account of his ongoing quest to dispossess Grandma – who couldn’t sleep nights if her retirement were “invested” in the stock-market casino – and who is getting 0.01% interest against the alleged 1.8% inflation. After all, subscriptions to services like Shadowstats form 0% of my spending, or, in most cases, of Grandma’s.
On the other hand, actual costs – food, housing rents, cars and gas for them, and other necessities – seem on the whole to have been galloping rather faster than 1.8% at the cash register, regardless of what, er, registers, or rather fails to register, in the comfy office of some handsomely paid statistician in the District. And that’s to say nothing of utterly uncontrolled inflation in compulsory spending for medical “care”, which looks set to exceed the GDP by 2030 or 2035, and which lately has yielded practically nothing in exchange for the ever-metastasizing expense, save for a few utterly useless, utterly worthless extra months as a vegetable in some “care facility”, plus, of course, tidy fortunes for lucky big-pharma, hospital-chain, and “care facility” executives. And it’s also to say nothing of … college tuition and related expenses, which seem every bit as out-of-control as medical “care”, and sorely in need of some creative destruction.
PaulS, Grandma is collecting Social Security and free Medicare while millions of workers are without jobs. She should be the last one complaining. And if fewer Grandma’s had voted for irresponsible Republicans, the economic recovery could have been much stronger.
To not mention declining labor share of income is a major weakness in the above overview. The effects of this are very problematic for the economy at a deep level. And the economy will not recover until labor share is raised substantially.
Here is my work that explains the dynamics of low labor share…
https://docs.google.com/open?id=0BzqyF_-6xLVERE5WT2RPSUJXU2M
The problems we now face have been developing for years before the crisis. The crisis was just a symptom.
Graphs 18, 19 and 20 in the link tell the tale.
The equation in graph 20 describes the rate of capacity utilization needed to keep the economy in productive equilibrium. The equation is too long to write here. But we need a capacity utilization rate of 87% right now and we are coming up woefully short. It is due to low labor share of income.
Cullen Roche was the first person who noted the deflation in Shadowstats subscriptions.
http://pragcap.com/why-is-there-deflation-in-hyperinflation-forecasts
Professor Hamilton,
Thank you for clarifying the challenges you foresee. A few months ago I suggested that “Interest-On-Reserves Regime” Will Rule Monetary Policy For The Foreseeable Future (http://bubblesandbusts.blogspot.com/2012/08/interest-on-reserves-regime-will-rule.html). As I see it, the Fed will adjust the IOR rate to establish interest rate policy while altering the balance sheet to manipulate inflation expectations. If you have a moment, I would greatly appreciate your thoughts on that interpretation.
interesting post though I have one remark/question
you say that currency has not increased like crazy, which is obviously true, to assert that an increase in the monetary base is not necessarily inflationary.
But the fact that the banks hold, in aggregate, excess reserves at the FED seems, to me, not a sufficient condition not to get inflation. The reason there is no inflation is that the monetary multiplier is low, leading the increase in the monetary base to a low expansion of the money supply (as you showed in several previous posts). In short, reserves at the FED do not tell us the complete picture about how the money circulates.
Is this line of reasoning correct ?
What a coincidence to have the Fed release moving to bank reserves amounting to $1.5 Trillion and the S&P 500 cash holdings are also in the same league. The simultaneous rise of these two holdings over the past two years is a clear vindication of the argument that monetary transmission is not reaching the intended participants that would create jobs, while its impact on inflation is only marginal, which however is not a good indication of the state of the economy.
Procyon Mukherjee
I have no confidence the fed will be able to unwind QE when the time comes.
As for the irresponsible GOP. Aside from QE, there has been no policy more irresponsible than the Democrat party presiding over one trillion dollar deficits for 5 consecutive years and failing to pass a budget.
So, we appear to have a fiscal deal this morning.
To me, the gist is the expiration of the payroll tax cut, which raises taxes on 77% on Americans, a nice regressive way to reduce the deficit.
The tax increase on the very rich is, well, not that impressive. In particular, the increase on dividends from 15% to 20% is not earth-shattering to my mind. The coupon clippers got off pretty easy, I think.
Those of us in the middle, above the payroll tax threshold, but below the $450,000 limit arguably did the best. Go figure.
In any event, the payroll tax increase is the meat; the high income tax rate is the potatoes.
And we have kicked the can down the road. As I tell my analysts: Always include the “do-nothing” option. It is inevitably the most likely outcome.
Obviously lessons from the great depression are memorized,the cures are matching the past records.
Central Banks are since this last decade, active financial players but their records on exit strategy is far from proved. They played the bonds markets,called the great moderation, played the equities markets to be nicknamed the lost decade, played the yield curve blessed by the time of exuberance. They played the credit market, the more profane time of the great recession.
Is the cure matching the great depression record in term of savings?
As published by the annals of “the US academy of political and social sciences” the private individual savings are depleted throughout the period 1913 1923 and savings are illusory when recorded private,as they belong to the financial centres and their agents. The number of millionaires is jumping from 7000 in 1914 to 40 000 in 1928.
The more the merrier, but unemployment bottleneck is not solved neither by taxing nor by perpetuating the merry go round of the financial markets.
E. Lambert is exhibiting the envelop or funnel where an incompressible pellet of underemployment is subsisting.Conclusion corroborating « Guest Contribution: “An assessment of the US jobless recovery through a non-linear Okun’s law »
Note that none of the models are showing where is the slack in employment both of these papers are driven through the definition of optimal capacity.
Without digressing further one may be willing to share an existential problem, central banks have memorized the panaceas when it comes to the cure of the great depression but seemed to have shown amnesia as regards the causes of the great depression.
Central Banks have 18 trillion USD assets as a vivid remembrance of their past deeds,if when it will get better,is it going to get worse or are they deemed to keep these assets frozen in their books and losses attached?
Professor,
This is not one of your better posts.
1. “…the collapse of Lehman Brothers in September 2008 led to a freezing of credit for all kinds of essential economic activities.”
It is absurd to say that one company can create the devastation that started in October 2008 especially a company with as low a reputation as Lehman Brothers. The collapse of Lehman Brothers was a nit that was over in a week.
2. “The Fed came out of it all making a profit…”
The FED does not make a profit. The FED takes resources from the private sector. This only profits the crony capitalists with their snouts in the public trough.
3. “The need for these facilities began to ease in 2009…”
Why? If the FED is making such a profit why should it stop “investing?” The recognition of a “need” that is temporary implies that the FED “profit” is no profit at all.
4. “…unemployment continuing to shoot up. This led to the Fed’s decision in March 2009 to replace the emergency lending with large-scale purchases of mortgage-backed securities guaranteed by Government Sponsored Enterprises … and to a lesser extent long-term U.S. Treasury securities ….”
What does bailing out the investment banks holding MBS have to do with unemployment? It is based on trickle-down wishful thinking. The unemployment was not coming from the investment banks but from the productive workers.
5. “Congress has given the Fed a dual mandate, instructing it to help the economy achieve maximum employment while maintaining price stability.”
This should be called the “Impossible Mandate.” If the dual mandate is the test the FED has failed miserably.
6. “…unlike other historical recessions, housing failed to make a positive contribution to GDP growth during the first three years of the current recovery.”
This confuses an indicator with an economic driver. Housing does not drive growth it reflects economic health.
7. “…let the housing boom get out of control…”
Shouldn’t this read “caused the housing boom to get out of control?”
8. “…banks have so far been content to end each day holding a huge volume of reserve deposits in their accounts with the Fed…”
Banks make their money by lending. If huge reserve deposits are sitting with the FED it is because the banks cannot find anyone to lend to. This is not something the banks want to do. This same thing happened in the Great Depression when huge deleveraging along with monetary devaluation piled up huge reserves.
9. “And how much inflation has all this produced so far? Very little…”
A bad definition of inflation causes errors in analysis. The real median household income has fallen 8.1% since 2007, dropping from $54,489 to $50,054. This means using the Krugman inflation measure a $175 Shadowstats subscription in 2012 would actually cost a family 8.8% more than the same subscription in 2007 though the price has not changed. That is the cost of inflation.
10. “…when evaluated in terms of the Fed’s legislative mandate, QE1-QE3 have helped a little in terms of the employment goal and done no harm in terms of inflation.”
Actually FED, congressional, and executive monetary and regulatory policies created a devastatingly poor employment participation rate with the number of idle workers growing every month. Additionally, the price change in the CPI is being held down by destroying asset values and hindering the productive capability of the economy. Any improvement is an illusion as we follow the stagnation path of Japan.
JDH: ” In principle the Fed should be able to control demand by raising the interest rate paid on reserves.”
Why not simply tax banks by raising reserve requirements? If the economy is growing too fast, do we still have to provide banker welfare by paying interest on reserves?
ppcm does well to put some deeper perspective on the economy.
I need to point out that just from real GDP growing through time in an economy, the dynamics of equilibrium change. I realize this is many times just a theoretical thing for the classroom, but the data is showing that we are in a dynamic of being much closer to a steady state of capital formation.
Supply-side economics was a productive idea back in the 60’s and 70’s, but it is very counter-productive now. We are now on the other side of the capacity utilization equilibrium. The US economy is naturally maturing and reaching a steady state where labor needs to receive a greater share of the income, not less.
To think that the weakness in construction after the crisis hit made for a slow recovery is useless economic understanding in the situation we find ourselves. The problems go so much deeper now than what construction can or cannot do.
The blog “Calculated Risk” places a lot of emphasis on housing, but housing is being moved by a tsunami of stronger undercurrents from here on out.
Printing removers supply/demand information from prices, leading to capital misallocation. An example would be the recent global housing Minsky, which has taken trillions to bail banks out of.
JDH, I couple of years ago you wrote that the FED could either (I don’t remember which) remain profitable or solvent for about 10 years under its then current policy. What would you project now?
The US credit rating became an issue in 2010 and I think a false narrative developed when the debt ceiling debate happened. The credit of the US was questioned before the debate due primarily to spending, the debt ceiling was just another straw on the camels back.
How long can the FED cover our deteriorating long-term financial credibility?
Also (probably more of a question for Menzi), how sensitive are treasury rates to demand? What would a small drop in demand from the FED, sovereign entities, or foreign investors due to our governments interest cost?
What might cause a drop in demand for treasuries?
Hi James and dear blog readers, happy new year and good luck in 2013 !
James Hamilton says,
I also like Paul Krugman’s suggested inflation measure– the change over time in the dollar price for a one-year subscription to Shadowstats. Six years ago, it would cost you $175 to get a one-year subscription. For 2013, Shadowstats is offering a one year subscription for … $175.
For that you win the Snark of the Year Award… for 2013.
Why is anyone using CPI, or its variants, as a measure of inflation?
Definition: Inflation is growth of the MONEY SUPPLY. Any changes in prices are secondary to changes in the money supply, no?
Unfortunately, there are no longer any published numbers for M3, but Shadowstats has a good estimate.