Those who have been told that oil production is booming may be wondering why the prices of oil and gasoline are climbing again.
 |
According to the EIA, world petroleum production in the first 10 months of 2012 averaged 88.8 million barrels a day. That’s 2 mb/d, or 2.3%, higher than in 2010. The IMF estimates that world GDP grew by 7.1% between 2010 and 2012. If we used a global income-elasticity for petroleum demand of 0.75, we might have anticipated that a 5.3% increase in petroleum production over the last two years would have been necessary to keep the price of oil from rising. Ongoing conservation, for example, in the form of continued improvement in fuel economy, has been a key factor keeping the oil price from rising more in the face of world income growing much faster than world oil production.
China likely consumed nearly half of the global 2 mb/d increase. The EIA reports that China increased its petroleum consumption by almost 500,000 b/d in 2011, and preliminary estimates are that China added another 420,000 barrels to its daily consumption in 2012.
Moreover, about a quarter of the 2 mb/d supply increase reported by the EIA over the last two years came in the form of natural gas liquids. These hydrocarbons are in gas form at ambient pressure and temperature, but become liquid with less pressure than is required to liquefy single-carbon methane.
 |
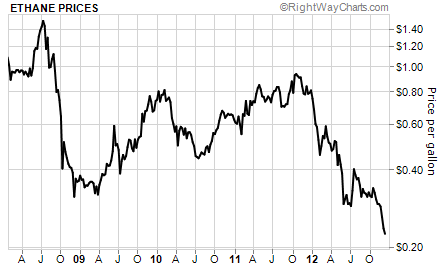
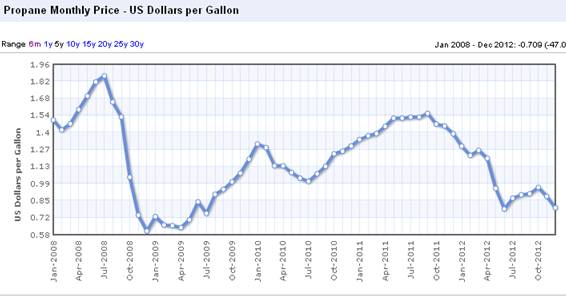
About 80% of natural gas plant liquids are in the form of 2-carbon ethane or 3-carbon propane. Ethane is primarily used to make ethylene for petrochemicals and manufacturing, while propane has a variety of uses. But neither ethane nor propane is used to make gasoline. That’s why the boom in production of NGL’s has meant rapidly dropping prices for ethane and propane but not for the price of gasoline.
 |
 |
|
|
| New Jersey Historical Gas Price Charts Provided by GasBuddy.com |
It’s obvious from the above price charts that it makes no economic sense to add gallons of ethane or propane to gallons of crude oil to try to summarize global oil supply. But growth of natural gas liquids has been a key factor in the reported increases in “world oil supply” over the last few years and is also a key component of recent optimistic assessments of future oil production by Leonardo Maugeri and the IEA.
There is no question that the boom in production of natural gas liquids is providing a great benefit to industrial users of ethylene. But if you’re waiting for it to lower the price you pay for gasoline at the pump, you may have to wait a while longer.
It’s not that bad to count propane. Most older gasoline engines will run on it with only minor work and it would be trivial for an auto manufacturer to make a propane powered car if the price differential got big enough. The argument that you don’t make gasoline from NGL is also faulty because the amount of gasoline you get out of a barrel of oil and the cost of getting that gasoline varies wildly with the source of the oil.
So your calculation of what I call inherent demand–which assumes an unconstrained oil supply–is 5.3%. My number for inherent demand is higher, by about 1.0-1.5%. Why? Because the OECD is starved for oil–just check the VMT numbers. So if we had affordable oil, at this point we’d expect demand growth on the order of 2% pa in the US, maybe a bit more.
Also, demand in China would likely be running a bit ahead of GDP at this point in its development. That would also boost the number a bit.
So I think the 5.3% is actually a bit low. For 2013, using STEO data, I calculate inherent demand growth at around 3.5%, that is, around 3.2 mbpd / year. Which is a very large number.
To provide some context, when oil supply growth was essentially unrestricted, from 1960-1972, the oil supply grew at 2.7 mbpd / year on average. And that was pre-peak US and when Saudi was still young. So 3.2 mbpd / year is a whopping amount of demand–but quite in keeping with other whopping amounts China has demanded in recent years.
Also note that this excess demand has not led to prices increases. Why not? Because we have reached the carrying capacity of the non-OECD economies. This also implies that demand is no longer price inelastic on average–or else we would have seen a price spike. Consequently, the excess demand showed up as volume suppression. And whose volume did we suppress? That of the US and Europe.
Hence falling oil consumption in these two areas has been a key means by which China’s oil consumption could grow. That’s the sobering reality.
Steven correctly writes: ” . . . [T]his excess demand has not led to prices increases. Why not? Because we have reached the carrying capacity of the non-OECD economies. This also implies that demand is no longer price inelastic on average–or else we would have seen a price spike. Consequently, the excess demand showed up as volume suppression. And whose volume did we suppress? That of the US and Europe.
Hence falling oil consumption in these two areas has been a key means by which China’s oil consumption could grow. That’s the sobering reality.”
Cue Jeffrey Brown . . .
Peak Oil = peak global crude oil per capita = peak oil exports per capita = peak global industrialization per capita = peak global trade per capita = peak “globalization” = peak Anglo-American empire = peak real GDP per capita = peak gov’t receipts per capita = end of growth = end of capitalism = end of Oil Age civilization. Full stop. Print.
One other important point: outside of North America, non-OPEC oil production has risen very little in the last few years. Thus, landlocked U.S. and Canadian barrels depress local prices but only serve to back out some higher cost imports. There’s virtually no supply growth currently happening.
Gail Tversky at “Our Finite World” presents charts arguing that in the USA, increased (car) fuel economy has so far played a relatively minor role.
There have been significant decreases in “other”, which includes jet fuel, fuel oil, asphalt, and industrial uses. (My guess: fuel oil may be being replaced with natural gas heating or electric heat pumps, and demand for asphalt depends on state and county budgets.)
Better fuel economy in road vehicles will have a bigger effect in years to come.
ourfiniteworld.com/2013/01/31/why-is-us-oil-consumption-lower-better-gasoline-mileage
Isn’t it all [insert name of your least favorite politician]’s fault?
Still the price of gasoline has no correlation, except for what the OPEC wants for you to pay. But I do not define OPEC as just certain countries. I define it as to what profit the queen needs, the payoffs to the sultans, the profits that a few american speculators need, that determine the price you will pay. Yes there are a few people that make millions per microsecond because they can, And they see your life as less important, your freedom as less important,and themselfs as privileged, “rulers” by the grace of god.
Bruce –
I am personally not convinced that a relatively poor performance by the oil supply necessarily means an end to growth. Indeed, in the eight years since the global oil supply stalled, global GDP growth has actually been pretty good.
Just not in the OECD countries. (Apologies, it should have read: “reached the carrying capacity of the OECD economies”, not the “non-OECD economies.” In our model, by definition, oil prices must remain below the carrying capacity of the non-OECD economies if the oil supply is actually growing. Otherwise, demand would be falling across the board as supply is rising. This would lead to a fall in oil prices.)
Dave – The first thing to blame is geology. Jim has written a lot about this, and it’s right on the money.
After that, I think we can blame the economists. Who has said that oil is constraining OECD GDP growth? Menzie? Krugman? Thoma? Sumner? Even Tyler? Romer? Summers (of the Larry kind)? Bernanke? Even Jim has only sort of said it.
And why not? First, because most economists are not familiar with the oil statistics. Second, they all assume (as I did prior to 2007) a demand-constrained world–and thus their mindset is not prepared to deal with a supply-constrained approach. Further, many do not understand or believe that OECD oil consumption will continue to fall, although it is directly implied in Jim’s analysis above. (If you have excess demand and prices are not rising, then someone has to be yielding consumption.) Finally, oil is unfashionable and unloved. Who wants to stand up for CO2? Very few people. So the issue is largely ignored by the economics community.
If economists are (willfully) ignorant about oil and the economy, why would we expect that politicians would be better informed?
Gail’s article is excellent. Better than I would have done.
One chart may draw attention as well, the price of heating oil March contract. It is enjoying its overstay at higher prices , although volume are showing sign of fatigue and April volume may be more subdued .The seasonality of heating oil price is sportive and so is its corrrelation with oil price.
http://futures.tradingcharts.com/chart/HO/
http://www.wtrg.com/daily/heatingoilprice.html
Long term chart is waiting for a pattern
http://www.futuresbuzz.com/heatingoillt.html
Interesting monthly projection on commodities prices World Bank
Prospects commodities markets World Bank
Steven writes: “Indeed, in the eight years since the global oil supply stalled, global GDP growth has actually been pretty good.”
http://data.worldbank.org/indicator/NY.GDP.PCAP.KD
http://data.worldbank.org/indicator/NY.GDP.PCAP.KD/countries?display=graph
Steven, please see the links above (data are not yet available for ’12). World real GDP per capita has averaged 1% since ’05 and ~0.3-0.4%/year since ’07-’08 vs. 2.1-2.5% before ’07-’08, and long-term 2.1% for the US (negative since ’08).
The deceleration of world real GDP per capita to the margin of error around 0% is occurring coincident with Peak Oil, $100+ oil, falling net oil exports per capita, and peak Boomer demographic drag effects kicking in for the developed countries (and soon for China). If it’s not yet the end of growth, it’s the beginning of the end of growth.
Also, despite the resource extraction and unreal estate booms/bubbles in Canada and Australia, real GDP per capita is flat to down since ’07-’08, i.e., “Dutch Disease” effects.
arxiv.org/pdf/1205.5671
One more note, Steven and all. See the link showing the linear relationship (as opposed to the presumed exponential relationship) of real GDP per capita to population growth and the implication that the faster rate of real GDP per capita since after WW II was a function of the peak Oil Age era of mass industrialization and a higher exergetic log limit.
I suspect that, were the author(s) to examine the relationship of population, real GDP per capita, and the constant dollar price of oil over the period referred to in the paper, they would find a log-linear limit bound function of population and real GDP per capita to the supply and price of oil.
The primary inference would thus be that the oil- and auto-based model/system of industrial and post-industrial economic growth/development reached the onset of the log-linear limit bound in the 1970s-80s in the US with US peak domestic oil extraction and is now similarly occurring for the rest of the world.
Growth of real GDP per capita is no longer possible hereafter.
Professor Hamilton is one of the most outstanding econometricians of our time. Unfortunately, his understanding of petroleum economics and geology is lacking. One economist who understood the issue very well was Professor Adelman. The oil curse which has dominated macroeconomics for 40 years is now ending, broken by technology. Within ten year years the problem will not be high – but low prices. Adelman was a student of the oil industry long before the subject became popular. He also did his homework, unlike some econometricians. Trained in industrial organization, he wrote in the 1960s that oil industry costs would decline and that prices would decrease slowly over time. He was wrong for about forty years. As he later explained, prices were held higher because low-cost producers operated a joint monopoly.
Adelman asserted the absence of a resource constraint as far back as 1970:
In the United States, annual crude production is about three billion barrels, “proved reserves” about 30 billion, oil-in-place about 300 billion barrels. I cannot emphasize too strongly that the 300 billion represents conventional oil deposits now known and previously exploited. It has nothing to do with deposits “to be discovered,” nor with oil shales.
In a 1991 essay, he expanded on this view, noting that few agreed with him. (He might have added that consensus does not determine a proposition’s truth. If it did, Columbus would have fallen off the edge of the world.)
My view of supply has not been shared by all. The 1973 price explosion was greeted by many economists, and not the least distinguished, as the long-delayed inevitable scarcity. In this view, temporary forces had just happened to keep all mineral prices flat or declining—for a remarkably long time. A great structure of the theory and calculation now arose as an upside-down pyramid, resting on one assumption. As a Nobel Laureate wrote: [Hotelling] “applied the calculus of variations to the problem of allocation of a fixed stock over time.” All of the recent literature is essentially based on Hotelling’s paper.
Adelman then added this observation:
The fixed stock does not exist. We cannot rescue the concept by making the “economic proportion” of the unknown total in-ground. That is circular reason. For the economic proportion is an implicit unverifiable forecast of all future output, of what will be worth producing through time. That depends on changes in science and technology [emphasis added], which will determine future costs and price, hence future output. One cannot estimate these costs and prices by starting with their assumed result. In fact, ultimate production is unknown. The much larger amount in the ground is unknowable and irrelevant, a nonbinding constraint.
A group of us who worked with Morry at MIT are now working to spread the word of his vindication.
In order to make a material difference in the global supply situation, especially in regard to net exports, it seems to me that not only do oil companies have to continue to offset the underlying decline rates from conventional production, they have to offset the overall increase in decline rates from existing wellbores, as an increasing percentage of production comes from shale/tight sources, and they also have to offset the post-2005 decline in Global* and Available Net Exports.
Normalized liquids consumption for (2005) Top 33 Net Oil Exporters, China, India and the US, from 2002 to 2011 (2002 consumption = 100%, BP data), versus annual Brent crude oil prices (in red):
http://i1095.photobucket.com/albums/i475/westexas/Slide2-6_zps4d059c52.jpg
I think that it is likely that these consumption trends will more or less continue. As I have occasionally noted, at the 2005 to 2011 rate of decline in the ratio of Global Net Exports of oil (GNE*) to Chindia’s Net Imports (CNI), in 18 years the Chindia region alone would theoretically consume 100% of GNE.
Unless a given American consumer directly or indirectly benefits from oil and gas activity, rising US crude oil production, to a level well below our 1970 peak rate, is pretty much irrelevant to them. I suspect that they are far more focused on the price at the pump, which is much more closely linked to global crude oil prices than to the WTI price.
Available Net Exports (GNE less Chindia’s Net Imports), 2002 to 2011:
http://i1095.photobucket.com/albums/i475/westexas/Slide3-5_zps99b2cedd.jpg
GNE/CNI Ratio, 2002 to 2011, versus annual Brent crude oil prices:
http://i1095.photobucket.com/albums/i475/westexas/Slide4-4_zps9a9c4aed.jpg
GNE/CNI Ratio, 2002 to 2011, versus total global public debt:
http://i1095.photobucket.com/albums/i475/westexas/Slide5-3_zps9a533a56.jpg
GNE/CNI Ratio, 2002 to 2011, extrapolated out to 2030:
http://i1095.photobucket.com/albums/i475/westexas/Slide6-2_zpsce056b88.jpg
*Top 33 net exporters in 2005, BP + EIA data, total petroleum liquids
Steven Kopits at February 10, 2013 04:33 PM: The full adjustment of demand to prices takes some time. We are still in the process of adjusting to what happened in 2008, for example, in the form of gradually replacing the stock of vehicles on the road with more fuel-efficient models. I would expect that if GDP and oil prices were constant, oil consumption would continue to decline from current values. For this reason, I did not mean to suggest 5.3% growth as the kind of baseline case you refer to. Instead, I was just mentioning it for purposes of comparison.
Philip, what price of crude/costlier substitutes is too high to allow growth of US real GDP per capita? Whatever the price, we reached it in the US in ’05-’08.
At what rate and period of deceleration of US real GDP per capita will coincide with US crude/substitute extraction peaking per capita.
Crude oil extraction per capita is down 60% since 1970.
US crude oil extraction per capita is back to the levels of the mid- to late 1930s to before WW II.
Global crude extraction per capita is down 10-11% per capita, which is where the US was in the mid- to late 1970s.
In addition to Jeffrey’s mentioning increasing decline rates, the increasing marginal costs at the given US domestic and global demand implies that the rate of growth of US domestic extraction is already peaking.
The constant dollar price of oil in the next 5-10 years might, and probably will, be lower; but it will be because global real GDP per capita peaked with Peak Oil, peak or falling global oil extraction, and falling oil exports, and declined along with demand for oil.
There is ample evidence to show that $100+ oil with falling oil exports per capita will not permit growth of real GDP per capita hereafter, which in turn implies that growth of demand for oil and growth of oil extraction will decline.
Jim –
No, I think your original analysis is correct. That 5.3% over two years is very much what we would see–maybe more–if oil prices fell back to, say, $80 / barrel.
The tricky part is “oil prices were constant”. At $80, you’d see significant growth in demand; at $115, you continue to see significant declines. Depends on which “constant” you mean.
Personally, I am not sure what you mean by “still in the process of adjusting to what happened in 2008, for example, in the form of gradually replacing the stock of vehicles on the road with more fuel-efficient models.”
Is this something exclusive to oil? Or does this also apply to, say, natural gas? Should not Cheniere then still be trying to adjust to natural gas at the $13 / mmbtu which occurred at the same time as $147 oil?
I am of the view that people make purchase decisions primarily under the conditions that pertain, which may be influenced by historical or anticipated events. I think most people buying a car today are thinking $3.50-4.00 per gallon for regular–in the range they have seen in recent times. But if they’re converting to gas heat, they’re not thinking $13 / mmbtu.
Bruce –
IMF data puts average GDP growth 2005-2012 at 3.7% at constant prices for the world. That’s the number I was using.
Of course, that’s not per capita, and I think the World Bank calculates some of these things differently.
As for Mr. Verleger:
Here are some stats for you (EIA, STEO, Q4 data).
In the last two years, the global liquids supply is up 1.5 mbpd.
Of this, the US is up 1.5 mbpd, the oil sands are up 0.5 mbpd, Iraq is up 720 kbpd.
Do the math, and everyone else is down 1.2 mbpd over the last two years. US shale / tight oil represents literally 100% of total global supply growth in the last two years.
We have invested approx. $1.2 trillion in upstream spend in that period. Of this, about $250 bn can be attributed to NA unconventionals and Iraq, and perhaps another $250 bn to natural gas. Thus, $700 bn in upstream spend over the last two years is associated with a 1.2 mbpd fall in oil production.
This would seem to suggest that the oil supply is rolling over. It’s peaking out now—that’s the plain vanilla interpretation.
Here’s a youtube video on a model that relates the demand for gasoline, in the US, to the price. The bottom line is, the price is too high, so demand is still dropping.
http://www.youtube.com/watch?v=XJLtsfeHbvg
Steven Kopits wrote: Personally, I am not sure what you mean by “still in the process of adjusting to what happened in 2008, for example, in the form of gradually replacing the stock of vehicles on the road with more fuel-efficient models.”
Is this something exclusive to oil? Or does this also apply to, say, natural gas? Should not Cheniere then still be trying to adjust to natural gas at the $13 / mmbtu which occurred at the same time as $147 oil?
Interesting question. Clearly expected future prices also matter. In that respect North American natural gas and globally traded oil are very different.
Otherwise, it would appear to be cost effective for many automobile owners to drive their older, fuel inefficient vehicles into the ground before replacing them. The capital cost component of vehicle services is significant.
Question for JDH and all:
Are US gasoline prices still trading close to he Brent Crude benchmark, rather than WTI?
While all the details in the article are correct, the issue can be stated more simply as, “We’ve extracted the cheap stuff with a high net energy already. What remains is more expensive to get, and yields less net energy.”
Though the effect of net energy on price isn’t immediately obvious, it does factor in on a macro scale. If the energy in a barrel of oil got you 20 oil barrels of energy back in the 70s, but now only gets you back 10, positive net energy, which is really what you’re buying, is now more scarce, and therefore, more expensive.
You can even use price as a measure of net energy scarcity, which would indicate that the price of a unit of hydrocarbon net energy has tripled in 15 years. “Hydrocarbon net energy by unit” is probably a more honest and useful measurement when discussing hydrocarbon energy depletion.
Steven Kopits at February 11, 2013 12:11 PM: If you’re buying a new car today in the expectation of a gasoline price of $3.50 a gallon, and you bought your existing older model on the expectation of $2.00 a gallon, when you replace the old car with the new, you’re going to use less gasoline than you used to. There is a delayed response to the price increase in the sense that old cars stay on the road, and when they are replaced by newer models, consumption next year will go down in response to something that happened 5 years ago.
westslope at February 12, 2013 07:42 AM: U.S. retail gasoline prices this winter fell below what you’d expect based on the cost of Brent, but are now catching back up. I hope to write about this in my next post.
Steven, thanks.
Total global oil extraction has averaged 0.8%/year since ’05 (1.73% from ’94 to ’05 and 2% from ’01 to ’05), whereas the rate per capita is -0.3%/year. Since ’07-’08, the rate per capita is -0.3%.
Global crude oil (and condensates) extraction has averaged an annual growth rate of just 0.4%/year since ’05 (1.55% from ’94 to ’05 and 1.96% from ’01 to ’05), with the rate per capita at -0.77%/year. Since ’07-’08, the rate per capita is -0.55%.
These growth rates since ’05-’08 comply closely with the WB’s growth rate data for real GDP per capita.
The supply per capita and rate of change of growth of crude and total oil extraction peaked in ’04-’05 and has decline per capita since. The tripling of the average price of crude oil since ’05 has not resulted in a growth of supply per capita.
As you correctly imply, costs of extraction are increasing as supply peaks and rolls over, most notably per capita. Going nowhere in the process, we are exerting an increasing amount of energy per capita in an attempt to walk faster up the down escalator of the emerging post-Oil Age, post-growth epoch.
We cannot profitably extract lower-quality, costlier oil and substitutes at $120 Brent AND grow real GDP per capita in the US, EU, and Japan, and eventually not globally. The human ape species has never faced such a net energy per capita trap on a planetary scale.
Here is a more upbeat projection of U.S. energy independence. I’ll leave it to the experts to tell us where he (Citigroup’s Edward Morse) is wrong.
http://www.cnbc.com/id/100450133
Ah, yes, Jim. Agreed.
Michael Sivak of the UMTRI has done some nice work on this. In your inbox. Might be worth writing a bit on the efficiency tail.
Ed Morse is the very pillar of optimism for the oil supply.
Ed tells us oil was to fall back to $65-90 / barrel. Apparently, Brent wasn’t listening to him, and decided to surge to $119 instead.
more US and global supply is happening. for the US you can look at the real energy trade deficit falling nearly a third in the last two years and exports mostly product(given the general no crude export rule) up 28%
true there is some more global demand.
But a big feature is much of the new shale etc internal US stuff cant get to a world market. that way down in price Henry hub say like $20 bbl lower. But the domestic refiners like Valero are pricing all their products at WTI type pricing. and making gigantic crack spreads
Rising Unconventional Production Versus Declining Post-2005 Net Exports
Some major net exporters, e.g., Canada, are showing increasing net exports, primarily as a result of increasing production from unconventional sources.
However, Canadian net oil exports should be put in the context of regional data, and combined net oil exports from the seven major net exporters in the Americas in 2004 (Canada, Mexico, Venezuela, Colombia, Argentina, Ecuador and Trinidad & Tobago) fell from 6.1 mbpd in 2004 to 5.1 mbpd in 2011 (BP, total petroleum liquids).
In other words, rising Canadian net oil exports have so far only served to slow the post-2004 decline in Western Hemisphere net oil exports.
And of course, many people believe rising production from shale resources around the world will result in an indefinite increase in global crude oil production, which perhaps might sufficient to more than offset the ongoing post-2005 decline in Global and Available Net Exports. However, it seems unlikely to me that a production base with a steady increase in underlying decline rates, and with thousands and thousands of shale oil wells quickly headed toward stripper well status (10 bpd or less), will make a material long term difference in the global net export situation. In addition, operating costs in most other prospective shale plays around the globe are higher, and frequently much higher, than in the US Lower 48.
Prior to Ed Morse, Daniel Yergin used to periodically issue calls for lower oil prices, based on the premise that a flood of new oil production would drives prices down (Yergin is still in the Cornucopian Camp, but I don’t think he makes specific price forecasts any more).
In any case, in November, 2004, Yergin predicted that oil prices would be back down to a long term index price of $38 per barrel one year later, in November, 2005. Several years ago, this led me to propose a new price metric, where One Yergin = $38 per barrel. As Steven noted, Brent is currently over Three Yergins per barrel.
As they say, pick a price or a time frame, but not both. My fearless prediction is that we will probably see a continuation of what we have seen since the late Nineties–a cyclical pattern of higher annual highs and higher annual lows in oil prices, as the developed net oil importing countries, led by the US, continue to be gradually shut out of the global market for exported oil, as the developing countries, led by China, continue to consume an increasing share of a declining post-2005 volume of Global Net Exports of oil.
Jeffrey, there are technical price setup patterns implying at least the potential for WTI and Brent in the $40s-$50s at some point in the next couple of years, presumably coincident with the risk of another deflationary global recession, i.e., “demand destruction” and scaling out of longer-term futures premia by specs and hedgers.
Bruce,
Many things are possible, but my bet is that the next year over year decline in annual Brent crude oil prices will not be below the prior low that we saw in 2009, $62, and it will probably be much higher than $62.
Here is the progression in recent annual lows:
1998: $13
2001: $24 (85% higher than 1998)
2009: $62 (158% higher than 2001)
Bruce, have you considered that unpopular and/or immature non hydrocarbon energy sources might be reconsidered if supply is sufficiently constrained? Of course nuclear power and rechargeable batteries lead that list. Solar has been somewhat a green pipe dream, but its getting realer recently. Liquified coal is plentiful and obvious if “we” value growth over cleanliness.