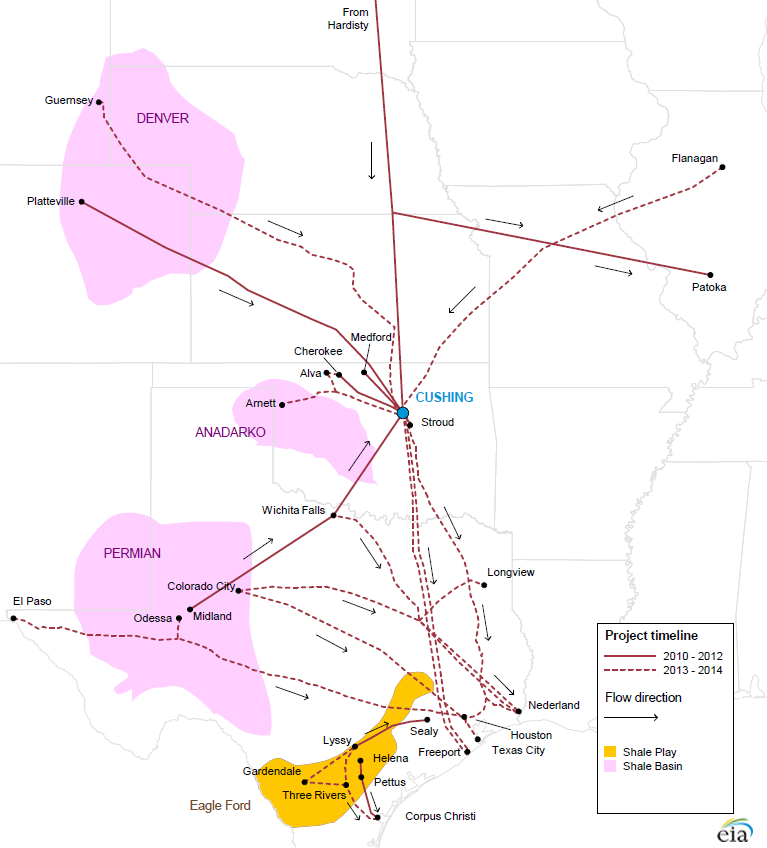
The EIA last week released a nice summary of planned additional U.S. pipeline capacity.
The reversal of the Seaway Pipeline began last May to carry 150,000 b/d of crude oil from Cushing, Oklahoma to refineries near Houston. Last month the capacity was increased to 400,000 b/d, and a second pipe twinning the first is expected to bring the total capacity up to 850,000 b/d by 2014:Q1. At the same time, TransCanada expects the Gulf Coast portion of its Keystone Project to be completed by the end of this year with the capacity to transport an additional 700,000 b/d. Six other projects are planned or under construction that would bypass Cushing and could carry an additional 355,000 bbl/d from west Texas directly to the Gulf Coast by the end of this year, with 478,000 b/d added to that in 2014. Yet additional new projects will help transport new production from eastern Texas to the Gulf.
|
Will all this new capacity relieve the surplus at Cushing? It’s an impressive amount of new capacity to take oil out of Cushing, but even more has been coming in. The EIA offers this summary:
In sum, over the past three years, 815,000 bbl/d of new pipeline capacity delivering crude oil to Cushing was added. Over the same period, only 400,000 bbl/d of new pipeline take-away capacity was added. During the next two years an additional 1,190,000 bbl/d of pipeline capacity for delivering crude oil from Canada and the midcontinent to Cushing is planned, but this is balanced by 1,150,000 bbl/d of planned pipeline capacity additions to deliver crude oil from Cushing to the Gulf Coast. In addition, about 830,000 bbl/d of new pipeline capacity is planned to move crude oil directly from the Permian Basin to the Gulf Coast, avoiding the congested Midwest. If this capacity is constructed and fully utilized, waterborne imports to the U.S. Gulf Coast, particularly of light sweet crude oil, could drop significantly.
Eventually we should get enough capacity to narrow the Brent-WTI spread, but given the above it could take a while. Futures markets seem to be anticipating that Brent will decline a little faster than WTI over the next four years, but with an $8 spread still remaining by the end of 2017.
|
|
Based WTI crack spreads, Mid-continent refiners are basically paying WTI based prices for crude, but largely charging Brent based prices for refined products. (The crack spread is the gross profit that refiners make from buying and refining a barrel of crude oil.)
Based on the current crack spreads , I suspect that a narrowing of the Brent/WTI crude price spread will mostly be a non-event for consumers.
I suspect that a narrowing of the Brent/WTI crude price spread will mostly be a non-event for consumers.
Which is why consumers could care less about this pi***ng match between drillers, pipeline operators and refiners. It’s just billionaires trying to screw other billionaires.
We could just skip the whole pipeline thing and levy a windfall profit tax on the producers and everyone would be better off.
Joseph –
Ah, if there were only windfall profits in the shale plays, how good it would be.
However, if you’d care to check, you’d see falling rig counts in the Eagle Ford and Bakken since June of last year. It’s not clear the economics are holding up.
As for the oil sands, a new integrated project including an upgrader is thought to require an oil price of $120.
We could consider an additional tax on producers, but at present, it would seem that costs are increasing faster than oil prices. Thus, maintaining oil production is likely to require tax breaks in the near future.
Following is a link to a paper on what I call the Export Capacity Index (ECI) that I have been working on for quite a while:
http://aspousa.org/2013/02/commentary-the-export-capacity-index/
The observed 2005 to 2011 rates of change for the (2005) Top 33 net oil exporters were as follows (P = production, C = consumption, NE = Net Exports, ECI = P/C):
P: +0.3%/year
C: +2.7%/year
NE: – 0.8%/year
ECI: -2.4%/year
If we extrapolate the 2005 to 2011 rates of change in production and consumption, then post-2005 Global CNE (Cumulative Net Exports) were depleted by about 22% in the six years from 2005 to 2011, and GNE (Global Net Exports) in the year 2021 would be about 40 mbpd, versus 44 mbpd in 2011.
Note that given a 2.7%/year rate of increase in consumption, in order to just maintain constant net exports, the rate of increase in (2005) Top 33 Net Exporters’ production would have to rise from 0.3%/year to 1.1%/year.
In any case, let’s assume a decline in the rate of increase in consumption, down to 2.0%/year, from 2011 to 2021, and let’s look at three productions rates of change: +2.0%/year, zero rate of increase and -2.0%/year, from 2011 to 2021.
High Case:
P: +2.0%/year
C: +2.0%/year
GNE in 2021 would be 53 mbpd, versus 44 mbpd in 2011.
Middle Case:
P: 0%/year
C: +2.0%/year
GNE in 2021 would be 39 mbpd, versus 44 mbpd in 2011.
Low Case:
P: -2.0%/year
C: +2.0%/year
GNE in 2021 would be 28 mbpd, versus 44 mbpd in 2011.
Note that at Chindia’s 2005 to 2011 rate of increase in net imports, their combined net imports in 2021 would be up to 21 mbpd, versus 8.3 mbpd in 2011. So, based on this extrapolation, Available Net Exports (GNE less Chindia’s Net Imports) in 2021 would respectively be at 32 mbpd, 18 mbpd and 7 mbpd, for the high, middle and low cases, versus 35 mbpd in 2011.
Here is a link to my favorite Kurt Cobb essay, “Upside Down Economics.”
http://www.resilience.org/stories/2007-07-29/upside-down-economics
Kurt has a graph with an inverted pyramid, showing the rest of the US economy resting on the 5% of the economy represented by the food & energy sectors. Of course, the obvious implication is that an inverted pyramid is inherently unstable. And I think that it is an excellent way to describe the current state of the entire economy.
I think that we are seeing enormous cognitive dissonance, as a result of the widespread effort to persuade US consumers that there is no problem with a virtually infinite rate of increase in our consumption of a finite fossil fuel resource base, even as consumers see, for this time of the year, record high gasoline prices at the pump.
As I outlined in my 5,000 word, 24 graph, essay on net oil exports, rising oil prices are a logical consequence of a post-2005 decline in Global Net Exports of oil, with the developing countries, led by China, consuming an increasing share of said exports. But it’s much simpler to point to rising US crude oil production versus prices at the pump and scream price conspiracy.
A quote from the proverbial man at the pump this morning on CNN: “Gasoline prices are out of control, and the government is not doing anything about it.”
Ah, if there were only windfall profits in the shale plays, how good it would be.
Well, somebody is making a killing if they are buying oil at WTI prices and selling gasoline at Brent prices. Consumers certainly aren’t benefiting from that spread.
In re Mr. Brown who quoted “Gasoline prices are out of control, and the government is not doing anything about it” I think we should add, “Thank goodness.” Remember how well it worked out when Nixon last “did something” about controlling gasoline prices?
Yes, Joseph, there are mid-continent refiners who have recently done pretty well out of the WTI-Brent arbitrage.
If you built Keystone XL, that would go a long way to eliminating that arbitrage opportunity. So are you for or against Keystone?
If you built Keystone XL, that would go a long way to eliminating that arbitrage opportunity. So are you for or against Keystone?
Why should consumers care about eliminating an arbitrage opportunity? It would just shift money from one billionaire to another. A windfall profits tax on refiners, on the other hand, would have genuine benefits to the general public.
Joseph –
Marathon Petroleum Corporation is the largest refiner in the midwest and is credited with being one of the primary beneficiaries of the WTI-Brent spread. For the year 2012, its net income on sales was 4.1%.
Now, tell me, where does that windfall profit tax threshold begin for you?
Now, tell me, where does that windfall profit tax threshold begin for you?
Hey, you’re the one who said there was an arbitrage opportunity. If there is, the public can take it just as easily as another billionaire.
Marathon 2012 net income: $3.4 bn
Apple Inc. 2012 net income: $41 bn, 40% gross margin.
Who are the billionaires around Marathon? Are there any? Apple, Google, Facebook–plenty of billionaires there. Isn’t that who you want to go after?
Bill
if pipeline capacity increases, but refiners(lower margins) remain a bottle neck, to producing this capacity, isn’t it for naught..
The arbitrage is effectively a deadweight loss. Eliminating it would transer the that to the consumers (in this case, an increase in supply to the interenational market). It might affect gas prices in the US a penny, but the cumulative effect is large and a penny means a lot more in south america, where fuel costs also make up more of expenses. More importantly, is sets us up to grow the market in the futured. Breaking open the bottle neck will to real economic growth in the future.
Aaron,
Regarding “Real economic growth in the future,” if you have a few moments, you might peruse my article at the following link:
http://aspousa.org/2013/02/commentary-the-export-capacity-index/
This is most decidedly a supply oriented analysis, and I think that Steve Kopits is by far and away the best at demand side analysis, but there are some scenarios in this paper that you might want to consider.
Some additional thoughts.
First, some definitions:
GNE = Combined net exports from top 33 net exporters in 2005, GNE fell from 46 mbpd in 2005 to 44 in 2011
ANE = Available Net Exports, GNE less Chindia’s Net Imports (CNI), ANE fell from 40 mbpd in 2005 to 35 in 2011
GNE/CNI = Ratio of GNE to CNI, analogous to ECI
ECI = Ratio of production to consumption
CNE = Cumulative Net Exports, after a given index year
Six Country Case History = Combined production, consumption, net export data for Indonesia, UK, Egypt, Vietnam, Argentina, Malaysia
Something that I had not fully thought out is why the projection of the Six Country six year ECI decline (1995 to 2001) produced a post-1995 CNE estimate that was too optimistic. Of course, the answer is that the rate of change in production from 1995 to 2001 was -1%/year, while it was -4%/year from 2001 to 2007.
So a GNE ECI projection that, in effect, assumes a perpetual +0.3%/year rate of change in production, combined with a +2.7%/year rate of change in consumption (the six year top 33 2005 to 2011 rates of change) would seem to be inherently too optimistic, which is a scary thought, considering what the Global and Available CNE estimates show.
Let’s look at a couple of scenarios.
Rounding off somewhat, GNE in 2011 were 44 mbpd, with production of 63.1 and consumption of 19.5. 2005 to 2011 rates of change were +0.3%year for production and +2.7%/year for consumption. If we extrapolate these out for 10 years, GNE would be down to 40 mbpd in 2021.
Let’s hold production flat and see what rate of change in consumption would produce GNE of 40 mbpd in 2021 and then let’s hold consumption flat and see what kind of rate of change in production would produce GNE of 40 mbpd in 2021.
Production Flat: requires a +1.7%/year rate of change in consumption, to produce a 10 year 4 mbpd drop in GNE
Consumption Flat: requires a -0.6%/year rate of change in production,
to produce a 10 year 4 mbpd drop in GNE
Of course, if we combine the two (not an unreasonable expectation), GNE would be down to 36 mbpd in 2021 versus 44 mbpd in 2011. So if the rate of change in production goes from +0.3%year to -0.6%/year, and if the consumption rate of change drops from +2.7%/year to +1.7%/year, the GNE decline rate would accelerate from -0.8%/year (2005 to 2011) to -2%/year (2011 to 2021).
And then we have the Chindia factor.
At their 2005 to 2011 rate of increase in net imports (8.1%year), their combined net imports would be up to 18.2 mbpd in 2021, versus 8.3 mbpd in 2011. Assuming GNE of 36 mbpd in 2021, and CNI of 18 mbpd in 2021, ANE would be down to 18 mbpd in 2021 (a GNE/CNI ratio of 2.0), versus 35 mbpd in 2011, with a GNE/CNI ratio of 5.3.
Incidentally, note that US net oil imports increased at a rate of 12%/year from 1949 to 1977, so the Chindia regions’ combined net imports are increasing at rate that is only about two-thirds of what the US showed from 1949 to 1977, a period of 28 years.
I any case, a GNE/CNI ratio of 2.0 in 2021 would be a 2011 to 2021 GNE/CNI decline rate of 9.7%/year, versus the 8.6%/year rate that we saw from 2005 to 2011, but as noted above, an increase in ECI type decline rates seems to be the more likely scenario, since the 8.6%/year decline rate assumes a perpetual increase in Top 33 production (not a scenario that it well supported by historical data). Note that a 8.6%/year rate of decline in the GNE/CNI ratio would put the ratio at 2.2 in 2021.
Bottom line is that I can’t help but think that the projections in my paper may represent something of a best case scenario–certainly no worse than a reasonable middle case projection–unless the shale guys are right and tens of thousands of wells quickly headed toward stripper well status will save us.
After running these various scenarios, I have concluded that absent a major supply surprise on the upside, i.e., unless the Citigroup guys are right, it seems inevitable to me that my GNE/CNI projection is probably more or less correct, at least out for the next 10 years or so.
My bet is that there is a 90% probability that the GNE/CNI ratio will be between 2.0 and 2.5 in 2021, versus 5.3 in 2011. The projection shows 2.2 in 2021:
http://i1095.photobucket.com/albums/i475/westexas/Slide6-2_zpsce056b88.jpg
In 2002, there were 11 barrels of GNE (Global Net Exports) for every barrel that Chindia net imported.
In 2005, there were 8.9 barrels of GNE for every barrel that Chindia net imported.
In 2011, there were 5.3 barrels of GNE for every barrel that Chindia net imported, a decline of 40% from the 2005 value.
In my opinion, there is a 90% probability that there will be between 2.0 and 2.5 barrels of GNE for every barrel that Chindia net imports in 2021.
I appreciate the fun you fellers are having talking about oil using your generalized analysis of “Good X,” but for the most part these comments are uninformed by realities facing operators.
For example, Steven Kopits informs us that “if you’d care to check, you’d see falling rig counts in the Eagle Ford and Bakken since June of last year. It’s not clear the economics are holding up.”
This observation fails to recognize that a considerable number of the rigs active a year or two ago used to explore in properties where leases required drilling by a certain date or the leases would lapse. Other operators are holding off on full-scale drilling while pipelines are being constructed (why accept $10-$20 per barrel less while Cushing is awash in oil that can’t be sent to market?). Next, a few operators such as EOG Resources are experimenting with different drilling/fracking practices that hold out the promise of increasing by 50% or more the amount of oil recovered from a given field, and other operators are waiting for the results before committing to new drilling initiatives. Finally, a considerable amount of data (and plans) are proprietary and therefore unavailable to the general public.
Those who hope to provide informed policy advice should begin by gathering information. Other than the map of proposed pipelines, very little on this page qualifies as informed opinion.