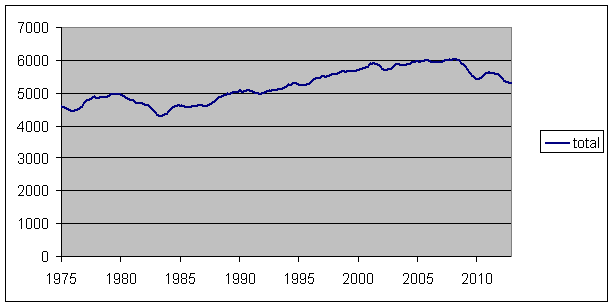
Emissions of carbon dioxide from fossil fuel consumption in the United States have fallen remarkably since 2008, with recent levels the lowest since 1995. Here I comment on some of the factors behind this.
 |
The policy response to growing atmospheric carbon dioxide concentrations that is favored by most economists is a tax on carbon emissions. If we could calculate in dollar terms the economic damage associated with an additional ton of carbon emissions, a tax in exactly that amount would lead society to reduce emissions by the optimal amount in the least costly manner. Estimates of that dollar cost differ greatly across academic studies, but a modal estimate might be $25 a ton, which would correspond to about 25 cents a gallon of gasoline. A relatively high estimate from the range of academic studies would be in the neighborhood of $100 per ton of CO2, or about $1.00 per gallon of gasoline.
But anyone who buys gasoline knows that 25 cents a gallon is only half the size of the run-ups we saw in the spring of each of the previous 3 years. Longer term, the $2/gallon increase since 2003 is about twice the size of the upper range of proposed carbon taxes. As far as gasoline is concerned, the U.S. did not adopt a carbon tax, but the bottom line for consumers was a change much bigger than most of the policy proposals envisioned.
 |
And it’s worth remembering why that happened– we didn’t have a choice. Global field production of crude oil (excluding
natural gas liquids,
which are not used as transportation fuel)
stagnated at about 74 million barrels/day between 2005 and 2008. It is up a couple of million barrels since then, but more than 100% of this increase has been consumed by China alone, forcing the U.S. and other countries to reduce our oil consumption.
 |
Looking at the breakdown of U.S. carbon emissions by sources, reduced consumption of petroleum made a prominent contribution to the total, as seen in the turquoise line on the graph below.
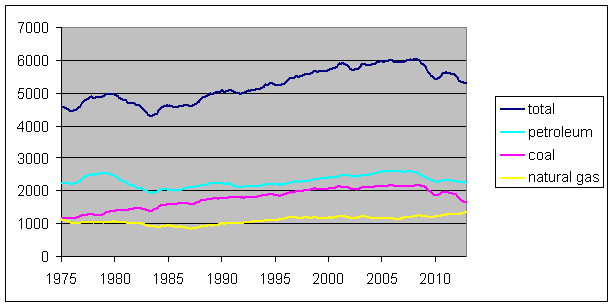 |
But rising oil prices cannot account for the concomitant decline in carbon dioxide emissions from coal. And here I want to argue that at least one reason for declining use of coal was that we did have a choice, and chose something better. The U.S. has been quite successful at increasing natural gas production in recent years.
 |
Rising gas production helped lower prices, which has helped make gas more competitive relative to coal.
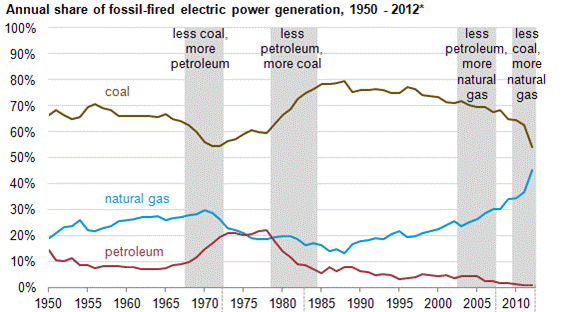 |
Generating electricity from natural gas emits about half the carbon dioxide as coal. Hence we enjoyed a serendipitous, unplanned decline in carbon emissions from a development that ended up benefiting consumers rather than forcing them into painful adjustments.
This is not to claim that the problem is solving itself. An even bigger factor in the reduction in fuel use was likely the economic recession itself. The Economic Report of the President estimated that 52% of the decline in U.S. CO2 emissions could be attributed to the economic recession, 40% to fuel switching, and 8% to improved energy efficiency. As the economy recovers, the EIA is expecting U.S. emissions to resume their historical climb if there are no new policy actions.
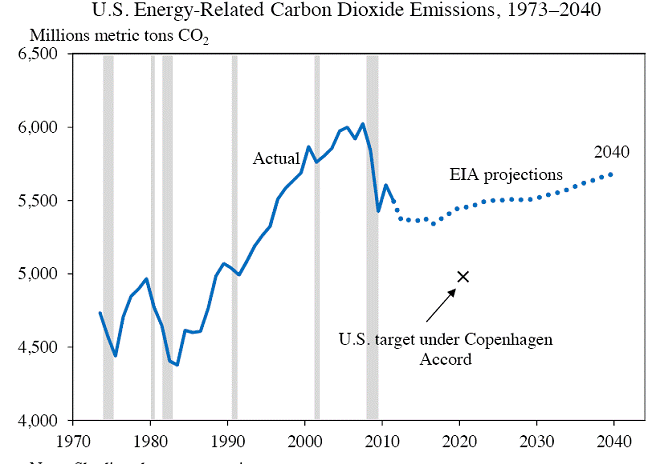 |
But there is one important lesson from the recent U.S. experience that’s worth emphasizing: these outcomes may ultimately end up being driven by events that are bigger than any policy initiatives we might contemplate.
UPDATE (3/25/2013 at 4:11 PDT): Reader benamery21 correctly notes a problem with a graph that appeared in the original version of this post, which has since been removed.
Thanks. Curious if there are numbers / graph for displacement by increased natural gas of oil use? How much of the displacement is coal and if oil being displaced how is that being used or not used. I know heating oil isn’t gasoline.
Re: Global Crude Oil Production
I estimate that global Crude + Condensate (C+C) production only increased from 73.8 mbpd in 2005 to about 75.5 mbpd in 2012 (EIA). This is about a 0.3%/year rate of increase.
However, it appears quite likely that we have seen virtually no post-2005 increase in global 45 API and lower gravity crude oil production. For the purposes of this discussion, crude oil is defined as 45 API gravity crude, or lower.
Condensate, like natural gas liquids, is a byproduct of natural gas production, and 45 API gravity is the most commonly used dividing line between crude oil and condensate.
Following are Crude + Condensate (C+C) production numbers for the 12 OPEC countries and crude oil production numbers for the same countries (compiled by Ron Patterson). The difference between the two would be estimated condensate production.
OPEC 12 (2005):
C+C: 31.8 mbpd
Crude: 30.7
Est. Condensate: 1.1
OPEC 12 (2012):
C+C: 32.9* mbpd
Crude: 31.1
Est. Condensate: 1.8
Implied increase in OPEC 12 condensate production: 0.7 mbpd
*Based on first 11 months of 2012
Let’s assume that the OPEC 12, accounting for 44% of Global C+C in 2012, are representative of global C+C production, which would imply that the global increase in condensate production from 2005 to 2012 was on the order of 1.6 mbpd (pretty much accounting for the 1.7 mbpd increase in global C+C production). Given the large increase in US condensate production from liquids rich gas plays, this is probably a conservative estimate.
In other words, it appears quite likely that virtually all of the post-2005 increase in global liquids production is coming from natural gas sources and biofuels.
Here is the key question: Why was there no material increase in global crude oil production for seven years, despite a doubling in global crude oil prices?
Re: US Dry Natural Gas (NG) Production
EIA monthly data show that US dry NG production has basically been flat, mostly between 1.9 and 2.0 TCF per month, since April, 2011:
http://www.eia.gov/dnav/ng/hist/n9070us2m.htm
In my opinion, given that the underlying decline rate from existing wells is so much higher now that at at the start of the shale gas boom, I think that there is a serious question as to whether the industry will be able to bring NG production back to prior levels, once a decline sets it. And spot NG prices are already up about 100% since the low about a year ago.
Re: The Post-2005 Decline in Global Net Exports of Oil And Increasing Demand From Developing Countries
And then there is “Net Export Math”
Some Definitions:
The following chart shows six years of normalized ECI data for the Six Country Case History, for the (2005) Top 33 Net Exporters (or GNE), for Saudi Arabia and for Available Net Exports (GNE/CNI ratio in this case). The Index Year (Year One on the chart) is defined as the 100% value. 1995 is the Index Year for the Six Countries, and 2005 is the Index Year for the other data sets.
http://i1095.photobucket.com/albums/i475/westexas/Slide12-1.jpg
The Six Countries data show a decline in the ECI ratio, from 100% in 1995 to 85% in 2001.
GNE (2005 Top 33 Exporters) data show a decline in the ECI ratio, from 100% in 2005 to 86% in 2011.
Saudi data show a decline in the ECI ratio, from 100% in 2005 to 70% in 2011.
ANE data show a decline in the GNE/CNI ratio from 100% in 2005 to 59% in 2011.
If we break down the 2002 to 2011, 9 year, decline in the GNE/CNI ratio (ratio of Global Net Exports to Chindia’s Net Imports) into three segments, it looks like this:
2002 to 2005: 11.0 to 8.9, rate of change of -7.1%/year
2005 to 2008: 8.9 to 7.0, rate of change of -8.0%/year
2008 to 2011: 7.0 to 5.3, rate of change of -9.3%/year
At the 2005 to 2011 rate of decline in the GNE/CNI ratio, in about 17 years, around 2030, the ratio would approach 1.0, and China & India alone would theoretically consume 100% of Global Net Exports of oil, leaving zero net exports available to about 155 net oil importing countries.
While we all agree this scenario–GNE equals CNI–can’t actually happen, the brutal fact remains that the rate of decline in the GNE/CNI ratio has accelerated in recent years.
In other words, we are headed (so far at least), at an accelerating rate of decline, toward an economically non-survivable point of impact.
It’s as if the passengers on a commercial airliner were calmly discussing dinner plans, oblivious to the fact that the pilot is steadily pushing the stick forward, putting the aircraft into an ever steepening dive.
The following chart shows estimated Post-Index Year CNE depletion, by year, relative to the Index Year. Again, 1995 is the Index Year for the Six Countries, and 2005 is the Index Year for the other data sets. All of the estimates are based on six years of declines in the ECI ratios and the six year decline in the GNE/CNI ratio.
http://i1095.photobucket.com/albums/i475/westexas/Slide1-29_zps8910d7df.jpg
At the end of 2001, estimated remaining post-1995 Six Country CNE were down to 39%. The actual value for remaining post-1995 Six Country CNE at the end of 2001 was 25%.
At the end of 2011, estimated remaining post-2005 Global CNE were down to 78%.
At the end of 2011, estimated remaining post-2005 Saudi CNE were down to 62%.
At the end of 2011, estimated remaining post-2005 Available CNE (estimated cumulative volume of post-2005 net exports available to importers other than China and India) were down to 52%.
Link to paper on ECI concept:
http://aspousa.org/2013/02/commentary-the-export-capacity-index/
I once thought that perhaps 0.1% of the people in the world understand–and this is key, ACCEPT the validity of–“Net Export Math.” I am beginning to think that the number is more like 0.01%, or even a much smaller number, a few thousand people maybe?. Even Peak Oilers who are aware of the topic tend to fall somewhere between disbelief and denial.
” I know heating oil isn’t gasoline.”
works in diesel engines. somewhere, maybe here, i read diesel accounted for 25% transportation fuel use. probably a faulty memory.
JDH, you said: “This is not to claim that the problem is solving itself.” What is the problem being solved? How does a carbon tax help solve it?
If the problem is related to Anthropogenic Global Warming (AGW, this issue appears to be on its last legs. Another few years without warming, and many scientists expect ~2 decades of stable to cooling temps, will take away the warming issue. Here’s a graph of the actual temps: http://wattsupwiththat.files.wordpress.com/2013/01/from-2004-75.png?w=867&h=594
Eduardo Porter at the NY Times Economix blog has Another Look at Natural Gas
he originally wrote that by allowing us to replace coal generation with gas, fracking would reduce greenhouse gas emissions…but readers have convinced him that methane leakage might be a greater threat to the climate…he cites several studies without coming to a conclusion…
according to the World Meteorological Organization’s annual report on 2011 greenhouse gases atmospheric methane hit a new high of about 1813 parts per billion (ppb) in 2011, which was 259% of the pre-industrial level, 40% of methane is emitted into the atmosphere by natural sources (e.g., wetlands, thawing permafrost) and about 60 % comes from activities like cattle breeding, fossil fuel exploitation, landfills and biomass burning…it’s about 20 times as potent a greenhouse gas as CO2 in the long term, but 70 times as potent over a 20 year horizon; therefore, in the short term, it’s net warming effect is one-third that of CO2…
nitrous oxide is 298 times more heat trapping than equal emissions of carbon dioxide over a 100 year period and also contributes to the destruction of the ozone layer, which screens harmful ultraviolet rays from the sun…
since CO2 levels were at 390.9 parts per million (ppm) in 2011, and atmospheric N2O was about 324.2 parts per billion in 2011; a back of the envelope calculation puts its contribution of N2O to global warming at about one quarter that of CO2…according to the EPA: “Agricultural soil management is the largest source of N2O emissions in the United States, accounting for about 68% of total U.S. N2O emissions in 2010″
according to a more recent study, estimates are atmospheric soot has a warming effect approximately two thirds that of carbon dioxide…
so all together they would contribute more to warming than the closely watched CO2…
American carbon emissions can go down if we are importing a greater amount of foods/goods from abroad.
JDH, you said: “This is not to claim that the problem is solving itself.” What is the problem being solved? How does a carbon tax help solve it?
If the problem is related to Anthropogenic Global Warming (AGW, this issue appears to be on its last legs. Another few years without warming, and many scientists expect ~2 decades of stable to cooling temps, will take away the warming issue. Here’s a graph of the actual temps: http://wattsupwiththat.files.wordpress.com/2013/01/from-2004-75.png?w=867&h=594
EIA monthly data show that US dry NG production has basically been flat, mostly between 1.9 and 2.0 TCF per month, since April, 2011:
http://www.eia.gov/dnav/ng/hist/n9070us2m.htm
In my opinion, given that the underlying decline rate from existing wells is so much higher now that at at the start of the shale gas boom, I think that there is a serious question as to whether the industry will be able to bring NG production back to prior levels, once a decline sets it. And spot NG prices are already up about 100% since the low about a year ago.
It is fascinating seeing the usual suspects fall over themselves trying to sell shale gas production as the next great saviour of American energy production even as they ignore the fact that the producers have wound up destroying capital as they have stepped on the pedal to drill as much as possible as quickly as possible. Now that the skeptics have been vindicated there is a great deal of talk about migration to shale liquids but that does not seem to be working very well either. What is lost on the cheerleaders is the fact that shale production is only profitable in small core areas of the better formations that are near existing delivery infrastructure and that the depletion rates are so high that increasing production means a significant amount of new drilling just to keep production levels even.
I cannot figure out why it is that so many economists have refused to look into the economics of production but are so eager to spread the hype even as it is clear that there is another bubble that has been crated by the loose money policy of the Fed. To me shale looks a lot like housing did in 2004. I wonder when the supposedly smart guys figure it out.
Well, Jeffrey sums it up pretty cleary, I think.
He might have added that we have increased upstream spend by more than double, and have virtually no increased crude production to show for it.
Also, coal to gas switching has ended. Expect higher nat gas prices going forward.
In the seven days since Cyprus broke, we have had posts on Wisconsin, college basketball, Iraq and CO2.
These are all noble topics, no doubt, but given that this is ostensibly a blog about macroeconomics, would not the meltdown of Cyprus, the Euro, and possibly the EU warrant an itsy, bitsy blog entry?
Could we not at least reach out to Prof. Gorton, who is after all the country’s leading expert on bank runs, for a short blog post on the topic?
Serious flaw in the post-error correction needed.
First, I agree with you–I should say that combined-cycle gas plants ARE displacing old, small coal plants in utility plant dispatch due to the below replacement cost price of natural gas (domestic gas glut) in the market today, and that this does explain a significant part of the reduced carbon emissions from coal, although wind and reduced electricity demand growth due to the economy are also part of the story. As a side point–Economically I think there’s a pretty strong case for keeping some of that gas in ground and raising prices by using government funds to create a gas reserve.
Now to the flaw in the post. The graph of operating cost comparison for fossil-steam and gas-turbine purports to show the fuel cost advantage of gas plants. You appear to be misinterpreting the EIA info in several different ways. You’ve shown the operating cost, of tenths of a cent per kwh, not the fuel cost, of multiple cents per kwh, which, further, does not show the story you think, for the two categories of plants you graph. That’s because the categories group the plants differently than you wish. Fossil steam plants includes large gas plants, what you need to graph are the fuel costs of coal plants versus combined cycle gas plants per kwh.
The theory of “catastrophic” man-made global warming is entirely dependent on positive climate feedbacks in response to changes in man-made carbon dioxide. The entire political agenda of CAGW proponents rests on climate models that predict a strong positive climate feedback. However, the empirical evidence to support the positive feedback theory is lacking, at best.
Robert G. Brown at Duke, “rgb at duke” has some interesting thoughts on issues related to the politics of carbon dioxide. No one frames the debate as eloquently as rgb at duke. Here is his home page.
http://www.phy.duke.edu/~rgb/index.php
Here is a recent quote –
In a century, we probably will be able to make quantitative climate predictions with some skill. In the current decade, we cannot. AGW is by no means disproven by the last 15 to 18 years of arguably flat temperatures, just as it was by no means proven by the temperature rise that occurred during the ENSO event or since the end of the LIA or the Dalton minimum. Temperature change cannot either prove or disprove the (C)AGW hypothesis, not without a full understanding of the climate system sufficient to predict what the temperature would be in the absence of extra CO_2, which we utterly lack. All the more so since we have to understand it in the presence or absence of CO_2, soot, various aerosols of anthropogenic or natural origin, with a variable sun, varying phases of decadal oscillations, and an unknown ocean sucking heat down or delivering heat up in a global circulation process with timescales ranging from years to centuries, with land use changes and pollutants in the waters that have visible global effects that we do not yet understand, all in a highly nonlinear chaotic system with numerous feedbacks and spontaneous self-organizing stabilizing macroscopic phenomena with global impact, on a planet that is inexorably pursing an orbital cycle that completely changes the underlying “equilibrium” over time in ways we do not fully understand and cannot predict or compute.
Somewhere in the world, as I type this, not one but hundreds of millions of people are cooking a sparse day’s meal on animal dung or a small charcoal fire. Their children are breathing in particulates and smoke and suffering from malnutrition and diseases. Their clothes must be hand washed, if they are washed at all. They have neither fresh, clean water nor anything but the great outdoors as a sewer system. Some two billion people will light their homes — if one can call a tin shanty or mud or grass hut a home — with an oil lamp or nothing at all tonight. The children of those two billion people will not go to school tomorrow, cannot read or do simple arithmetic, and will go to bed hungry (indeed, live always hungry, as they do not take in enough food to support their growth). They will grow up stunted in stature and damaged in their brains, all because they lack access to cheap electricity, running clean water and sewer facilities and clothes washing and refrigeration and schools and houses and adequate supplies of fertilizer-grown food that electricity enables. Many will die young, or live to become “criminals” as they do what they must to stay alive, or will become cannon fodder for anyone who promises to give them a better life if they will fight and die for them.
They, not the threat of a supposed apocalypse that might or might not happen in a century, are the moral imperative of the twenty-first century. There is no need for 1/3 of the world’s population to live in squalid misery — not any more. We have the technology, we have the wealth, to utterly eliminate global poverty within a few decades. What we lack is the will and the vision to do so.
And we will never succeed in doing so at the same time we make energy more expensive and discourage its use. The poverty in question is energy poverty. Fundamentally. With enough, cheap enough, energy, we can make the deserts bloom, create jobs in the heart of Africa or India or South America, bring medicine and electric lights and running water to the world. Cheap, clean energy solves all problems; it is the fundamental scarcity.
Here is a graphic of how well Hansen’s famous 1988 model prediction on the catastrophic outcomes we faced if the man-made carbon dioxide emissions continued unabated.
Scenario A – CO2 growth rate continues at exponential rate. (which it did)
Scenario B – A reduced linear growth of CO2 and other trace gases.
Scenario C – Net climate forcing from trace gases ceases to increase after year 2000.
What actually happened? The data say that the rate of increase in global temps was even lower than that predicted by Scenario C. Massive model failure. Real scientists do not cling to failed models, unless they have an agenda to push.
Here is the link to the Hansen graphic, I think I forgot to include it in my post. http://www.realclimate.org/images/hansen121.jpg
“Shale and Wall Street”: http://shalebubble.org/wp-content/uploads/2013/02/SWS-report-FINAL.pdf
@Jeffrey: “I once thought that perhaps 0.1% of the people in the world understand–and this is key, ACCEPT the validity of–“Net Export Math.” I am beginning to think that the number is more like 0.01%, or even a much smaller number, a few thousand people maybe?. Even Peak Oilers who are aware of the topic tend to fall somewhere between disbelief and denial.”
Anecdotally, from my own personal experience, I estimate that fewer than 1% actually understand Peak Oil, whereas no more than 10-20% of those who internalize the implications of Peak Oil understand GNE or CNE and the further implications for fossil fuel civilization, if you will.
Among the more difficult concepts to internalize is that we can’t have increasing profitable extraction of deep, tight, and tar oil at $110 Brent AND grow real GDP per capita, which in turn implies that private US domestic investment elsewhere in the economy cannot grow and neither can real wages, employment, and gov’t receipts.
Further, if we can’t grow real GDP per capita with $110 Brent, we will not have the surplus to build out “alternative energy” projects to anywhere near the scale required to replace fossil fuels AND be able to simultaneously maintain the existing fossil fuel infrastructure, including that which is required to supply the Anglo-American imperial war machine.
Most economists and energy industry types don’t get paid to “understand” publicly, clearly.
All that said, please don’t give up your efforts to inform, as someone has to do it, and your data and persuasive presentations are the definitive source of information for the all-important topic to date.
I studied atmospheric physics in college. The scare over Carbon dioxide is a scam based on the simplification of a complex system to high school physics. All else equal, increased C02 may shorten its infrared absorption length very slightly so that the first few kilometers of atmosphere may indeed absorb the same infrared heat at very slightly lower altitudes. This fact cannot be stretched to conclude anything at all about surface temperatures in a system where water vapor plays a dominant role by several orders of magnitude….in short the whole Catestrophic Global Warming scare is complete utter nonsense.
Note that my comments were not intended to disagree with Kopits about the current trajectory of price-driven coal to natural gas dispatch switching.
This article completely misses one key reason for the decline: the aging population in the US. Vehicle miles driven have declined – it is clear that part of the reason for this is that older drivers drive less.
Doug Short has a great analysis here. He notes that the R squared between miles driven and gas prices is actually quit low. He writes:
Italics identifying the quote by rgb at duke should extend down to, but not including, the paragraph that begins “Here is a graphic”. Sorry.
Good thing I read this blog! Now I know that global warming is a lie.
That’s great news for my son, who will be born in June.
Now I can rest easy and burn some rubber, emit some CFCs, and drive 30,000 miles a year!
Fladem –
Doug does some terrific charts, but he’s running the wrong correlation. When oil prices exceed the country’s carrying capacity, consumption will decline, regardless of the the volatility of oil prices above that level.
On the second chart from the link (Estimated Vehicle Miles Driven on All Roads,http://www.advisorperspectives.com/dshort/charts/indicators/miles-driven.html?miles-driven-CNP16OV-adjusted.gif), you can see the anticipated recovery of VMT stall in 2010 as oil prices break the $85 level (Brent). Then we see VMT start to fall again as the US hits the Arab Spring and prices settle in at the $110 Brent level.
So we’re trying to restart the economy even as VMT falls. Menzie says this doesn’t matter. I think it does. Put me to a wall, and I’ll say it’s all that matters. The financial shock is done and gone, and yet we can’t restart growth. Menzie suggests this might be because R&R models were not internalized quickly enough by the CBO or Fed. Or perhaps the problem is, as Krugman has suggested, that corporates just won’t repatriate their earnings. Or perhaps we haven’t borrowed enough (even as Jim frets that the US is on an unsustainable pace of borrowing and the big borrowers in Europe face the wall). For my part, I see advanced economies starved for oil and unable to offset oil consumption declines quickly enough with efficiency gains. (Oh, by the way, Italian oil consumption is down an astounding 25% from peak.)
But you can see a glimmer of hope in 2012 as US VMT holds steady even as US oil consumption falls at a 2.2% pace (http://www.advisorperspectives.com/dshort/charts/indicators/miles-driven.html?miles-driven-POPTHM-adjusted.gif). This tells us that the pace of efficiency adjustment is increasing. It’s not enough to put VMT back on trend, but it is enough to halt the decline, at least at the national level.
Do I think, as does BP, that efficiency can outrun consumption declines? I tend to doubt it. The major oil companies are reducing upstream spend even as their costs are increasing at more than 10% and the OECD economies are starved for oil. What do you think happens to oil production, already strained, under these circumstances? What odds do you give the Euro, indeed, the EU, under these circumstances?
In any event, let me give Doug the last word: “From 2001 to 2009, the average annual number of vehicle miles traveled [in the US] by young people (16 to 34-year-olds) decreased from 10,300 miles to 7,900 miles per capita—a drop of 23 percent.”
That’s the world we live in.
Here is a great video on the green issue, “Matt Ridley on How Fossil Fuels are Greening the Planet.”
Unbelievable.
A rescue programme agreed for Cyprus on Monday represents a new template for resolving euro zone banking problems and other countries may have to restructure their banking sectors, the head of the region’s finance ministers said.
“What we’ve done last night is what I call pushing back the risks,” Dutch Finance Minister Jeroen Dijsselbloem, who heads the Eurogroup of euro zone finance ministers, told Reuters and the Financial Times hours after the Cyprus deal was struck.
“If there is a risk in a bank, our first question should be ‘Okay, what are you in the bank going to do about that? What can you do to recapitalise yourself?’. If the bank can’t do it, then we’ll talk to the shareholders and the bondholders, we’ll ask them to contribute in recapitalising the bank, and if necessary the uninsured deposit holders,” he said.
After 12 hours of talks with the EU and IMF, Cyprus agreed to shut down its second largest bank, with insured deposits – those below 100,000 euros – moved to the Bank of Cyprus, the country’s largest lender. Uninsured deposits, those accounts with more than 100,000 euros, face losses of 4.2 billion euros.
Uninsured depositors in the Bank of Cyprus will have their accounts frozen while the bank is restructured and recapitalised. Any capital that is needed to strengthen the bank will be drawn from accounts above 100,000 euros.
The agreement is what is known as a “bail-in”, with shareholders and bondholders in banks forced to bear the costs of the restructuring first, followed by uninsured depositors. Under EU rules, deposits up to 100,000 euros are guaranteed.
http://www.zerohedge.com/news/2013-03-25/word-out-place-sends-europe-tumbling
Stevey Jones said: “Now I know that global warming is a lie.
That’s great news for my son, who will be born in June.
Now I can rest easy and burn some rubber, emit some CFCs, and drive 30,000 miles a year!”
Other than the sarcasm, can you support your fear of warming?
Better still can you explain this chart? http://bobtisdale.files.wordpress.com/2011/12/figure-19.png?w=640&h=427 What caused the ~60 year periodicity? Certainly not CO2 and absolutely not ACO2, the miracle molecule! What were the natural cause(s) for the warming? What percentage of the absolutely scary .8C of rise out of the Little Ice Age was attributed to natural versus human impacts?
Climate policy is a huge economic issue. I can’t believe a few of you want to hijack the thread and put your heads in the sand. If everyone behaved like a few of you above, then every topic would be hijacked by someone who placed greater weight on a different topic.
I enjoy the energy conversation as much as anyone, particularly Steven’s posts, but there are better ways to draw attention to the topics you prefer.
Not that it matters but my point about heating oil is that diesel prices have been flat since early 2011. No decrease. I know truck miles have increased but I don’t know the supply situation for diesel – or even what its pricing components are – and thus if there has been any freeing of diesel into the market. Just looking at the price of diesel, it looks like all the substitution is in coal.
I don’t know if the “you” is referring to me, tj, but I do apologize for hijacking the blog.
Having said that, the head of the Euro zone finance ministers just said that the policy they’re contemplating endorses confiscating the uninsured portion of bank deposits zone-wide, with these comments leading the the suspension of trading of at least four notable Italian companies on the Milan bourse today.
Wow!
It’s not that I don’t appreciate CO2 or disagree with Jim. I think he’s spot on, as he usually is. However, I think there are some bigger fish frying in the macro world and that should be the topic du jour.
CoRev,
I understand your skepticism of anthropogenic global warming. Truly, I do.
However, what is your end-game? What’s the goal? We keep strip-mining coal, drilling as much as possible, burning fuel, because it has no discernible effect on the climate?
I’d argue that there are serious reasons why we should be looking for renewable resources like wind/solar, because of the effect fossil fuels have on the environment.
I don’t want my son choking on diesel exhaust on our highways for the next 70 years, regardless of whether or not it warms the planet.
More hijacking:
Stocks Rebound as Dutch Finance Minister Backtracks on “Cyprus Is a Template for Europe” Comment
http://www.cnbc.com/id/100578158
Now all the Euro finance ministers have to do is fold their cards and push the stack to the middle of the table, and everything will be better.
At least for a while.
Really. On twitter.
https://twitter.com/intent/user?screen_name=J_Dijsselbloem&tw_i=316251696537948160&tw_p=tweetembed
Perhaps my comment wasn’t sufficiently succinct. The graph taken from table 8.4 of the EIA 2011 Electricity Annual does not show what it is represented by the post to show.
1)Operating costs do not include fuel costs in this context (marginal generation costs are separated in fuel, operating, and maintenance costs by utilities). The operating costs shown are in mills per kwh and are not a dominant factor in dispatch.
2)The two traces are not coal versus gas. “Fossil steam” includes much gas generation. “gas turbine” includes much small scale generation that is not gas.
Stevey Jones says: “However, what is your end-game? What’s the goal? We keep strip-mining coal, drilling as much as possible, burning fuel, because it has no discernible effect on the climate? … because of the effect fossil fuels have on the environment.”
I see once challenged you have changed your argument from Global Warming to the environment. I am an old man who has lived through most of the worst of the things for which you are concerned. Because I think, read, and learned about Anthropogenic Global Warming, I moved from fence sitting to skepticism and finally now full cynicism. The science is not there for AGW. It is based upon a set of assumptions that are shown to be exaggerated. Most scientists once they made that determination would revisit the theory, but today’s Climate Leaders are doubling down. Mother Nature is trumping the science.
Moreover, I have lived through much of the environmental movement ans actually seen and in a few instances helped implement change. But both movements, Climate and Environment, have been over taken by unthinking zealots.
Your goal of moving to Solar and Wind are not achievable without hurting populations. Look ar the early implementers in the past few decades and you will find country’s like the UK, France, and Germany searching for ways to go back to cheaper energy. France is unique in its nuclear implementation, but the UK and Germany are moving away from wind (UK) and Solar/wind (Germany.) The US still tries to achieve what they are deciding is too costly.
Our environment is the cleanest it has been since the Industrial Revolution. It always can be improved, but the cost of those improvements must be reasonable compared to the expected results. That has been lost and/or worse the costs pushed forward to your child.
As noted earlier, the displacement of coal combustion by natural gas combustion in the US is not necessarily a net benefit for Greenhouse Gas emissions. While less CO2 is produced, the leakage of methane from natural gas production is pretty uncertain. There is a lot of ongoing research into these emissions, but the well-to-well variability is quite high and the total emissions may be dominated by a small number of high emitting wells.
There’s a new NBER paper (#18897) that looks at “leakages” of a unilateral carbon tax. The conclusion is that a unilateral carbon tax on electricity generation can actually induce negative leakages because demand for electricity is inelastic (meaning households and firms cannot substitute away from the taxed commodity) and because there is an opportunity for substitution between inputs (i.e., towards labor & capital, wind turbines, natural gas, etc.). It’s worth a read if you have an NBER subscription.
tj The entire political agenda of CAGW proponents rests on climate models that predict a strong positive climate feedback.
This is false. It’s exactly the opposite. The global warming model assumes that CO2 has a very small and very weak effect over the short run. Feedback effects are also very small over the short run. The strong effect comes from global warming inertial effects that build up over time. I’ve read several of your posts and I don’t think you understand the physics of climate change. For example, right now solar cycles still have a relatively strong effect on climate. And that’s one reason temperature increases have temporarily slowed down, although they are still positive. But if it weren’t for greenhouse gases we should be seeing decreasing temperatures rather than only slightly increasing temperatures. But eventually global warming inertia will dominate other determinisitic forces holding down global temperatures. If I were a global warming denier I would want to figure out why today’s temperatures aren’t cooler than they were 150 years ago, because absent the greenhouse climate change model that’s where we should be.
And your appeal to the poor is intellectually dishonest. How does your consuming more carbon make the poor in 3rd world countries better off? If you really cared about the poor hovering over fires, then you would want to tax carbon in the developed world and distribute the revenues to the poor.
Jeremy water vapor plays a dominant role by several orders of magnitude
Did you flunk that class? Yes, water vapor plays a dominant role, but absent global warming water vapor is also a constant. The derivative of a constant is zero. If you want to emphasize the role of water vapor, then you have to concede that temperatures are warming, and that warming is what changes the amount of water vapor in the atmosphere. Oh wait…that’s exactly what the global warming model calls warming inertia!!!
CoRev Let me remind you that you are using a blog run by JDH to link to a couple of stupid graphs put together by idiots with high school diplomas. Have you ever read his book on time series analysis? Give it a try. If after reading his book you can’t explain why your graphs are nonsense, then read it again.
uber_snotling While less CO2 is produced, the leakage of methane from natural gas production is pretty uncertain.
An “uncertain” problem doesn’t have the same status as a certain problem. What you said is possible, but I think you might be overstating things a bit. Yes, methane is a more potent greenhouse gas. And yes, leaks might be a problem. But what I’ve read on the subject concludes that there isn’t a lot of evidence that (at least so far) methane leaks are an actual problem. So far energy companies have an incentive to minimize leaks. And it is something that could be regulated.
benamery21: Thanks for the correction. I didn’t find an easy alternative way to make the point, so just deleted the graph you mentioned.
Jeremy,
Water vapor cannot be a forcing agent because of its short atmospheric lifetime. However, long-lived greenhouse gases like CO2 can be considered forcing agents. I suggest you get your money back from your ‘atmospheric physics’ college.
http://www.yaleclimatemediaforum.org/2008/02/common-climate-misconceptions-the-water-vapor-feedback-2/
I knew 2slugs w/couldn’t stay out of the discussion. Now, you are an expert on the climate models? And, they are not reliant upon feedback to estimate radiative forcing for a doubling of CO2(not ACO2)? You insist the models rely on “global warming inertial effects that build up over time.” Really!?
You claim TJ misunderstands the physics: ” I’ve read several of your posts and I don’t think you understand the physics of climate change. For example, right now solar cycles still have a relatively strong effect on climate.” But in this comment you cite atmospheric water vapor as a constant, then confuse it with relative humidity. You claim: “solar cycles still have a relatively strong effect on climate.” The Sun, in all its cycles, is the source for nearly all thermal energy. Then you want us to compare the end of the LIA with today’s temperatures: “why today’s temperatures aren’t cooler than they were 150 years ago”. IIRC that was in just one paragraph.
The epitome of your error prone arrogance was your denial of the plots from the official data sets: “link to a couple of stupid graphs put together by idiots with high school diplomas.” Denying the data?
There have been billions of grant money invested in developing those data sets. Perhaps you can do a better job after ready Dr Hamilton’s book, but to deny the simple regression graph(s), or were you denying the official data sets?
RB, Jeremy never claimed water vapor was a forcing agent. That is your construct, not his. You also cite water vapor as a short lived GHG (my correction) to the long lived GHG, CO2. Each are GHGs and water vapor is a more efficient receptor of Infra Red than is CO2. Water vapor also makes up ~96% of the total GHGs. BTW any article from 2008 is getting a little old in this fast moving ?science?.
2slugs, I just can’t let your comment go. It was a classic of misconceptions, misdirection (global warming inertial effects, global warming inertia, warming inertia) and just error filled. Would you please explain how (global warming inertial effects, global warming inertia, warming inertia) works? It should be fascinating.
CoRev Climate models focus on the inertial forces that build up with a lag due to increasing greenhouse gases. That’s why Hansen argues in “Storms of My Grandchildren” that CO2 concentrations need to be around 350ppm…because once the inertial forces are far enough along that global warming would be unambiguously true even for you, then it will be too late. Those inertial forces will overcome those natural processes holding down global temperatures. Everything we know about climate science says that were it not for greenhouse emissions today’s climate would by very cold. But instead of cold temperatures we are observing warm and warming temps. If global warming isn’t a correct theory, then you have to explain why today’s temperatures are not historically cold.
Excel spreadsheets can be very dangerous if practiced by people without a license, and a lot of your graphs have that problem. For example, a few weeks ago you linked to some site that took a braindead time trend line and claimed there was no upward trend. All this based on some ocular analysis. If you had done the actual ARIMAX analysis with real time series software you would have seen that using the same data there was a statistically significant trend parameter.
As to your WordPress chart, the usual explanation for a level shift in the temperature data is because of spike in SO2 emissions that track closely with the mid-20th century flattening in temperatures. And temperatures started climbing again just as SO2 emissions fell in the 1970s thanks to a cap-and-trade program. And oh by the way, SO2 emissions jumped over the last decade thanks to China. SO2 emissions have a very strong cooling effect. Very few people would argue that increasing SO2 emissions is a rational long run response to global warming.
http://www.atmos-chem-phys.net/11/1101/2011/acp-11-1101-2011.pdf
CoRev,
As far as I can see it, Jeremy seems to be alluding to the widespread misconception that climate scientists want to hide that the bulk of the greenhouse effect is due to water vapor. That water vapor accounts for the majority of the greenhouse effect is true. But the important point is that it is a feedback rather than a forcing due to the short atmospheric lifetime.
http://www.realclimate.org/index.php?p=142
Your criticism of a 2008 article on some of these fundamentals is very weak. Some of the basic physical mechanisms were known more than a 100 years ago, even as the magnitude of the water vapor feedback is not known with great certainty currently. Check out the wikipedia entry on Svante Arrhenius
In his 1906 publication, Arrhenius adjusted the value downwards to 1.6 °C (including water vapor feedback: 2.1 °C).
2slugs, you’re getting even more strange. When will you explain “(global warming inertial effects, or in your latest — “inertial forces that build up with a lag due to increasing greenhouse gases.)” But the real clincher to your argument is the estimable quote and interpretation from the good Dr Hansen: “that CO2 concentrations need to be around 350ppm…because once the inertial forces are far enough along that global warming would be unambiguously true even for you,…” Even for me?
This is the current CO2 level at Muano Loa: “Week of March 17, 2013: 397.46 ppm
Weekly value from 1 year ago: 394.71 ppm
Weekly value from 10 years ago: 376.49 ppm” From here: http://www.esrl.noaa.gov/gmd/ccgg/trends/weekly.html Note the “Weekly value from 10 years ago: 376.49 ppm” Wow! Lessee we should be scared at 350PPM but we’ve actually been well past that value for decades. And the satellites tell us temps are: http://www.woodfortrees.org/graph/rss/from:1997/plot/rss/from:1997.9/trend/plot/uah/from:1997/plot/uah/from:1997.9/trend/plot/rss/from:1997.9/trend/detrend:-0.0735/offset:-0.080/plot/esrl-co2/from:1997.9/normalise/offset:0.68/plot/esrl-co2/from:1997.9/normalise/offset:0.68/trend
Deny or torture the data all you want, but the data sets show no warming. The importance of that is because NOAA said that a period of 15 years without warming would disprove the models, and Dr Santer said 17 years was the minimum to determine a climate signal. RSS has us at ~16.25 years and counting.
BTW, perhaps you missed TJs comment re: Hansen’s late 80s predictions and how they are diverging from reality.
RB, said: “…Jeremy seems to be alluding to the widespread misconception that climate scientists want to hide that the bulk of the greenhouse effect is due to water vapor.” Again you are changing the subject to even another strawman argument.
Your understanding of the changes in understanding regarding H2O in all it forms relative to climate science is very dated. Your latest reference is even older than the previous. Oh, and just as incomplete. Read some new references to how much has atmospheric H2O changed, its effect, its impact on increasing clouds, cloud’s impacts on albedo, atmospheric H2O impact on radiative forcing. Only the latest versions of the models are approaching a minor level of implementation on this most important and prevalent GHG.
90%+ of thermal energy goes into the oceans, and you choose to make concentrate on water vapor feedback versus this real long term thermal energy storage mechanism. Concentrating on the wrong GHG causes all kinds of wrong headedness.
You are also mixing theories with this: ” If global warming isn’t a correct theory,…” What you are actually citing is the Green House Effect theory.
No mention of ocean acidification? I thought the scientific community agreed that coral reef health is indicative of the global environment in general?
Who collects the proposed carbon tax and is it recycled back into developing alternatives or is it simply redistributed to special interest groups who had the foresight to front run the passing of the bill they wrote into law?
CoRev,
You are a wannabe sceptic who doesn’t understand enough to know why he wants to be a sceptic. Sometimes one has to understand that some people are a waste of one’s time. Goodbye.
An interesting analysis:
Default in Europe:
http://www.economic-undertow.com/2013/03/24/default-in-europe/
Thank you tj for some perspective.
I would accept a $1 a gallon “carbon tax” on gasoline if it meant I never had to hear about global warming again (kind of like how banning CFC’s has led us to never hear about the ozone hole anymore).
Earmark it for paying off debt, and I am an enthusiastic supporter.
” but absent global warming water vapor is also a constant.”
Please show data.
2slugs
This is false. It’s exactly the opposite. The global warming model assumes that CO2 has a very small and very weak effect over the short run. Feedback effects are also very small over the short run. The strong effect comes from global warming inertial effects that build up over time.
Excuse me, but you are mistaken. Without the positive feedback of water vapor, greenhouse gas theory predicts a 1C per century rise in temperature. About the same as the last century and completely manageable.
If I were a global warming denier I would want to figure out why today’s temperatures aren’t cooler than they were 150 years ago, because absent the greenhouse climate change model that’s where we should be.
Also completely wrong. Temperatures have trended higher since the Little Ice Age, during periods with man-made CO2 emissions and periods without.
If you really cared about the poor hovering over fires, then you would want to tax carbon in the developed world and distribute the revenues to the poor.
Wrong again. We are not taxing carbon. We are taxing Carbon Dioxide. Once again, your solution to every social ill is to raise taxes and redistribute wealth. You are effectively saying, tax the poor in the U.S. with hihgly regressive tax on Carbon Dioxide and then redistribute it to the poor elsewhere in the world. What a bunch of hooey!!!
Your climate policy is based on quite a number of false premises and conclusions.
Water is anything but constant. Clouds are variable. Oceans act as giant heat sinks. Polar ice cover varies dramatically on 100,000 year time frames.
It is simply amazing how many people cling to a simple belief that places Man at the center when there is overwhelming evidence that climate changes naturally. Amazing that we still don’t understand the natural variations but we “know” Man’s CO2 emissions are dangerous!
As CoRev alludes, the recent 16+ years of temperature data has proven that all the alarmist climate models are wrong.
Blind faith in man-made global warming is dwindling due to reality trumping models.
What if blind faith in fiat money were to dwindle due to reality trumping economist models?
RB, wannabe skeptic? Not on your life. I am a full blown cynic over CAGW/AGW. The planet is currently in a short term warming phase, but long term, this interglacial, we are slowly cooling: http://jonova.s3.amazonaws.com/graphs/lappi/gisp-last-10000-new.png
Can you guess what happens when we reach that tipping point. BTW, it is inevitable.
You also made this claim: “In his 1906 publication, Arrhenius adjusted the value downwards to 1.6 °C (including water vapor feedback: 2.1 °C).” assuming Arrhenius is correct, like the other climatologist willing to climb out on the prediction limb. But, Ole Mom Nature tells us: http://woodfortrees.org/plot/hadcrut3gl/from:1906/to:2013/trend/plot/hadcrut3gl/from:1906/to:2013 that Arrhenius was wrong by 2/3s, not 2.1C but ~.7C since 1906. And, you think I don’t understand why I am a cynic?
So as you can easily calculate the ?science? is based upon wildly exaggerated foundational information. It still has not recovered.
I am forever amazed how so few AGW believers do the simplest math. If we believe the climatologist that ALL the warming is due to ACO2, the the US portion of the current warming is ~40% of the .8C increase shown in the records. Or ~.32C. The remainder belongs to the rest of the world.
Actually it requires that we suspend logic to accept that ALL the warming belief. In reality CO2 makes up ~3% of the GHGs, and of that 3% ACO2 makes up another 3%. That means if the US did not exist, no US production of ACO2 since the start of temp records, we would be responsible for .000288C of that rise. Or today’s temps would only be lower by .000288C.
Do you at least understand the absurdity of the “problem” attempted to be solved by devastating our energy economies?
2slugbaits – I agree, the uncertainty in leakage rates of methane from extraction and during transport/use is poorly constrained, such that it may still be a net benefit from a GHG emissions perspective to switch over. And from the perspective of other air quality issues, switching away from coal is a no-brainer.
I just wanted to put out to JDH that CO2 isn’t the only GHG to consider when examining declines in emissions. About a quarter of all US methane emissions are from natural gas production, transportation, distribution, and use.
2slugs
What would you think of a model with 250 observations that produced dramatically different output after adding 10 observations that were similar to other 250?
Who in their right mind would you use that model as a policy guide?
For their analysis, Professor Berntsen and his colleagues entered all the factors contributing to human-induced climate forcings since 1750 into their model. In addition, they entered fluctuations in climate caused by natural factors such as volcanic eruptions and solar activity. They also entered measurements of temperatures taken in the air, on ground, and in the oceans.
When the researchers at CICERO and the Norwegian Computing Center applied their model and statistics to analyse temperature readings from the air and ocean for the period ending in 2000, they found that climate sensitivity to a doubling of atmospheric CO2 concentration will most likely be 3.7°C, which is somewhat higher than the IPCC prognosis.
But the researchers were surprised when they entered temperatures and other data from the decade 2000-2010 into the model; climate sensitivity was greatly reduced to a mere 1.9°C.
Under peer review.
http://www.forskningsradet.no/en/Newsarticle/Global_warming_less_extreme_than_feared/1253983344535/p1177315753918
In other words, each year that passes with no increase in temperature reduces the sensitivity of the climate to man-made forcings.
CoRev Take the data and load it to real time series software. Do the usual checks for unit roots and stationarity. Apply the old Box-Jenkins routines if you like. When you’re all done you will find that there is a stationary trend. And if you really want to do this stuff right, do actual tests for structural breaks instead of just cherry picking start/stop dates by eyeball.
As to the 350ppm….yes, Hansen’s point is that we have already passed the danger point and we should try to get back to 350ppm. Hansen is hardly alone in that.
I am forever amazed how so few AGW believers do the simplest math.
Simple math is indeed the problem. I am not a climate science expert…not by a long shot. But I’ve read enough climate science to know that simple math won’t cut it. Almost every serious book or article I’ve read on the science assumes the reader knows first order differential equations at a minimum just to explain the basic ideas. More complicated models are coupled systems. Let me make the point a little stronger. Let’s take one of the old standards in climate science, “Physics of Climate” published by the American Institute of Physics way back in 1992. It’s 520 pages long and you’re already into substantial FODEs by page 13. Or perhaps you’d like to look at a first year textbook, “Atmosphere, Ocean, and Climate Dynamics: An Introductory Text” (2008). Oh look…our first coupled system is on page 19 in the introductory explanation covering climate feedback. Sorry, it’s a little hard to take seriously someone like Anthony Watts with a high school diploma. He’s the Sean Hannity of the climate debate.
Do you at least understand the absurdity of the “problem” attempted to be solved by devastating our energy economies?
No one is talking about devastating our economy. First, this is an economics blog, so you need to remember that over the long run all inputs are perfectly elastic. The Dept of Commerce will tell you that for the manufacturing sector a 1% increase in energy costs will increase demand for labor by 0.2%. Labor is not necessarily a complement of energy; in many sectors it’s a substitute. Second, a carbon tax could (and should) be refundable, which would cushion the economic impact and would redistribute wealth downward. Finally, you seem to think that adjusting to climate change is optional…as though it is just some luxury that limosine liberals want to peddle. What you ignore are the potentially horrendous economic costs that global warming will pass on to people born three or four generations down the line. And I think that’s really at the heart of the problem. The other day you described yourself as an “old man.” Well, old people just shouldn’t be allowed to have a voice in the climate debate because they don’t have a stake in the downside risk. In economic terms, your personal discount rate is many times higher than the optimal social discount rate.
tj A couple months ago you claimed that global warming had to be wrong because there was no evidence that the oceans were rising. And as evidence you pointed to some crazy denier who showed that oceans are rising in a linear fashion. So from that you concluded that there was no increase in the rate of glacier melt. As best I can tell you flunked geometry. Hint: the earth is a sphere. if the radius increases by 1%, then the volume in the sphere increases by more than 1% (Vol = 4/3*pi*r^3). Do the math.
2slugs? Math is simple when computing possible impacts. Do you dispute the numbers? Do your own calculations. How much of the past century’s warming was caused by the US? Show us your work. 😉
BTW, you just did the typical strawman argument.
Your answers have been hilarious. This: “As to the 350ppm….yes, Hansen’s point is that we have already passed the danger point and we should try to get back to 350ppm. Hansen is hardly alone in that.” Really? Who else other than you is proposing we go backward? What’s their plan?
By definition, AGW, anthropogenic global warming is caused by anthropps. Strangely, Americans do not call them anthropps. We call them “people”. The more people you got, the more warming you get. Get it? Too much warming means too many people, Demasiado. Look!
In 1972 we hit GPPPPP, global peak per person petroleum production at 2 barrels LSC, light sweet crude per person per year. Last year we had double the number of people as 1972 but only 7 billion barrels of WTI, West Texan Intermediate, 7 billion barrels for 7 billion people is 1 per person or half what we produced per person in 1972. Is 7 billion barrels for 7 billion sons better than 7 brides for 7 sons? Who knows? One thing for sure :
Too many brides are getting knocked up by some son of a barrel monger. Our overpopulation gets worse by the minute as some idiot at Duke University wants to take cheap energy to Africa just in time to explode yet another population bomb.
Think simple things first, My People! Think that the wealthy get compounded interest while the poor get knocked up.
You are my people, Populace!
Think,
My People
!
Sea level: http://sealevel.colorado.edu/files/2011_rel4/sl_ns_global.png
2slugs
A couple months ago you claimed that global warming had to be wrong because there was no evidence that the oceans were rising
Wrong again. I have never made that claim. My claim is that the sensitivity of the climate to man-made emissions of Carbon Dioxide is over-stated. The oceans are rising at ~ 3 millimeters per year +/- 0.6 mm.
Hint: the earth is a sphere.
The oceans are not. If you are using spherical geometry to derive sea level increase then it’s no wonder you reach the wrong conclusions! 😉
And as evidence you pointed to some crazy denier who showed that oceans are rising in a linear fashion.
You always resort to name calling when you can’t refute a point. Here is the crazy denier. “Aviso have been distributing altimetric data worldwide since 1992. Since that date, satellite altimetry has evolved in parallel with the user community and oceanography. ”
http://www.aviso.oceanobs.com/en/news/ocean-indicators/mean-sea-level/
Check out the 2 charts at the link above. In the top chart, notice how sea level is rising at 3 mm/year. In the bottom chart, notice how sea level is rising in some parts of the world and falling in others.
Note also a curious feature of the lower chart, most prominent between the tips of Africa and South America. The multitude of red blobs, many larger than the state of Florida, imply that sea sea level change can be extremely localized. Almost as if the measurements were capturing waves, or underwater features rather than changes in sea level that could me attributed to man-made emissions of CO2.
A few thoughts:
Total net megawatthours produced/consumed peaked in 2007, as did MWH from coal. 2012 total MWH’s are down 2.5% (~102 million MWH) from that peak, lower than any year since except 2009. 2012 MWH’s from coal are down 25% (~500 million MWH) from 2007’s peak. Declining energy demand due to the economy explains only about 20% of the reduction in electricity production from coal.
Wind energy production increased by ~105 million MWH’s from 2007 to 2012, roughly quadrupling. This can explain another 20% of the decline in coal.
MWH production from natural gas increased ~334 million MWH’s (~37%) from 2007 to 2012. This can explain about 2/3rds of the decline in coal.
There are other minor factors, but this explains slightly more than all of the decline in coal.
The dominant factor in substitution of gas for coal was, as JDH posited, price. However, the story is not quite as simple as “gas is now cheaper than coal.” On a per million BTU basis, coal purchased by electricity producers cost an average of $2.40 in 2012, gas purchased by electricity producers cost an average of $3.40.
Why then have gas plants been running more, and coal plants less (given most of the decline is in dispatch rate, not retirements, although retirements contribute)?
Simple.
The most efficient combined-cycle gas plants have lower marginal cost per MWH than the least efficient steam turbine coal plants, even though the average coal plant still produces cheaper power than the average gas plant.
Gas turbines and gas-fired steam turbines had average heat rates (BTU per kwh) which were worse than average coal fired steam plants, and are not displacing coal, however, combined cycle gas plants have heat rates which are much better than any of these categories.
Even combined cycle plants, with their terrific efficiency, however, are not cheaper than the coal fleet on average at the prices obtaining in 2012. Fuel price per kwh of the average combined cycle plant was still slightly (6%) higher than the average coal plant. However, there are many small, old coal plants with worse than average heat rates. These are typically the plants being displaced.
Will this price driven trend continue???
My feeling is that the reduced consumption will place downward pressure on coal prices and coal transportation rates, and that natural gas prices will rise as shale gas prices begin to be passed thru. Note that delivered coal prices increased 92% over the decade from 2002 to 2012. Most coal is delivered under long term contract, and the railroads get more of the money than the producers on many hauls, so prices are sticky and it will take some time for the demand signal to operate on prices. Gas price increases may relieve some of this pressure, but half of the reduction in coal consumption was from 2011 to 2012, so there hasn’t been much time for the pendulum to swing back yet on domestic steam coal delivered prices.
”
average coal plant still produces cheaper power than the average gas plant.
”
~~benamery21~
Is there an often overlooked element to your comparison? Do you see what is happening?
Coal is good for heating steam boilers busy at driving steam turbines. Such technology lends itself to co-generators that can heat large factories or/& provide heat for drying process etc., but co-generation coal stokers do not have the same economy of scale for small installations as in home heating, combination home electricity generation.
By contrast, natural gas is already efficiently piped into many homes today. Internal combustion engine running on natural gas could be the residential co-generation of choice for tomorrow. Such a technology could circumvent the need for an electric power grid for residential developments. The gas powers the engine. The engine coolant heats the home. The engine exhaust heats the water for swimming pool and showers. The engine turns the crank for the cloths drier, the well pump, the alternator, the generator, plus the freon compressors of the freezer, the chiller, and the A/C.
Think of what high percentage of the energy is wasted by the electric grid. Natural gas pipes to your home don’t waste near that much energy as they move the source of energy closer to your residence.
The beauty of petroleum both gas and liquid is that it does not require the process of pulverizing into a combustible form. True! You can pipe coal in by water suspension, but fluid fuel mixes with air much more readily than solid fuels.
Personally, I like strip mining of coal, but fluid fuel has its own special charm.
For Dr Hamilton, 2slugs, Enzie RB (well you know who you are) absolute believers in the GHE theory, Dr James Hansen has another, new paper published.
One analysis says this: “A paper published today by James Hansen has some startling admissions, including
the effect [forcing] of man-made greenhouse gas emissions has fallen below IPCC projections, despite an increase in man-made CO2 emissions exceeding IPCC projections
the growth rate of the greenhouse gas forcing has “remained below the peak values reached in the 1970s and early 1980s, has been relatively stable for about 20 years, and is falling below IPCC (2001) scenarios (figure 5).”
the airborne fraction of CO2 [the ratio of observed atmospheric CO2 increase to fossil fuel CO2 emissions] has decreased over the past 50 years [figure 3], especially after the year 2000
Hansen believes the explanation for this conundrum is CO2 fertilization of the biosphere from “the surge of fossil fuel use, mainly coal.”
“the surge of fossil fuel emissions, especially from coal burning, along with the increasing atmospheric CO2 level is ‘fertilizing’ the biosphere, and thus limiting the growth of atmospheric CO2.”
“the rate of global warming seems to be less this decade than it has been during the prior quarter century””
My translation for the highlighted section is: I was was wrong about the early estimates, and Ole Mom Nature has produced results below what I said would happen!
Furthermore, his paper admits the obvious. CO2 is a life giving gas and fertilizer that has expanded the biosphere.
The paper can be found here: http://iopscience.iop.org/1748-9326/8/1/011006
His latest papers have included claw back conclusions, and even though replete with caveats for the old, full GHE theory, he has been forced to recognize reality.
For Dr Hamilton, 2slugs, Enzie RB (well you know who you are) absolute believers in the GHE theory, taxing, regulating and demonizing the beneficial gas, CO2, is a losing scientific and political argument. In Nature few things are absolute, but that is the position you have taken.
After publishing articles on the “Vanishing North” and devoting a multi-page section to global warming last summer, The Economist is changing its tune.
http://www.economist.com/news/science-and-technology/21574461-climate-may-be-heating-up-less-response-greenhouse-gas-emissions
Over the past decade the long-term rise in surface seawater temperatures seems to have stalled (see chart 2)
…
All this makes the recent period of flat temperatures even more puzzling. If aerosols are not cooling the Earth as much as was thought, then global warming ought to be gathering pace. But it is not. Something must be reining it back. One candidate is lower climate sensitivity.
…
It is possible, therefore, that both the rise in temperatures in the 1990s and the flattening in the 2000s have been caused in part by natural variability.
…
temperatures since 2005 are already at the low end of the range of projections derived from 20 climate models (see chart 1). If they remain flat, they will fall outside the models’ range within a few years.
…
Chances of catastrophe become “vanishingly small”.
Nic Lewis, an independent climate scientist, got an even lower range in a study accepted for publication: 1.0-3.0°C, with a mean of 1.6°C. His calculations reanalysed work cited by the IPCC and took account of more recent temperature data. In all these calculations, the chances of climate sensitivity above 4.5°C become vanishingly small.
…
For me, the most consequential portion of the article is the comparison of Global Circulation Models (GCM) to Energy Balance Models (EBM). EBMS suggest a much lower sensitivity to CO2 than GCM’s. The reliability of GCM’s relies to a much larger extent on our complete understanding of how the climate works. GCM’s are favored by Hansen and the other agenda driven climate “scientists”. They allow much more freedom to “massage” the inputs.
Soon enough, many of you will begin to realize you were duped by the agenda driven crowd. Politicians funded the “scientists” who pushed the catastrophic line. Politicians used the catastropic line to justify new redistibutive taxes and punish the fossil fuel industry, thus gaining favor with certain constituencies. The media rushes to promote results consistent with CAGW, but rarely mentions the non-catastrophic results. Congratulations to the Economist for having the cahones to overcome the media bias and political pressure to publish an unbiased account of the issue.
I am glad to see The Economist speak out. This must have been extremely brave of their editor. This could be a career limiting move by the editor.
The Economist is controlled by the Rothschilds. The wife of Evelyn de Rothschild sits on the board of The Economist. The son of Evelyn de Rothschild has written scary books about the coming man-made global warming catastrophe.
Goldman Sachs and Deutche Bank and many others were hoping that Carbon credits trading would be their next boondoggle. The banksters along with their ultra rich investors have a track record of making lots of money on pump-and-dump schemes (legalized ponzi or pyramid schemes). Recent examples are dotcom tech bubble, sub-prime bubble, commodities bubble, and by all accounts global warming carbon credit trading was supposed to be next. Basically those who get in early on these trends make a fortune and when the bubble bursts it is mostly the average joe and taxpayers that are shafted.
We are talking hundreds of billions riding on these bankster driven trends.
Remember that money is made when things move – like a move to privatization or a move to nationalization – on either direction the politically connected early adopters make huge money.
The Economist’s editor is a very brave man. So far, the only people I see brave enough to speak the truth are a few bloggers who have little to lose because they are not part of the value network that benefits from creating new spurious investment trends.
If you are reading this and have just opened your eyes to what is going on with our easily manipulated western media and democracy then congratulations… Your eyes are wide open and you are no longer one of the Sheeple connected to Goldman Sachs Matrix.
“The Economist says the world has added roughly 100 billion tonnes of carbon to the atmosphere between 2000 and 2010, about one-quarter of all the carbon dioxide put there by humans since 1750.”
The rate of increase in temperatures did not change during a 10 year period when 25% of all man-made CO2 was added to the atmosphere.
At what point do you question the models? At what point do you question the policy?
This is beyond crazy!!! What other theory in the history of mankind has failed to this degree, yet society still clings to it?
The “true believers” of Global Warming want us to believe that warming is bad for us by hyping the effects of warm spells. Do we ever read about this? It’s the cold, not global warming, that we should be worried about http://www.telegraph.co.uk/health/elderhealth/9959856/Its-the-cold-not-global-warming-that-we-should-be-worried-about.html
Europe has been early to adopt many of the extreme social and political actions recommended by the Alarmist crowd to lessen the effects of Global Warming. What we see in western Europe is out own future if we continue to follow their lead.
All of this to fight a warming that is not even happening at this time. Worse all of this to fight the CO2 driven climate theory and models-based (not reality based) predictions, where Ole Mom Nature is making fools of the CO2 theory. Carbon tax? Why again? Other than to tax and spend more.
Our current implementation of Keynes’s theory seems as poor as the CO2-based Green House Theory.
An observation: Although natural gas generation is clearly the largest factor, though not the only significant one, in reduced American coal use, this does not imply the same about carbon emissions. Arguably, both wind and reduced electricity consumption due to the economy have had a bigger effect on net GHG emissions, particularly when methane is included.
If wind and negawatts are given 2X the carbon reduction weight of switching from coal to combine-cycle gas, 80 percent of the CO2 reduction from coal is attributable to those factors…
This doesn’t seem to square with the EIA graph:
“The Economic Report of the President estimated that 52% of the decline in U.S. CO2 emissions could be attributed to the economic recession”
If this is correct, the US CO2 emissions should go up about halfway to the 2007 peak as soon as the recession ends. If that is the case, the EIA appears to predict that the recession will not be over by 2040. More charitably, it predicts that the recession will recede so slowly that fuel switching and energy efficiency gains will more or less keep up with economic gains for the foreseeable future…
http://www.wri.org/publication/clearing-the-air
Another GHG side effect of the natural gas production boom: fugitive methane emissions.
”
CO2 is a life giving gas and fertilizer
”
Not only, but also! We often overlook the generation of NOx and ammonia by high compression carbon burning diesels and other internal combustion engines. This *fixing of nitrogen* into inorganic molecules used by organic organisms for amino acid generation and the fabrication of purines and pyrimidines used in DNA-double-helicoid spurs vegetation proliferation World-wide. Tell me something!
Why 1932 gals/&/guys got dust bowl from depression but we didn’t get dust bowl? Healthier plants?
Why I have to cut my grass more now?
Think about it
!