In my previous post
I reviewed the recent experience of a number of countries whose sovereign debt levels became sufficiently high that creditors began to have doubts about the government’s ability to stabilize debt relative to GDP. When this happens, the government starts to face a higher interest rate, which makes debt stabilization all the more difficult. Is there any danger of the same adverse feedback loop starting to matter for the United States?
Let me begin with some basic definitions. The deficit is the difference between what the government spends and what it collects in revenues during a given year. It is what economists describe as a flow variable, measured in dollars per year. By contrast, the debt refers to a stock variable: the total sum that the government owes at any point in time. The relation between these two measures is that the deficit during a given year is equal to the change in the debt between this year and next. If the government spends more than it takes in as revenue (that is, if it runs a deficit), it’s going to have to roll over its existing debt as well as issue new debt to cover the current year’s shortfall (that is, it’s going to have to increase the debt). Thus even though the deficit may be falling from one year to the next, as long as the deficit is positive, the level of debt will be growing from one year to the next.
The Congressional Budget Office reports that gross federal debt as of the end of 2012 stood at just over $16 trillion, or 102% of GDP. However, much of this is owed to other government accounts such as the Social Security Trust Fund. Many economists prefer to subtract out the sums that the government “owes” to itself to arrive at a net debt figure, sometimes referred to as debt held by the public. As of the end of 2012, federal debt held by the public was $11.3 T, or 72% of GDP.
 |
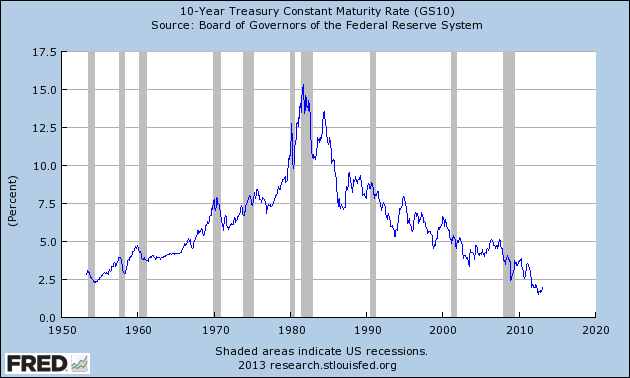
The tipping-point dynamics come from the burden of meeting the interest payments on the debt. For any given interest rate, the higher the stock of debt that the government owes, the higher the expenditure flow each year will be required just to make interest payments on the government debt. For 2012, federal net interest payments came to $223 B. That corresponds to 1.4% of GDP, or about one-third the size of the 2012 defense budget. The reason that the interest burden is so low despite a historically high debt load is because interest rates on government debt are lower at the moment than they have been any time over the last half century.
 |
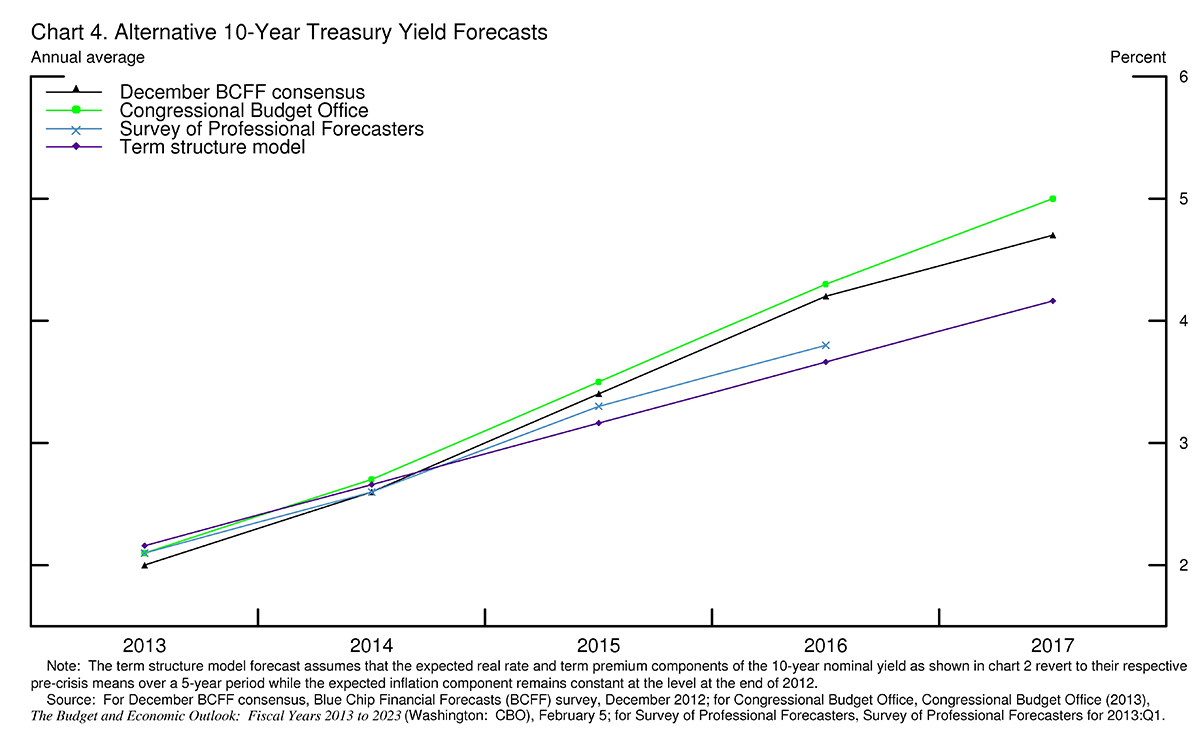
But is it reasonable to anticipate that long rates will continue to remain at these unusually low levels? The figure below shows forecasts of the interest rate on 10-year U.S. Treasury bonds over the next 4 years arrived at using several different methods. The purple line is a statistical inference based on the current values of interest rates on different Treasury securities and a structural interest-rate model of what the current levels of these rates imply for a rational forecast of their future values. The blue and black lines are consensus estimates from the Survey of Professional Forecasters and the Blue Chip survey, while the green is the CBO’s projections. All four estimates suggest rates could rise considerably within the next few years.
 |
Recall that the debt itself will be growing as a result of continuing deficits. A higher interest rate and growing level of debt would mean that the fraction of federal spending that is taken up by interest expenses will grow considerably over the next decade. The CBO anticipates that, under current law (that is, assuming for example that the recent “sequester” and planned future spending reductions remain in effect), federal net interest expense will grow to 3.3% of GDP by 2023. At that point (and again assuming that the spending reductions specificed under current law continue for the decade), interest expense would be higher than either the total defense budget or the total discretionary component of the nondefense budget.
 |
Figure 4 above assumes that defense and other discretionary spending fall as a percent of GDP over the next decade. If this does not happen, then without changes in the other components of the budget or the projected path of GDP, the run-up in debt would be larger than assumed in Figure 1 above and interest expense would be greater than 3.3% of GDP.
The CBO has not yet updated their projection of what current law would imply for debt and interest expense beyond 2023. In a recent paper with David Greenlaw at Morgan Stanley, Peter Hooper at Deutsche Bank, and Frederic Mishkin at Columbia, we made a guess at the sort of numbers CBO might come up with for those longer-term projections when they update their long term assessment from last year. We calculate that net interest expense under those assumptions is likely to continue to grow as a percent of GDP.
 |
In arriving at the above projections, we made the same kind of assumption about interest rates as CBO in both their “Extended Baseline Scenario” and “Extended Alternative Scenario” in Figure 1 of the long-term outlook that CBO issued in 2012, namely, that the nominal interest rate eventually rises to 5.2% and then stays there indefinitely.
 |
However, under this same scenario, debt continues to grow as a percentage of GDP.
 |
The question we raise is whether it would be reasonable to make such an assumption under the scenario just described. The supply of Treasury debt is projected to continue to grow as a percent of GDP. Why would the demand for Treasury debt grow faster than GDP if there is no increase in yield?
CBO’s 2012 long-term assessment also considered the possibility that increasing debt-to-GDP levels would result in rising yields. Such a possibility is presented in their Figure 2-1 where it is described as an “extended alternative fiscal scenario with effects”. These effects arise from a gradual crowding-out of private investment that is part of their long-term growth model. However, in my paper with Greenlaw, Hooper, and Mishkin we call attention to another channel that could be far more significant. As would-be buyers of Treasury debt observe that the fiscal path is unsustainable, they might rationally perceive that the only way to return to a sustainable path would be through unanticipated inflation or outright default. But such perceptions would result in the government needing to offer a higher interest rate as compensation for this risk. Below is our simulation of how the debt load would evolve under the same assumptions just used, except allowing the interest rate to rise with the debt levels as predicted on the basis of recent experience in other advanced economies.
 |
The blue path above is conservative in several other respects, assuming for example that unemployment eventually returns to 5-1/4% and that Congress keeps the sequester provisions in place. Using instead a 6% unemployment rate and no sequester, our simulated path looks as follows.
 |
It is important to recognize that we are not proposing that creditors will all of a sudden refuse to hold dollar-denominated assets. The question instead is whether demand for U.S. Treasury debt will continue to increase every year faster than the U.S. economy can grow.
It is also important to emphasize that we are not claiming that the blue path above is an accurate prediction of what is going to happen, and we certainly hope that it does not. As we wrote in the
Wall Street Journal
on Friday,
The grave scenarios we outline here do not have to happen. Since the debt-to-GDP ratio is likely to stabilize over the next few years, there is time to avoid the dire potential problems we have highlighted. But with the gross-debt-to-GDP ratio already well above the 80% threshold– and likely to resume a steady climb by the end of this decade– the clock is ticking.
With sufficient political will, the U.S. government can avoid fiscal dominance and achieve long-run budget sustainability by gradually reining in spending on entitlement programs such as Medicare, Medicaid and Social Security, while increasing tax revenue by broadening the base.
A number of plans, including those put forth by members of the Simpson-Bowles Commission and the Domenici-Rivlin Task Force, have already shown the way. The political will to put the fiscal house in order has not yet been summoned—but should be the highest priority of this country’s elected officials.
I read the paper. I expected more from this blog post. Perhaps you could add some more qualifying detail other than a link to your own blog post that discusses the “other advanced economies” as though that link means they’re the same. When they rather obviously aren’t the same, it seems more imperative, not less that you present a reason why you treat the US the same as them. A link to yourself is not discussion.
My other comment is that you glide over what you guys did in the paper. You say in this post “might rationally believe” and then talk about the need to “offer a higher interest rate”. But you know what you did in the paper and you should at least try to say what that is. You present the material as though adding a non-linear response that fits cases which don’t seem to have much in common is a perfectly rational, normal and non-political thing to do.
To be blunt, I liked the paper as a modeling exercise. I thought it has value as an exploration of second order effects. But when you present it in blog posts as a material possibility then you need to offer a heck of a lot more than a link to yourself and a glib statement of “might rationally believe”.
Jonathan: Sorry, but I’m not following you. It sounds to me like you read neither this post, nor my previous post, nor pages 5-12 of the paper. Perhaps you did read Krugman’s or O’Brien’s misplaced concerns about the paper, and let those blind you from thinking clearly about anything I said here or anywhere else. OK, I will respond to Krugman and O’Brien in detail in my next post. In the mean time, try thinking for yourself.
Interest on the debt as a percentage of GDP was 250% of its size today during the 80s and early 90s. Where were all the people talking about a tipping point during the St. Reagan years?
Note also that about 10% of the debt is held by the Federal Reserve and interest payments refunded to the Treasury.
Where were all the people talking about a tipping point during the St. Reagan years?
During the Reagan years, when were the promises to the baby boomers going to come due? About 35+ years in the future. During our years.
“[T]he conclusion is inescapable. Without the Bush tax cuts, it would have been difficult to cope with the fiscal implications of an aging population. With those tax cuts, the task is simply impossible. The accident, the fiscal train wreck, is already under way.”
— Paul Krugman
Obama and the Democrats recently made 98% of the “Bush tax cuts” permanent, after they expired.
Does the mere fact that they are now the “Obama tax cuts” convert the “simply impossible” to so easily not-to-worry done?
The tipping point will occur when the banking giants decide it is beneficial to them. They will simply contract credit, trade asset markets downwards and manipulate bond markets in order to cause another contraction.
In order to fix the system we need to take away some of the excessive power the banking system has and give it to the people.
internationalmonetary.wordpress.com
That’s correct, the Bush-tax-cuts can be called Obama-tax-cuts, now.
Well James, I enjoyed your post !
Just want to tell you James : there will be another housing boom and bust and there will be another (great-?)recession and I would rather predict it will be between 2020 and 25, at the latest. so you know, the “blue line” (fig.9) will look quite different, that’s for sure when speculating about the future.
But I appreciate your work, think you are a person showing good will and you try to find an unbiased view (and a you are a good teacher, too).
So it’s better you do not care too much about Krugman, do not waste your time.
China has the key, James.
The tipping point will occur when the banking giants decide it is beneficial to them. They will simply contract credit, trade asset markets downwards and manipulate bond markets in order to cause another contraction.
In order to fix the system we need to take away some of the excessive power the banking system has and give it to the people.
internationalmonetary.wordpress.com
Another excellent analysis, Professor!
My only quibble is with your solution. It is totally a Keynesian solution focused on government spending. Almost everyone knows that our only hope to solving our problems is growth and most understand that growth comes from production.
Ignoring the production side of our economy is foolish. Simply reducing the amount of government spending to more closely align with government revenue does nothing for production. Acutally it causes more hardship for the citizenry with no return.
While you do recognize that more revenue is needed I do not see a sound proposal for how that will be accomplished. It seems that the assumption is that production will return through some magic of the business cycle but that assumes that the business cycle is outside of government influence.
In truth unless there is a concentrated effort to restore the productive economy your scenario is all the more probable. Neither Democrats nor Republicans seem to understand this. Democrats want to raise revenue by increasing taxes but that has proven to be a nighmare, and Republicans want to reduce the debt by cutting spending and ultimately services, something that will only hurt people with no remedy.
We must get real about growth. Throwing more money at the problem will do nothing. Money is like a drug. When it is used properly it enhances life and solves problems. But when it is abused it is powerfully destructive. If you have a son addicted to drugs you do not solve his problem by throwing him more money.
Professor Hamilton, what was the interest rate pattern on Treasuries and Sterling Notes from 1929-1939? Also, what has been the interest rate pattern of Japan from 1990 to the present? If Fiscal austerity is applied now, will not that continue to repress growth and increase unempoyment? Will lowering the standard of living for most people post-retirement over the medium and long-term (since this is what “entitlment reform”) and increasing redistribution of wealth to the upper .1% (which is usually what “broadening the base and lowering corporate tax rates” means) means further depress demand and increase the desires of individual desire to save and choose not to spend? Will lack of demand discourage private investment? I would look back at all those experts and look at their interest rate predictions from 2009 to 2013 made in 2008 and see how accurate they have been.
One additional component I’d like to see modeled is the effect of demographics on the demand for treasury bonds.
You mentioned in the previous article: “Japan’s aging population, their saving rate will decline and the government will soon be forced to borrow on international markets”
The international markets might not be an option because advanced economies are all aging together 5 to 15 years after Japan.
This will also have an effect on U.S. interest rates. Do we have an idea of the magnitude of this effect?
I really did read the paper and my comment wasn’t about the paper but about the blog post. I tried to be very clear about that and said, “I expected more from this blog post.” I enjoyed the paper but thought and still think the blog post is extremely lacking.
You have an opportunity to write about this work without the requirements of technical detail and without the need to couch for academic purposes. But you linked to yourself and, as I said, glided past the actual work of the paper with a few words about maybe. That was my complaint. I’m sorry if you think I was repeating what Krugman or O’Brien said but I haven’t seen the latter at all and I think Krugman only posted a note about the Eurozone that took about 2 seconds to scan.
Now, if you’re going to get into these points in your next post, great.
I don’t read this stuff for political purposes. I don’t give a rat’s ass about that. I’m interested in what work says and how it’s explained. Those are often, as you certainly know in academia, very different.
So for example, I was drawn to the paper because of paragraphs like those on p.17. You jump from a mention of the possibility of non-linearities on p.16 to say: “The above considerations led us to add squared and cross-product terms to the regression (17).” You then note, “In a regression based on gross debt, all of the second-order terms turn out to be highly statistically significant”.
Unless you can tell me why in words then it’s just a modeling exercise. It’s interesting, but it’s an exercise if your explanation is a link to yourself and words like “maybe”.
Have I made myself clear? I’m not going to insult you by saying you should “think for yourself” and similar nonsense. I’m asking now and asked before for you to put more effort into explaining your work.
Regarding global net oil exports, here is a short essay I wrote in 2010:
The OECD “Thelma & Louise” Race to the Edge of the Cliff
“Thelma and Louise” is an American movie that ends with the two main characters committing suicide by driving off the edge of a cliff. I’ve often thought that this cinematic moment is an appropriate symbol for the actions of many developed OECD countries that are in effect borrowing money to maintain or increase current consumption. The central problem with this approach is that as my frequent co-author, Samuel Foucher, and I have repeatedly discussed, the supply of global net oil exports has been flat to declining since 2005, with “Chindia” so far consuming an ever greater share of what is (net) exported globally.
At precisely the point in time that developed countries should be taking steps to discourage consumption, many OECD countries, especially the US, are doing the exact opposite, by effectively encouraging consumption. Therefore, the actions by many OECD countries aimed at encouraging consumption in the face of declining available global net oil exports can be seen as the OECD “Thelma & Louise” Race to the Edge of the Cliff. I suppose that the “winner” could be viewed as the first country that can no longer borrow enough money, at affordable rates, to maintain their current lifestyle. So, based on this metric, Greece would appear to be currently in the lead, with many other countries not far behind them.
Something that Jim Hansen (the investment manager) highlighted in his weekly report:
OECD Says Oil Prices Could Reach $150-$270* a Barrel By 2020
*In constant dollars
http://www.nasdaq.com/article/oecd-says-oil-prices-could-reach-150-270-a-barrel-by-2020-20130306-00867#ixzz2N3c9jwL2
>
End Excerpt
I found an interesting correlation. The average rate of change in the ratio of Global Net Exports of oil to Chindia’s Net Imports from 2005 to 2011 was about -9%/year, while the average rate of change in annual Brent crude oil prices from 2005 to 2012 was about +10%/year.
Here are the annual Brent crude oil prices since 2005 (nominal prices), along with the rate of change by year relative to the 2005 price level ($55). Also shown, in parentheses, are the GNE/CNI* Ratios and rates of change, by year, relative to the 2005 measurement (8.9).
2006: $65, +17%/year (8.2, -8%/year)
2007: $72, +13%/year (7.3, -10%/year)
2008: $97, +19%/year (7.0, -8%/year)
2009; $62, +3%/year (6.2, -9%/year)
2010: $80, +7.5%/year (5.6, -9%/year)
2011: $111, +12%/year (5.3, -9%/year)
2012: $112, +10%/year (NA)
The median rate of change in Brent prices was 2011, at +12%/year. The average rate of change was +10%/year.
The average rate of change in the GNE/CNI ratio from 2005 to 2011 was about -9%/year.
*Ratio of Global Net Exports (top 33 net exporters in 2005), or GNE, to Chindia’s Net Imports, or CNI:
http://i1095.photobucket.com/albums/i475/westexas/Slide4-4_zps9a9c4aed.jpg
Link to long article on my outlook for Global and Available Net Exports:
http://aspousa.org/2013/02/commentary-the-export-capacity-index/
Some comments on the paper:
(1) I would have liked to have seen an appendix that showed more of the regression diagnostics. For example, you would expect the gross and net debt parameters in eqn 17 to be highly co-linear. Granted, each of the t-stats indicates each is separately significant. But then when you add the interaction terms in eqn 18 the gross debt term is not significant. In eqn 19 the net debt term is significant with the net debt coefficient being very close in magnitude to the gross debt coefficient in eqn 17, with the sum of the interaction coefficients in 19 being very close to the net debt coefficient in eqn 17. Something just doesn’t smell right. Too much instability for my tastes. I think we need more diagnostics to calm some concerns about possible model misspecificantions. The results just don’t seem robust enough.
(2) Parts of the paper seem to contradict other parts of the paper. For example, this statement:
Both theory and evidence suggest that a policy of “tough love” is counterproductive.
is hard to reconcile with this statement appearing only a few paragraphs later:
One could easily imagine that the spending cuts called for under the Budget Control Act of 2011 (sequestration, etc.) will not be allowed to go through and that the prospective path of U.S. debt will exceed current expectations.
Talk about mixed messages!
(3) Too much praise for the Simpson-Bowles Commission. As you yourself once argued, we should pursue a piecemeal approach towards a sustainable budget path rather than some grand solution.
(4) Too much lumping of SS/Medicare/Medicaid into a single “entitlement” problem. The SS problem is easy to fix and just requires that we go back to capturing as much payroll revenue as we used to capture. Medicare/Medicaid are driven by healthcare costs in general. Just cutting healthcare costs on the federal govt side of things does not increase welfare if those costs are simply shifted to other sectors of the economy. We need more emphasis on total welfare and less emphasis on just the federal govt’s deficit.
(5) The hypothesized way that interest costs increase is out of a concern that the govt will effectively partially default by monetizing the debt. Higher inflation. But suppose the govt decides to renege on promised entitlement benefits? Why should we believe an investor would not treat that as a kind of default? And if households react to the possibility of reduced SS and Medicare benefits, shouldn’t we expect a shock to consumption and saving patterns that might be very hard to predict?
(6) As your paper makes clear, the problems you are talking about are all fairly long-run problems, and here there are reasons for hope. Most of the political roadblocks are coming from a political party that is (literally) dying off. The GOP base is white, conservative, southern and old. By the end of the decade most of the Tea Party voters will be pushing up daisies. We make political progress funeral by funeral.
(7) The most interesting part of the paper is at the end regarding possible monetary policy strategies.
(8) Finally, there should have been a little more discussion of the lighter debt burden that comes with higher unexpected inflation. In other words, since the Fed has been trying to raise inflation expectations, why should we be too concerned if the Fed actually keeps its promise? Are you arguing for a temporal inconsistency in which the Fed promises higher inflation today and then tries to check inflation when it actually gets rolling?
Regarding the op-ed, I believe your paper would have had more positive effect if it had been summarized in the FT, NYT or (God forbid!) the WaPo rather than the WSJ. It’s a sure bet that the typical WSJ reader is going to conclude that what we need right now is immediate, deep cuts in social safety net programs. I doubt that very many WSJ readers picked up on your call for increased revenues as one path to fiscal balance.
JDH, in your paper you cite the “plan of the Simpson-Bowles Commission.”
You should know better. No plan came out of the Simpson-Bowles Commission. The proposed plan was voted down by the Commission, including by deficit frauds like Paul Ryan. Simpson and Bowles later published their own opinion piece but it was not the product of the Commission and you give it undeserved credibility by implying that it was.
Prof.,
Doesn’t the chain of causality matter? As far as I understand, a decreased demand for American debt would mean other countries are running lower trade surpluses with us, banks don’t have excess reserves, companies aren’t hoarding cash – what have you.
I think rising yields capture the health of our macroeconomy and, as a result, imply that the same automatic stabilizers that are causing deficits will bring in more revenue as employment increases.
I have more detailed thoughts outlined here, if you’re interested:
http://ashokarao.com/2013/03/10/no-tipping-point-in-sight-unfortunately/
Btw, the models used seem v interesting. Wonder what CBO will project.
JDH,
Excellent post. I think you make a cogent case that the adverse feedback loop that you describe could indeed happen in the U.S. and that we do need to address long term fiscal issues as a result. However, I’d disagree that plans such as Simpson-Bowles show the way and that it’s just a matter of summoning the political will to do what’s necessary. I don’t think it’s lack of political will that’s the problem. The problem is that there is real disagreement about how to resolve this issue.
The problem with plans such as what came out of the Simpson-Bowles commission is that they don’t attempt to reform the health care system, which is much of the long term spending problem. That’s why Paul Ryan refused to vote for it and I think he was right.
If we merely cut the growth rate of spending without reforming the health care system, we’ll end up with irrational rationing, with allocation of medical care being decided in Washington by commissions and committees of so-called experts. I appreciate that you want to increase tax revenue by broadening the base rather than by raising tax rates. That’s very sensible in that it mitigates the incentive effects of the tax increases. However, I fear that without fundamental reform, the increases in revenues will just be wasted. Much better to starve the beast in my view.
Rather than supporting something like Simpson-Bowles, I’d much rather see Obamacare repealed and replaced with free market reforms that incentivize patients and doctors to cut costs rationally. Instead of trying to cut spending top down from Washington, why don’t we reform the system so that the cost cutting happens from the bottom up?
I and perhaps your other readers would be very interested in a post explaining in more detail what you think the solution should be. If it is something like Simpson-Bowles, why?
Why do you project interest rates maxing out at 5.2%?
Please show how this is a justifiable assumption.
Given rising debt it would seem logical that interest rates head back towards historic highs?
A peak of between 10 to 15% for a few years would surely be more logical after a period of “historic unprecedented LOW interest rates”?
Have we forgotten the Paul Volcker years?
A flat peak interest rate fixed at 5.2% seems to be rather optimistic to say the very least.
Jeremy: That’s the point I was making. Even with that assumption, we’re in trouble.
JDH,
I think you failed to consider the following. The FED could buy all outstanding Treasury debt and pay 0% interest on reserves. Some may think all those reserves will lead to unlimited credit expansion and inflation because banks can lend to 10X reserve position. But what about countries where there are no reserve requirements. Banks in those countries could lend to infinity X reserves positions. But they don’t. That’s because banks are not reserve constrained when lending. Banks lend based on capital requirements and having credit worthy customers that are willing to borrow. The Fed supplies reserves in response to demand; not in advance of demand.
I think focusing on nominal rates is completely misplaced. Real rates are at historical lows as well and that is in part due to demographic and technological reasons. You want to look at high historical real rates and 2.7% – 3.2% looks much more conservative in that dimension. You are just playing the nominal optics.
I think assuming that interest rates on government debt will exceed nominal GDP is incorrect. Government have financial repression powers and they can use them. They used them after ww2 and the economy was still doing fine.
I don’t think anybody is arguing about the fact that every increasing government spending has to be paid by higher taxes at some point. It’s just reality. Modifying our behaviour today in order to be able to keep all seniors on artificial respirations in 2035 seems absurd to me.
Taxes (and automatic stabilizers) are causing the deficit today. The deficit is already low enough to be roughly balanced by growth. If the economy goes back in recession, the FED has already promised higher inflation.
I think you are worrying about the wrong problem.
Professor,
Could you do another analysis of the FED balance sheet? It appears to me that they have drastically changed direction and it has not been noted by anyone.
Didn’t we already pass that point, triggering the Fed to start monentizing ?40% of all current treasury bond issuances? If the Fed didn’t start buying the extra treasuries, wouldn’t interest rates already start rising, perhaps uncontrollably?
Central Banks have the assets liabilities management problems of the traders books. This time is different, none of them have ever experimented the exit of such large volume of assets purchased at such high prices regardless of the solvency risks kept as constant. These books imply the integration of the following:
Volume, maturities ,assets classification, assets prices marked to market, assets kept till maturities, tradable assets, markets breath and counter parties viability. As often, assets filed as to be kept until maturities,may depending of the circumstances become tradable assets.
A confusing situation usually left to the Banks under BIS rules and protected under the philosophical vocabulary of Value at Risk.
Volume:
http://www.usdebtclock.org/
ECB and US Central Bank have around 20 % of both aggregated GDPs, the US federal Reserve own around 20% of the long term maturities of the US treasury bonds.
Many financial operators, politicians were pleased to let the central banks shoring up assets prices and general solvency and as many of them will be prompt to ask and now what?
Bloomberg « Bernanke Provokes Mystery Over Fed Stimulus Exit »
As for Europe it is a more papal mystery, the bubbles have been enacted and no indulgences can be purchased.
Ricardo-
Why do you think we can be more productive. Is the US labor force getting younger? No, they are getting older and fatter. No matter how you tweak fiscal and monetary policy you can’t get old fat people to be productive. We need to stop thinking we can grow our way out of this. It is not going to happen.
@ Anonymous
Why can’t old, fat people be productive?
In fact there is every reason to believe that experience makes you more productive, and I see no reason to believe that weight has any bearing on productivity.
Lot’s of things could be said about HOW the government spends its money – investing in infrastructure will almost certainly yield greater GDP growth than e.g. wars. How you bail out banks is at least as important as if you bail them out.
“starve the beast” is probably part of the problem, rather than part of the solution. Spend smarter, not less!
As Ricardo says: we’ve gotta grow the economy!
Dr. Hamilton-
1. It would be informative if, at some time in the future, you summarized the arguments why there is a divergence in economic opinion about why net rather than a gross federal debt/GDP ratio is important.
2. Isn’t the real issue whether the unsustainable accumulated deficit [both public and private>/I>] will be mitigated by financial repression (real yields below inflation), or by austerity (reduction in debt servicing, [whether by default, bankruptcy, or reduction in public “entitlements”])?
3. (Page 4 of your paper): “As interest rates rise, the Fed will need to pay more to persuade banks to hold any remaining large balances of excess reserves“. Isn’t this statement false? Is it not true that the FED has the flexibility to establish whatever reserve ratio it wants in order to control debt money expansion?
All in all, I enjoyed reading “Crunch Time”, and fully support your efforts to persuade politicians and the public to face up to their responsibilities.
I have a feeling that once FED feels stocks has reached stage of autopilot increase, they will address Treasury rates again, bringing them down, moving bond prices up as QE will not be needed so much anymore to support stock prices . Might be very very soon.
It will be good to the holders of Treasuries not because of yields, but because of capital gains.
FED wants anything people hold to increase in fictitious financial value of assets by QE, and then use them as collateral to go back in debt again, as only moving private sector into debt more will carry QE over to increased consumption, fueling another bubble, and bankers will be happy as well as interest continues to flow. Housing is gone for good. Stocks come next. Bonds last. Then, if that does not work – something will have to be done that finally will kick inflation in.
So there are still some options, perhaps the time is shrinking- speeding up, but there is at least 1-2 years before sharp increase in fiscal spending will be needed ( except in case of war earlier, of course). Politically they can may be hang in even till 2016 elections with asset bubbles.
Anonymous,
I don’t know if you intended it but your post made me burst right out laughing. Thanks!
Deflationary spiral has the same problem. The US died already(in 1895 and was nearing that point again in 1933) due to this. Confidence declines, debtholders want nothing to do with the economy. Leads toward collapse of the bourgeois state and default. Grover Cleveland errored to the robber barons bailed “us” out. Should capital owners have such power?
The main support for a “Keynesian” expansion is that it will build support for the US economy and boom confidence. So lets say we get a multi-trillion dollar “investment” in public and digital infrastructure that brings us up to European capability. This would surge alot of capital to the US. Europe doesn’t know how good they could have it if they would resolve the monetary BS they are operating in.
Thus, if the US would borrow to build these improvements over the next 10 years, we get big capital flows, innovation and restoration. GB is like baby US. Same problem. They are lagging behind their “brothers” in regard to this physical and digital infrastructure.
Heck, people were complaining how American weather models suck…..all in the ROAB network, we need to spend money upgrading it for better results. That is only one of several areas where deficit spending can bring satisfaction.
Wasting money on transfers alone is what Keynes would call “inefficent” deficit spending. This is not a blip, but major structural problems with the end of peak boomer spending and the end of cheap oil. During this time, America accrued a infrastructure deficit and that needs to be replaced or growth will never get going like it could. The energy problem is a global problem every country has.
JDH You said that you intended to address some of the comments from O’Brien. As I understand it, O’Brien said that he reran the regressions segregating euro and euro-pinned countries from non-euro countries and found different slopes. Looking at your fixed effect panel regression it looks like you tried to capture some of the time invariant factors (e.g., euro vs non-euro) through separate country variables rather than transforming the data by subtracting the country means. You also set time dummies. An expensive strategy in terms of eating up degrees of freedom, so I don’t know what effect it had on the efficiency of your regressions. Still, you had 240 observations, so some df’s to spend I guess. So if the slopes were the same, then your country specific dummies should have picked up any omitted variable like euro vs non-euro. And that would answer O’Brien’s concern about not accounting for independent versus dependent currencies. Still, that doesn’t mean the slopes were the same. To some extent a fixed effects panel model assumes all countries share a common slope. In other words, it kind of assumes away the problem. Just as a sanity check, did each of the separate country regressions visually justify a similar slope?
But I have some additional questions beyond O’Brien’s comment. The panel data only captures 12 years of time series data compared to 20 cross sectional groupings. A fixed effect panel model that looks like that is fine for short run dynamics, but if you want to look at long run dynamics the literature recommends a random effects model (assuming it’s feasible). Doesn’t this suggest that your regression results are really applicable for those countries that are near a tipping point over the short run and may not apply over the longer run? And in a related concern, would the fixed effects panel model better capture the short run dynamics if you included a lag of the interest rate and corrected for any bias that this might introduce?
And for the “out there” comment, I looked at some of the interest rate and IMF debt/GDP data. One thing that jumps out is the abrupt change in volatility of both variables beginning in late 2010…just the point where your study cuts off. Doesn’t this suggest that variability should be explicitly modeled in some kind of panel GARCH representation that would capture the risk premium from higher volatility? And to be clear, I am not just talking about higher interest rates and higher debt/GDP ratios over the last couple years, but high volatility.
Rick Stryker I’d much rather see Obamacare repealed and replaced with free market reforms that incentivize patients and doctors to cut costs rationally.
FYI. Obamacare is a small but significant step towards reining in healthcare costs. If you really want to get healthcare costs under control, then you should want a single payer system that has the ability to negotiate prices and say “no” to useless tests and procedures (think “death panels”).
2slugbaits at March 10, 2013 11:49 AM: On your point (1), usually with highly correlated explanatory variables one finds that one can measure their combined effects with precision, or find something statistically significant when either one alone is included, but t-statistics when both are included are usually not individually significant. I’m sure the latter is what most people would have expected to find when both net and gross debt are included. But instead we find both make a contribution– there is something a little different that each picks up, although we find gross is a better single measure than net in our data set. Similarly, debt, debt^2, and debt*CA are correlated, so I wouldn’t read that much into the insignificant coefficient on debt when debt, debt^2 and debt*CA are all included. Again the typical thing one expects in such a situation is that individual coefficients may not be significant but the combined contribution of the variables can be reasonably estimated.
More broadly, we do not mean to suggest that only gross debt matters, or only net debt matters. For that matter, it’s not our intention to try to read too much into the particular numerical estimates. But what we do demonstrate is that there is significant evidence in the data of the kind of tipping points that our theory suggests could be there. Where that particular point comes for a particular country we don’t claim to have estimated with great precision, as we explain in detail on pages 20-21 of the paper.
2slugbaits at March 11, 2013 02:33 PM: Well, I invited readers to think for themselves until I had a chance to comment on O’Brien, and I have to say, well done! I will elaborate on your first point in my next post. For now I just mention that including country fixed effects is numerically identical to subtracting the mean for each country before beginning the analysis.
As for the second concern, our estimates and the theory we sketch both imply a levels relation. One could try to develop a detailed description of short-run dynamics, and at one point we were thinking about trying to do that, basically doing something with the high-frequency data plotted in Figures 3.3, 3.6, and 3.9. We ultimately decided that was too ambitious (and impossible to complete within the deadline), so settled for the combination of annual levels regressions and a narrative interpretation of what was going on with higher frequency data.
Professor Hamilton,
If a panel data fixed effects model output shows a Durbin-Watson statistic significantly different from 2.0, is it proper to add AR(n) factors as a way to remove the autocorrelation of residuals?
Inspired by 2slugs, I’ll try once again. I doubt I’ll be clear enough.
I read 2slugs comment – many thanks to him – and then looked at O’Brien’s criticism. I saw it is essentially one of hackery: either the Eurozone issue was missed or hidden. I assume the statistical work is fine, though of course you should have discussed the point and it’s a pity the reply has to eke out in response to a comment on a blog.
As I noted above, you introduce squares and cross products. You never discuss these relationships or what they mean other than to say they are used – and, as I remember, that everything turned out to be highly significant. You generally state that various issues suggest the use is appropriate but I’d say each use needs to be thought through. Why? Because my reading is that you describe a shit storm with highly correlated factors that jumble causation. That suggests to me the rest of the paper, meaning the case studies, are highly limited because I don’t trust you can change x and get y result in a shit storm. That comes off to me as mechanical but not warranted without explanation of why the underlying model works that way. I’m not sure that work can be done, not without a lot more data. If you have a ball of correlated shit, you can pull a lot of crap out of it and yet it’s still crap. (No offense intended in that remark or in these comments generally.)
I could say more about the case studies but my main interest is in how models work. I decided a long time ago that it isn’t worth my time to pick apart statistical work. I try to understand what is going on. So again, I think the paper is cool: it introduces a neat bundle of non-linear messiness. I like that. But I have no idea what that bundle breaks into and thus how it can be broken apart with real belief in those results. So can the US face a tipping point? Yeah, of course, if there is a shit storm. And I can see value in looking at what makes a shit storm, though my guess is we could vary the shit storm sources and come up with a similar but different shit storm.
I apologize again for not being able to express myself more clearly. I find it’s very difficult to talk about statistical issues in terms of meaning. That is my failing.
Banks saved, but Europe risks “losing a generation”
http://www.reuters.com/article/2013/03/11/us-eu-parliament-crisis-idUSBRE92A08W20130311
Jonathan: Thanks for trying again. I’m still not sure what I could say to engage your concerns, but let me try this approach.
I understand you to be saying that you are uncomfortable accepting these particular nonlinear regression results. Fine, let’s take that as a starting point for discussion. Let’s assume that you’re not going to believe any results from these or any other regressions. Let me invite you then to re-read the post taking that position as given.
Let me ask you, from that perspective, what is your reaction to Figure 4 above? Are you bothered by the possibility that within a few years, interest expense will be bigger than the defense budget? Note that the source for that claim is the Congressional Budget Office. In calculating that projection, they have assumed that the coefficients in the regression you were concerned about are all exactly zero.
And what did you think about Figure 5 above? Although this did not come from the CBO itself, it represents our best effort to do a similar calculation to the one they performed in their previous long-term assessment. Again, I was calling attention in Figure 6 that the calculations in Figure 5 assume that all the coefficients in the regression we are discussing are exactly zero.
And finally, let me call your attention to what I posed as the central question is this post: “The supply of Treasury debt is projected to continue to grow as a percent of GDP. Why would the demand for Treasury debt grow faster than GDP if there is no increase in yield?” You should be able to reflect on that question, again even if you choose to ignore all our regression results.
And, as I indicated before, if your reasons for ignoring our regression results are those raised by Krugman and O’Brien, I hope you will find those concerns adequately addressed in my next post.
@ bewildered and ricardo,
By old I mean retired, and by fat I mean “disabled.”
There are fewer and fewer people working and these few people have to support more and more people. Forget about growth, it’s over.
JDH A small disagreement about subtracting the means before beginning the analysis. It is true that it is numerically equivalent to using dummies, but subtracting the mean also subtracts the time invariant piece of the intercept, so the omitted variables that get lumped into the intercept can have a slightly different interpretation. Using dummies gets around this problem but it can be expensive in terms of degrees of freedom.
2slugs,
Did JDH say that he deducted the mean of the dummies prior to analysis or did he say that the fixed effect for a variable is equal to the regression coefficient of the dummy related to the variable minus the mean of the dummies ?
AS
The fiscal and debt pictures in figures 5 and 7 seem to be too optimistic. Given the recent legislative scenario in the fiscal policy area, why should we assume that the tax revenue increase between now and 2016 presented in fig 5 will materialize ? Same kind of concerns exist for fig 8. The prediction that gross debt to GDP ratio will remain at about the same level till 2025 is most likely too optimistic. If fig 3 could be extended to 2025 with good models, that would give a better picture of the fiscal scenario by that year. The actual onset of fiscal nightmare scenarios may happen about 10 years prior to what this article predicts unless more decisive steps are taken in the fiscal policy area.