I have been writing recently ([1], [2]) about my paper Crunch Time: Fiscal Crises and the Role of Monetary Policy, co-authored with David Greenlaw (Managing Director and Chief U.S. Fixed Income Economist for Morgan Stanley), Peter Hooper (Managing Director and Chief Economist for Deutsche Bank Securities Inc.), and Frederic Mishkin (professor at Columbia University and former governor of the Federal Reserve). Our paper has generated some interesting discussion by
Paul Krugman and
Matthew O’Brien, among others, to which I’d like to respond.
Our paper presents 90 pages of analysis and evidence. In fact, in my previous Econbrowser entries, I still haven’t had a chance to touch on the role of monetary policy in dealing with these situations, which was one of our primary interests in the paper. I promise to bring these issues up in my next Econbrowser post. But it seems some readers were distracted by the criticisms raised by Krugman and
O’Brien, or perhaps shared related concerns of their own. So I thought it might be best to take up those concerns now, and discuss the implications for monetary policy later.
Krugman and O’Brien focus entirely on a single subsection of our paper which reports results from statistical regressions that try to predict sovereign interest rates as functions of conditions that prevailed in a country during the preceding year. These regressions use a panel of 20 different countries followed for a period of 12 years. Krugman and O’Brien note correctly that 13 of these 20 countries are in the European currency union, and suggest, appealing to De Grauwe’s (2011) analysis of particular challenges facing the eurozone, that the experience of those 13 countries has no relevance for countries not in the eurozone.
Let me begin by discussing the econometric issues and then turn to the economic issues. Here are the results from one of the regressions in dispute:

Note first that the possibility that every country is different is already incorporated in our baseline regression model in the form of country fixed effects. The special characteristics that may make one country different from all the others are captured by the coefficients
αi in the above equation. These represent 20 different numbers, with a different value for αi estimated for each country i in the sample. A special case of that specification is one in which the eurozone countries as a group are different from the non-eurozone countries as a group, that is, a regression in which there are two different parameters αeuro and αnoneuro. We instead estimate a much more general specification than that, allowing for 20 different values for αi instead of only two.
Thus our baseline assumption is that the effects in question will show up differently in different countries. We comment in detail in our paper, for example, on the fact that countries like the U.S. and Japan seem to have a significantly higher debt tolerance (in the form of big negative values for αi) than other countries. I should also mention that we allow for separate year fixed effects in the form of a different estimated value for γt for each year t in the sample. Our baseline assumption is that every country could be different and every year could be different.
By the way, one implication of this feature of our specification is that scatter diagrams such as those plotted by Krugman and
O’Brien are not a valid device for seeing visually what is behind the estimated regression coefficients. To do this properly, the variables plotted on the axes should be deviations from within-country and within-year averages, not the raw data as is done in their figures. And while I am on the topic, I should point out that Krugman’s scatter diagram is unrepresentative of the relations underlying equation (3) above for a simpler reason: none of the data points plotted in Krugman’s figure were used at all in the estimation of equation (3). Instead, the points he plots are out-of-sample values, namely, 2012 interest rates. These came in after we had performed the estimation of (3). These data are consistent with equation (3), but were not used in any way in the estimation of (3).
It is true that we allowed for differences across countries only through differences in the intercept. One might argue more generally that countries differ not just in the intercept but in all of the slope coefficients as well, wishing to estimate a value for the coefficient on bi,t-1 and all the other variables that is a different coefficient for each country i. However much one might wish to do this, this would have been quite a pointless exercise, since one would then be trying to estimate 6 different parameters for each country from 12 total observations for that country. Even so, it would still be less general in one respect from our equation (3), in that the latter allows for changes in interest rates over time captured by the year fixed factors, whereas a single-country regression would not allow for time heterogeneity.
Or, perhaps Krugman and O’Brien would be willing to suppose that non-euro advanced economies as a group share the same slope coefficients, that is, share the same coefficients on variables like the debt and the current-account surplus, and then estimate those common coefficients from panel regressions like ours, with two different sets of slope coefficients, one for eurozone and another for other countries. O’Brien reports that when he tried to do this, he found no effects of debt. But if you chop the data set down to only a half-dozen countries, you’re going to need a longer time series if you hope to estimate the relation with any kind of precision.
There are plenty of other researchers who have done just that. For example,
Ichiue and Shimuzu (2013) looked at a panel of 10 advanced economies over 1990-2010, of which Germany is the only eurozone member. They found that a one-percentage-point increase in debt-to-GDP, if matched by a 1-percentage-point increase in country external debt, was associated with a 3-basis-point increase in the 5-year-forward 10-year yield. Reinhart and Sack (2000) looked at the pre-euro G7 (1981-2000), and found that a 1-percentage-point increase in projected government-surplus-to-GDP was associated with a 12-basis-point decline in the 10-year over 3-month yield spread. If you want to insist that the only evidence relevant for the U.S. is historical U.S. data, let me point you to Laubach’s (2009) analysis of the effects on yields of changes in CBO budget projections over 1976-2006. He found that a 1-percentage-point increase in U.S. debt-to-GDP was associated with a 3-to-4-basis-point increase in the 5-year-forward 10-year rate. And if you’re willing also to look at evidence from emerging economies or go farther back in time, there are many, many other studies confirming the basic relation that Krugman and O’Brien want to insist couldn’t possibly apply to a country like the United States.
If you consider what equation (3) above implies for an advanced economy with moderate debt loads, it is quite consistent with most of the studies just mentioned. For example, if a country has debt-to-GDP of 60% and a balanced current account, equation (3) says that a 1-percentage-point increase in debt-to-GDP would be associated with a 2.7-basis-point increase in the 10-year yield.
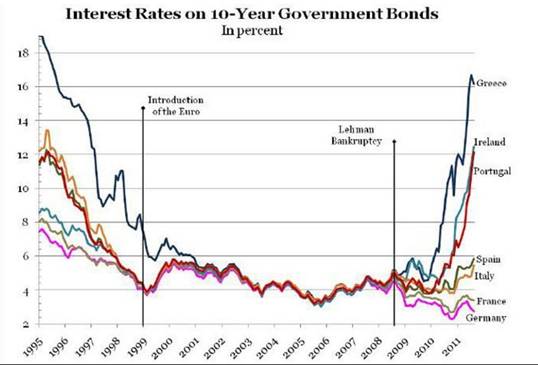
Another indication that the recent problems in Europe are not just a reflection of problems with maintaining the euro is provided by the remarkable similarity between recent moves in interest rates and their behavior before establishment of the euro.
|
It is true that you won’t find statistical confirmation of the nonlinearities reported in equation (3) if you confine yourself to recent experience in the major non-eurozone advanced economies. There’s a simple reason for that– these countries have not yet reached the tipping point in the dynamics of fiscal debt loads.
Are Krugman and O’Brien claiming that they never could? Do they maintain that U.S. debt could become an arbitrarily large multiple of GDP with no consequences for yields? If they acknowledge that there is a level of debt at which these effects would start to matter for the United States, what is their estimate of that level, and how did they arrive at it?
In our paper we offer our answer to these questions. We conclude that a country’s debt limit depends on its borrowing rate, its economic growth rate, and the fraction of GDP that the public is willing to commit to maintaining a permanent primary surplus– that is, government revenues minus spending on all items other than interest expense. If Krugman, O’Brien, or anybody else thinks they have some other answer, let them articulate it clearly and cleanly.
Whether a country is able to borrow in its own currency is completely irrelevant for the above calculation. Yes, it means the country likely won’t technically default on the debt, and could always create new money to pay off the creditors. But as
Reis (2013) and Leeper (2013) have recently explained, printing money does not generate any magical resources with which to resolve a real fiscal shortfall. The central bank could create some more inflation, but anticipated inflation does nothing to alter the above determination of the limits on government debt. Anticipated inflation would just cause the nominal interest rate R and the nominal growth rate g to both increase by the same amount, and therefore would do nothing to change the net growth rate r = R – g which is the key parameter in our equation for sustainability (see for example equation (2) in Econbrowser March 6 or equation (8) in our paper).
It is true that an unanticipated inflation would succeed in bringing the real debt burden down. But as soon as creditors become concerned that this is the way the problem will be resolved, nominal rates will rise and the game between the government and lenders becomes precisely the one we model, vulnerable to exactly the tipping-point dynamics we highlight.
Krugman and O’Brien seem to assert with great confidence that these tipping-point dynamics could never matter for a country like the United States. I find no basis in either economic theory or historical experience to warrant such a conclusion. Their argument ultimately seems to boil down to, “it can’t happen, because it hasn’t happened yet.”
Or rather, because it hasn’t happened here yet.
I think you are not fairly describing the criticism.
UK had higher level of debt after both the world wars and I don’t think we observed fiscal spirals in those cases. So your last sentence is not really true. Even in modern times Japan is showing that you can have 200% debt/gdp without a fiscal spiral.
Secondly you seemed to have assumed a maximum level of taxations for the US which is not at all obvious.
Finally unexpected inflation is not as neutral as you make it sound, since the initial shock will cause a large benefit to the government finances (depending on the average duration of federal debt). Financial repression (as experienced after ww2) could also constrain the raise in yields.
The complete lack on any other safe haven asset would also point to a large source of implicit financial repression.
Current projections already point to a stable debt/GDP ratio for the next 10 years. Given that the market is lending at negative rates at the current debt/GDP why would rates go up?
“printing money does not generate any magical resources with which to resolve a real fiscal shortfall.”
If there is a difference between permanent monetary expansion, and simply having the Fed buy govt bonds and tear them up, I don’t see it. Doesn’t tearing up debts reduce the debt/GDP ratio and hence debt dynamics?
[I fear this is going to turn out to have been a dumb question]
Agreed. Too much like housing prices can never fall.
Steve
If the fed supports the US bond mkt in this scenario, the only exit for investors would be to flee the dollar. The dollar is overvalued anyway because every central bank in the world wants a stronger dollar.
So yes Krugman could be wrong at debt 400% of gdp and every central bank in the world gets trampled in the stampede. This not a very likely. People have been saying the same thing about Japan for 20yrs and lost money. We are in much better shape than Japan. I hope Pete Peterson did not pay for this study.
I love the “debt threat/ hyperinflation” fear mongering..it makes it easy for me to make money.
Be afraid it is just around the corner..hahah
Jim,
In the late 1990s, early 2000s there was a lot of research on emerging market crisis. Part of this literature included empirical models used to estimate the probably of a currency crisis. These models used similar explanatory variables as your paper and more. They were a big deal back then. The funny thing was that if you plug the United States into these models they screamed a major currency crisis was imminent, if not already happening. Defenders of these models would often say the reason the models were wrong for the United States (but correct elsewhere) was that the U.S. held the reserve currency of the world.
I bring this up, because I think that is kind of the point Krugman and O’Brien are making. US public debt is the safe asset now, and given the shortage of safe assets and the lack of large-scale viable alternatives, it will continue to be for some time (i.e. r less than g for an extended period).
In other words, just like the world faces a Triffin dilemma for currency, it also faces a Triffin dilemma for safe assets more generally. And this dilemma means that r less than g for longer than we think. How does one reflect that in a regression?
With that said, I don’t think this means we should take this “exorbitant debt issuing privilege” for granted. Ultimately, there is still an intertemporal budget constraint in terms of real resources. Hence, I would prefer to see the private sector start producing more safe assets and there be less reliance on public safe assets.
Dear Professor Hamilton,
Thanks for the clear explanation of your model. I would like to know if there are any autocorrelation issues and how you handled them if present.
I Have Never Been Hit by a Meteorite or Lightning
“Their argument ultimately seems to boil down to, “it can’t happen, because it hasn’t happened yet.” Or rather, because it hasn’t happened here yet.”
Obviously, meteorites have wiped out entire species on earth and lightning has struck thousands of people. Should we all give up our jobs and take shelter because either one could happen?
There is no risk of a U.S. default or of the U.S. going broke. Fear mongering about a hypothetical “tipping point” which nobody can define while millions of Americans are devastated by unemployment is irresponsible in the extreme.
First, I think O’Brien and Krugman have reacted to your popular Op-Ed on WSJ editorial page and the political economic interest that you appeared to be serving by your argument and the popular debate which I put in caps as follows: IGNORE UNEMPLOYMENT, IGNORE ECONOMIC GROWTH; AUSTERITY NOW; CUT ENTITLEMENTS NOW!!! OTHERWISE THE DEBT MONSTER WILL EAT US ALL!!!). You also appeared to choose co-authors, whose track record of late has been dubious, more dubiouis then yours: Fred Mishkin might be a former Fed Governor, but ther is also this: http://www.youtube.com/watch?v=5msVl3oZl4U
You and Hooper were pretty pollanyish in 2008 (mild recession and only a 10% fall in house prices.
“It is true that you won’t find statistical confirmation of the nonlinearities reported in equation (3) if you confine yourself to recent experience in the major non-eurozone advanced economies.”
So the statistical work is fine but …
I don’t see any good in saying others believe tipping point dynamics “could never matter”. That’s like saying people don’t believe in tail events. A better statement is they don’t have the same sense of urgency.
you and everyone else think more about debt. Because paul almost literally has never seen a deficit he didnt like. I wont say, unlike a few others, hes a nobel winner who should have his prize taken back. he’s more a grey area.
I would not listen at all to him about debt, unless you think his statistical technique comment has weight
a debtor is vulnerable to creditors in a way a big creditor can never be. as a modeller you almost have to say who knows when creditors might pull the plug, unless you model confidence and future confidence, which i have tried with mixed success. Bond yields themselves usually lead payment difficulties
http://www.economics.harvard.edu/files/faculty/51_Debt_Overhangs.pdf
http://cdn.theatlantic.com/static/mt/assets/steve_clemons/How%20to%20Predict%20the%20Next%20Financial%20Crisis%5B1%5D-2.pdf
The discussion here is about federal gov’t debt, but the larger structural constraint for years to come is debt (and associated concentration of ownership of overvalued equity and real estate assets) in general to wages, business revenues, and gov’t receipts.
It is no coincidence that the top 0.1-1% become wealthier as a growing share of US households, businesses, and local, state, and federal gov’ts become more indebted and fiscally constrained, requiring a larger share of economic output to go to total debt service after taxes and price changes.
http://emlab.berkeley.edu/users/webfac/cromer/e211_f07/voth.pdf
Historically, these situations do not end well for a society and its elites. The previous periods during which similar conditions existed in terms of total debt and wealth and income concentration for a global hegemon (as is the US today) was France before the French Revolution and Spain during the late 16th and earlier 17th centuries.
The implication may be the reverse; if we insist on low growth in the name of price stability, we may eventually reach the debt limit. We cannot claim control over one and pretend concern over the other, but must recognize they are not independent but coupled.
This statement confuses me:
Another indication that the recent problems in Europe are not just a reflection of problems with maintaining the euro is provided by the remarkable similarity between recent moves in interest rates and their behavior before establishment of the euro.
To me, the data in question says much of the recent problem is exactly a reflection of the problem with maintaining the euro.
“One might argue more generally that countries differ not just in the intercept but in all of the slope coefficients as well, wishing to estimate a value for the coefficient on bi,t-1 and all the other variables that is a different coefficient for each country i. ”
All Krugman and others are asking is to split the bi into two: one for countries borrowing in their own currency and ones that don’t. It’s very easy to do this. Please show this regression. Thank you.
JDH Nice job of summarizing your position and I look forward to your next post on Section 4 and monetary policy almost as much as I look forward to the NCAA bracket post.
Part of the problem is that Krugman is being strategically disingenuous (isn’t that polite?) about his views on the debt. In other venues Krugman has made it pretty clear that he does believe there is some limit to debt accumulation even for the US…he is not an MMT guy. But as Krugman once said in an aside, our politicians and VSPs cannot walk and chew gum at the same time so any talk of fiscal consolidation will inevitably get twisted into austerity now. Just a few days ago Krugman said that if the economy were currently at full employment he would become a rabid deficit fiscal hawk overnight. And if you read some of the Tea Party crazy comments on this blog I think you’ll have to agree that Krugman has something of a point about not being able to walk and chew gum. But even though Krugman actually does believe there is some upper limit on government borrowing, I don’t think he believes it is something we know. Ontological questions are one thing; epistemological questions are quite another. The econometric evidence doesn’t support a specific threshold value that is given the status of natural law. Failing to fix the long run budget imbalance would be stupid policy; but failing to fix the short run aggregate demand problem would also be stupid policy. Our politicians are only capable of one thought at a time, so you cannot talk about a nuanced policy that is context sensitive and conditional.
Going back to your regression, I agree that it’s possible to see a lot of wildness in the coefficient estimates and the model could still be okay; but my experience has been that more often than not this kind of behavior leads to poor out-of-sample performance. One reason goes to something your late colleague Clive Granger found: spurious regression. Granger found that 75% of the time a spurious regression will report high R^2 and t-statistics. Just for yucks I looked at the FRED data for US debt/GDP, 10yr interest and current account balances, as well as the squares and cross-products. Twelve data points isn’t a lot to go on, but almost all of the variables on both sides were nonstationary. Very small changes to the model moved the regression residuals from stationary to nonstationary, suggesting very different model interpretations. One interpretation is that debt and current account balances follow a braindead random walk reflecting policy errors and having a permanent effect. This biases any regression to predict an explosive and unsustainable path because what it really captures is non-decaying policy idiocy. Will we always have idiot policymakers? I was just looking at mid-90s paper by Elmendorf/Mankiw on government debt. They predicted doom and gloom and worried we were at the tipping point when the debt/GDP ratio was half of today’s. Amazingly we got smart. I suspect the real threshold isn’t a percent of GDP, but whether or not investors believe a country’s political process is broken. That can happen at a 30% debt level or a 300% debt level. Maybe we need a regression that includes a “dummy” variable for the number of Tea Party crazies in Congress.
If I were King 2slugbaits the First we would increase fiscal spending such that we would be on track for full employment by 2015. Then after 2015 cut discretionary spending that does not support potential GDP growth, increase tax rates, institute of small VAT, a carbon tax, etc. Over the long run we are going to accept govt spending at 23% and we’ll need revenues to match it. And we’ll need death panels to control healthcare.
Japan is special for another reason not noted by Krugman – it not only has its own currency, but the nation and its government are huge net foreign creditors. The regression of our host would handle this effect (the country-specific effect), whereas Krugman’s plot ignores it, and without Japan, PK’s plot looks a lot less convincing.
But why was DeGrauwe not cited in the original work of 90 pages?
The govt debt is just the private sectors desire to have net savings. Low interest rates (entirely set by the FED) and a poor economy increase the desire of the private sector to save. All the math in the world does not predict how much savings the (global) private sector desires. After reading the post and the comments, I am reminded of the line from the movie Jaws: “Well it proves one thing, Mr. Hamilton. It proves that you wealthy college boys don’t have the education enough to admit when you’re wrong”.
As a non-economist, it’s hard/impossible for me to assess the relative validity of methodology and conclusions of such economic analyses, but, given appropriate evidence, I feel somewhat comfortable applying common sense regarding two key factors in the credibility of an expert: apparent objectivity and honesty, or lack thereof. (The third factor is expertise.)
So, may I introduce everyone who doesn’t already know him to Paul Krugman. The Paul Krugman of 2003, that is. The Paul Krugman who, at a time when the baby boomers were several years away from starting to retire, and when our debt/GDP ratio was much lower than today and the outlook for it less severe, Krugman (in NYT column http://www.nytimes.com/2003/03/11/opinion/11KRUG.html) expressed great worry and fear over the projected long-term fiscal imbalance (deficits and debt-to-GDP) once the Bush tax cuts were factored in, arguing that the Bush tax cuts made an already severe and extremely difficult-to-solve problem downright impossible to solve, thus putting us firmly on course for extremely adverse consequences. He told his readers that he was “terrified about what will happen to interest rates once financial markets wake up to the implications of skyrocketing budget deficits… we’re looking at a fiscal crisis that will drive interest rates sky-high”, describing this fiscal outlook as a “really scary…threat to the federal government’s solvency”, saying “the conclusion is inescapable. Without the Bush tax cuts, it would have been difficult to cope with the fiscal implications of an aging population. With those tax cuts, the task is simply impossible. The accident, the fiscal train wreck, is already under way.”
To say the least, he has been expressing a very different view (essentially the opposite view) over the last few years, and doing screaming this view just as passionately, ridiculing and attacking the integrity of those who today are saying almost what he was saying back then, although with at least a bit less alarmism (generally not stating emphatically that disaster is now inevitable, as he did).
Could this 180 reflect an honest analytical evolution/shift/revalation of some kind on his part, one he has never explained? Or is it more likely (ok, spoiler alert, it IS far more likely) that back then, or now, or at both times the views he expresses are the result of bias and/or dishonesty to support the economic policies and/or political party/president he thinks would be better for the nation (or at least for much of the nation)?
Krugman is the personification of one of the most harmful elements in our discourse over policy: the expert who abuses the trust many place in him due to his expertise — counting on him to help us understand what the trade-offs ARE among policy alternatives, so we can then apply our own values and priorities in choosing policy — to instead mislead people about what the trade-offs are as a means of promoting particular policies and/or politicians and/or ideology, etc., thus substituting his own values and priorities for ours, presuming that his are superior.
2slugs
“Tea Party crazies ”
Thank goodness we have them. Otherwise, Odrama and his liberal kooks would already have us at 23% debt/gdp and rising.
Regarding tipping points. One thing the data does not capture is the trigger. Recent experience is that recession and the associated drop in tax revenue and increase in spending pushed countries over the edge. Are there other triggers throughout history?
“Could this 180 reflect an honest analytical evolution/shift/revalation of some kind on his part, one he has never explained? Or is it more likely (ok, spoiler alert, it IS far more likely) that back then, or now, or at both times the views he expresses are the result of bias and/or dishonesty to support the economic policies and/or political party/president he thinks would be better for the nation (or at least for much of the nation)?”
Deficits at full employment are much worse than deficits when there is a massive output gap and much higher levels of unemployment.
If this were really about the “debt threat”TM the fixes would be obvious, get expenditures for war and heathcare costs/yr of life expectancy in line with other first world nations.
At those levels we could even afford the Bush era tax rates.
BTW current fed. debt service as %gdp is at 30yr low.
This “crisis”TM is all about dismantling the New Deal.
Any talk of “unforseen triggers” in an ominous way would have to include deflation and unemployment as well as “DEBT THREAT”TM.
I feel like I’m being sold WMD/Iraq war in media again..this time it is “DEBT THREAT’ TM. Same sales techniques, anyone who doubts is a menace and “unserious”TM.
Gordon / Brooks:
Agreed! Krugman is definitely more of a political pundit than an economist, now-a-days.
“Are there other triggers throughout history?”
@tj, yes, (1) when the differential growth of debt/GDP reaches a cumulative order of exponential magnitude (jubilee threshold) and (2) net interest to receipts reaches 20-25%. We have reached (1) for private AND public debt but not yet (2), with net interest/receipts at ~10% of federal receipts and ~15% after Social Security and Medicare receipts.
At the ongoing deficit/GDP of ~6% and the trend rates of growth of public debt, borrowing rates, and net interest/receipts, the US will reach the tipping point by no later than ’18, and quite possibly sooner were a recession to occur with the U rate rising the typical 50-100% and the deficit increasing to ~100% of receipts after Social Security and Medicare receipts.
Brent at $110+, i.e., Peak Oil, the Boomer demographic drag effects, private debt overhang, EXTREME wealth and income concentration to the top 1-10% reducing money velocity, little or no growth of bank lending, and emerging fiscal constraints from growing public debt will combine to keep a lid on trend nominal GDP at 2% or slower from ’07 and reduce post-’07 real GDP per capita further into negative territory.
I find a basic issue, and one easy test that you failed to do. If you are doing a regression, claiming to show a relationship of A to B, using dataset C(0:N), you don’t introduce fudge-factors for each data-point. If you were going to grade pitchers, quarterbacks, or shooting guards, you don’t introduce a ‘Tom Brady’ constant as opposed to the ‘Peyton Manning’ constant. You need to find a way to segment your data to remove the need for those constants.
Second, you should have had sufficient data to run your regression using data from 1990-2008, and then extrapolate the conditions of 2009-2012. If adding 20% more data is a requirement to make your analysis work, then it’s bad analysis. Why not show what your analysis would have predicted for 2009-2012? Why not make predictions for 2013? Why not bet your life’s savings on the predictions of your analysis?
Real people are suffering real hardship from the advice for countries to adopt ‘austerity now’. Consider the consequences for the countries adopting your advice, and perhaps revisit your analysis and run some back tests.
gman,
Re: Deficits at full employment are much worse than deficits when there is a massive output gap and much higher levels of unemployment.
Sure, I’m not dismissing the idea that the cost-benefit of deficits in a weak economy is much more favorable (due to Keynesian stimulus, and/or less “crowding out” effect, and/or to mitigate hardship in bad times), but the point is NOT that Krugman is saying the cost-benefit of deficits is much more favorable now, it’s that he has done almost a 180 on the likely adverse effects of large deficits and high debt/GDP on the economy in the mid/long-term. In 2003, when the fiscal outlook was not nearly as severe, he said that, with the Bush tax cuts, we were then on unalterable course toward disaster as baby boomers retired (starting several years after 2003) and debt/GDP grew, leading to an inevitable bond crisis with soaring interest rates that were going to cripple the economy. Now, with the baby boomers already retiring, a much higher debt/GDP, and a much worse outlook for debt/GDP, he calls everyone who is expresses half as much concern as he did (in 2003) hysterical, among other pejoratives.
It’s not about his view of the merits of deficits at one time under prior conditions vs. now under different conditions. It’s about a guy saying X is definitely going to lead to disaster because of Y and Z, and later, when Y and Z are much worse (making X much more conducive to disaster) his calling people hysterical (etc.) if they express even half the level of concern about X that he expressed back then.
And it’s about a guy taking each of those positions when each just happens to fit his policy/political/ideological preferences and objectives.
“Krugman is definitely more of a political pundit than an economist, now-a-days.”
@Anonymous, you will agree that:
War is the business of empire, and war is good business.
Business today is primarily rentier finance, i.e., deindustrialization and financialization.
War is politics by other means.
Politics is economics.
Ergo, economics is the politics of rentier empire, i.e., “globalization”, and war is the business of rentier empire.
Thus, when considering “economics”, irrespective of ideological conditioning or who holds the knife that butters one’s proverbial bread, one is required to concede that war, and gov’t enabling of the requisite resource allocation for the business of war, is indispensible to the politics/economics of empire.
Beyond that, imperial military machines require prodigious amounts of energy and other material resources and the means to secure, expropriate, process, and distribute the resources and protect shipping and overland routes in order to supply the vast military reach of Anglo-American empire.
The point is that one cannot discuss “economics” and policy without conceding that one must frame the discussion within the context of the requirements to supply and sustain the Anglo-American imperial war machine, which in turn is required to protect and defend “globalization” in the interest of the owners and creditors of the imperial corporate-state.
Krugman and his ilk can’t possibly discuss the current situation in this context or risk being laughed off the stage or pulpit, discredited, or having his tenure and endowment defunded. Thus, he and his peers are left to defend outdated or irrelevant “Progressive”, Neo-Keynesian policies that ignore the historical imperial precedents and requirements to sustain empire that do not align with the needs and interests of the majority 90% US working-class population.
Maybe it has lead to disaster now…we have less latitude for the type of fiscal policy necessary now because krugman was not heeded then.
“The time for austerity is in the middle of a boom-”
A wise man
GB, you are being hyperbolic @pks rare debt missives in that era.
This contemporary world of economics and finance is an application point by point of a feudal world. The ramifications are far reaching, money printing without assets backing called fiat money. The ability to survive ill suited monetary policies and foreign exchange policies, to discard sound principles of equilibrium which were honoured by the same medals and societal recognitions. To introduce perverted instruments of transactions free of cost, the derivatives that is.
Their induced effects is to build theories and demonstrations on wrong assumptions. Galileo was condemned for disturbing the official truth, we honour the dark side of applied theoretical sciences. It takes 89 pages to establish correlations on wrong premises and 6 lines address in a newspaper to detract them.
Around 660 trillions USD of derivatives are here to support actual interest rates, 1.5 trillion USD foreign exchange a day are here to explain financial transactions. The price of the financial papers is far exceeding knowledge and work as applied by the society in their daily output.
When suiting and fitting the curves, the time series are introduced .
Why not try time series between few contemporary currencies and the Ducat, the Spanish pesos, the Marie Thérèse Thaler, the Assignat, the German Reichmark and observe if cross-correlations are not valid.
Really « 1-percentage-point increase in U.S. debt-to-GDP was associated with a 3-to-4-basis-point increase in the 5-year-forward 10-year rate. «
Have we ever read that a cross relation between interest rates and derivatives was 0 before accepting above relationship?
When Libor and Euribor are the by products of interest rates manipulations, theories and demonstrations are leaving the practices as legal frauds with no influences on the real cost of interest rates, papers prices.
gman,
Re: Maybe it has lead to disaster now…we have less latitude for the type of fiscal policy necessary now because krugman was not heeded then.
Even if, arguendo, we take your above premise, what is your point? My point isn’t that he was wrong in 2003 (although the “disaster now” to which you refer is not the one he implied). My point is the insincerity (or blatant lack of objectivity) apparent in his massive shift of supposed view of the risk/cost of a given debt/GDP outlook, which shoots his credibility to hell.
Re: GB, you are being hyperbolic @pks rare debt missives in that era.
I’M being hyperbolic about what Krugman said?? How, but quoting and linking to Krugman sounding hyperbolic?
Re: “The time for austerity is in the middle of a boom-“
Apparently you are still confused over what my point is, even though I tried to steer you away from your confusion in my prior comment. (Yeah, at least arguably, deficits are generally more justifiable amid a weak economy than amid a boom. Not the point.)
I can’t understand why no one has commented on this. The econometrics is not OK. Having country fixed effects does not address the problem that Krugman and O’Brien highlight. Fixed effects only allows the baseline interest rate to be different for the various countries.
What is necesary is to include an interaction terms between Euro_Zone and the variable(s) of interest, allowing the beta to be different for the two different groups. Alternatively, the groups should be separated, and the regressions run separately.
This article by explains it better than I can here:
http://www.eurotrib.com/story/2013/3/9/12235/75575
Why pay so much attention to Krugman? He was a first class academic economist but follows the straight lib-dem party line otherwise. Just like Prof. Chinn.
History is littered with academics who were also Nazis or Communists. Talent in one area doesn’t preclude being a naive political idiot. Just like Krugman.
Liebig’s law of the minimum states that growth is controlled not by the total amount of resources available, but by the scarcest resource (limiting factor).
(From Wikipedia)
Steven Kopits and I have both opined that almost no one is taking into account a constrained oil supply model.
In my opinion, net oil importing OECD countries, like the US, are operating on the premise that high oil priced are a temporary phenomenon, and that if they can keep their “Wants” based economies going, via increased deficit spending, funded by real creditors and accommodative central bankers, soon we will once again have cheap and abundant supplies of crude oil.
I have been primarily focused on Global Net Exports of oil (GNE*), which are calculated in terms of total petroleum liquids, and Available Net Exports (GNE less Chindia’s Net Imports, or CNI). The following chart shows the 2002 to 2011 decline in the GNE/CNI ratio versus annual global (Brent) crude oil prices:
http://i1095.photobucket.com/albums/i475/westexas/Slide4-4_zps9a9c4aed.jpg
And the following chart shows the 2002 to 2011 decline in the GNE/CNI ratio versus the buildup in global public debt through 2011 (debt data from Ecnomist Magazine):
http://i1095.photobucket.com/albums/i475/westexas/Slide5-3_zps9a533a56.jpg
However, I have been taking a hard look at recent global crude + condensate production numbers, and I think that there is critical point that most of us, even the Peak Oilers, have been largely missing, which I will address in a subsequent post.
*GNE = Top 33 net exporters in 2005, BP + EIA data
For more info, search for: Export Capacity Index
Has there been a material post-2005 increase in global crude oil production (less than 45 degree API)?
For purposes of this discussion, crude oil = oil with less than 45 Degrees API, and not crude + condensate (C+C).
Regarding crude oil volumes and prices versus total liquids volumes, it’s as if you ask your butcher what the price of beef is, and he gives you the price of steak. If you ask him how much beef he has sold today, he gives you the number of pounds of steak (crude oil), roast (condensate), ground beef (natural gas liquids) and pink slime* (biofuels) that he has sold.
*Pink slime is a highly processed ground beef product, made from beef scraps and treated with ammonia
Condensate and NGL’s (natural gas liquids, e.g., ethane, propane and butane) are byproducts of natural gas (NG) production, from both gas wells and from associated gas sources (associated gas is NG produced along with oil). Condensate is basically natural gasoline, and it can easily be processed into finished gasoline, but it is not of much use in producing distillates, such as jet fuel and diesel.
Based on OPEC crude oil production data data and based on the high percentage of condensate production in many US shale plays, such as the Eagle Ford, I suspect that virtually all of the post-2005 increase in global hydrocarbon liquids production (crude + condensate + NGL’s) comes from natural gas sources (as condensate + NGL’s).
Even if we count condensate, note that global C+C production was only up by about 2% in 2012, versus 2005, a rate of increase of about 0.3%/year.
Here is the question the Cornucopians don’t want to address: Why has a doubling in global crude oil prices, from $55 in 2005 to $111 or more in both 2011 and 2012, almost certainly not resulted in a material increase in global crude oil production?
In any case, it would appear that most of the Eagle Ford Play in Texas can be more accurately characterized as a liquids rich gas play, rather than a crude oil play:
http://www.rbnenergy.com/dont-let-your-crude-oil-grow-up-to-be-condensate
“Last week (February 2013) EOG Resources told analysts that most Eagle Ford oil production should be classified as condensate rather than crude oil. They backed up their assertion with a chart of production quantity and API quality indicating 70 percent of production is condensate. Current forecasts indicate that translates to condensate production of over 500Mb/d (500,000 bpd) in South Texas during 2013. Today we examine the evidence that EOG presented.”
End Excerpt.
Preliminary EIA & RRC Texas oil production data for 2012:
EIA (Crude + condensate): 1.07 mbpd (million bpd)
RRC (Crude only): 0.94 mbpd
Estimated 2005 Texas condensate production: 0.13 mbpd
EIA & Texas RRC (Railroad Commission) Texas oil production data For 2005:
EIA (Crude + condensate): 2.0 mbpd
RRC (Crude only): 1.46 mbpd
If we round up the RRC number to 1.5 mbpd, to account for future upward revisions, we could easily looking at a 2012 Texas condensate production level of 500,000 bpd, so the estimated increase in annual Texas condensate production from 2005 to 2012 would be about 370,000 bpd, or 0.37 mbpd.
The EIA shows that global C+C production was 73.8 mbpd in 2005. I estimate it at 75.5 mbpd for 2012, an increase of 1.7 mbpd. So, just the seven year increase in Texas condensate production could account for 22% of the seven year, 2005 to 2012, increase in Global C+C production.
And OPEC 12 country data are showing basically (undulating) flat production (crude only). Here is a crude only OPEC 12 chart that Ron Patterson, a blogger, prepared:
http://i574.photobucket.com/albums/ss189/Darwinian1/OpecCrudeOnly-2_zps1497b989.jpg
I would argue that the post-2005 story has been one of higher prices causing (partial) substitution for crude oil (increased condensate, NGL’s and biofuels production), with probably no material increase in actual global crude oil production for seven straight years–even as the annual Brent price doubled from 2005 to 2011/2012.
Of course, there have been some efforts to substitute compressed and liquified natural gas for liquid fuels, but note that the EIA shows that US dry natural gas production has been virtually flat for almost two years. Given the very high decline rates that we see in shale gas wells, there is a serious question as to whether the industry will be able to fully reverse a NG production decline and bring NG production back to prior levels, given that the underlying decline rates from existing wells are so much higher now than at the start of the shale gas boom.
In my opinion increased production of the liquid substitutes only made an incremental difference, and not a material difference, in the global net export market, as the developing countries, led by China, consumed an increasing share of a declining post-2005 volume of Global Net Exports of oil.
So, in summary Brent doubled from $55 in 2005 to $111 in 2011 and $112 in 2012. In response, globally, regarding liquids production, we saw:
(1) Increased condensate, NGL’s and biofuels production, all less than ideal substitutes for crude oil.
(2) Probably flat crude oil production.
(3) Declining Global Net Exports (GNE), with developing countries consuming an increasing share of GNE.
Following are my “Gap Charts,” through 2011, showing where we would have been in 2011, at the 2002 to 2005 rates of increase, versus actual values in 2011. If we had global crude only data, I suspect that it might show a slight decline in 2011 versus 2005, with 2012 production probably approximately flat, relative to 2005.
“Gap” Charts (through 2011):
EIA Total Liquids, 14 mbpd Gap:
(2002-2005 rate of change: +3.1%/year; 2005-2011 rate of change: +0.5%year)
http://i1095.photobucket.com/albums/i475/westexas/EIA_total-liquids_02-11_gap-1.jpg
BP Total Petroleum Liquids., 13 mbpd Gap:
(2002-2005 rate of change: +3.0%/year; 2005-2011 rate of change: +0.4%year)
http://i1095.photobucket.com/albums/i475/westexas/BP-world-production_02-11_gap-1.jpg
EIA Crude + Condensate, 14.5 mbpd Gap:
(2002-2005 rate of change: +3.1%/year; 2005-2011 rate of change: +0.07%year)
http://i1095.photobucket.com/albums/i475/westexas/EIA-CC_02-11_gap-1.jpg
Global Net Exports, 18 mbpd Gap:
(2002-2005 rate of change: +5.3%/year; 2005-2011 rate of change: -0.7%year)
http://i1095.photobucket.com/albums/i475/westexas/GNE_02-11_Gap-1.jpg
Available Net Exports (GNE Less Chindia’s Net Imports), 17 mbpd Gap:
(2002-2005 rate of change: +4.4%/year; 2005-2011 rate of change: -2.2%year)
http://i1095.photobucket.com/albums/i475/westexas/ANE_02-11_gap-1.jpg
Bruce Carman:
I don’t agree with (or understand) most of what you said.
Krugman’s intra-industry trade theory was actual economics (which I believe is what he won the Nobel Prize for), his blog is 100% political commentary. I’m not saying he is a bad economist, I’m saying 100% of his public discourse should be taken no-more seriously than your average CNN political pundit.
Gordon Brooks nailed it.
Also, I can’t imagine how Menzie and James run the same blog.
Jim,
The issue is not whether the US real interest rate responds positively to the debt burden, it is whether there is a sharp nonlinearity at some point, as occurred for Greece. It is in that sense that the US will never be Greece. Brad DeLong has explained the reason for this quite clearly.
Also, your chart is misleading. Greece had a recent history of high inflation on the left and not on the right, so that the real ex ante interest rate spreads are very different on the left and the right.
Note that there is a labeling error in my crude oil post. Corrected data follow:
EIA & Texas RRC (Railroad Commission) Texas oil production data For 2005:
EIA (Crude + condensate): 1.07 mbpd (million bpd)
RRC (Crude only): 0.94 mbpd
Estimated 2005 Texas condensate production: 0.13 mbpd
Preliminary EIA & RRC Texas oil production data for 2012:
EIA (Crude + condensate): 2.0 mbpd
RRC (Crude only): 1.46 mbpd
If we round up the RRC number to 1.5 mbpd, to account for future upward revisions, we could easily looking at a 2012 Texas condensate production level of 500,000 bpd, so the estimated increase in annual Texas condensate production from 2005 to 2012 would be about 370,000 bpd, or 0.37 mbpd.
Lawrence Khoo at March 14, 2013 12:55 AM: You “can’t understand why no one has commented on this”? I guess that’s because you also did not understand that this was precisely the issue addressed in paragraphs 5, 6, and 7 of the original post. And I guess you also did not understand that the figure in the article you link to is in fact not a graph of any of the data used anywhere in our regression analysis.
Joe Gagnon at March 14, 2013 07:42 AM: Please note that Figures 4 and 5 in my previous post were created under the assumption that there is zero (not a small positive linear effect, but literally zero) effect of debt levels on interest rates. Please also explain this point to Brad.
CNBC is reporting that US natural gas (NG) gas production last week, I assume estimated dry NG production, was down 20% from the same time period a year ago, as inventories dropped by 146 BCF.
An excerpt from my post up the thread:
“Of course, there have been some efforts to substitute compressed and liquified natural gas for liquid fuels, but note that the EIA shows that US dry natural gas production has been virtually flat for almost two years. Given the very high decline rates that we see in shale gas wells, there is a serious question as to whether the industry will be able to fully reverse a NG production decline and bring NG production back to prior levels, given that the underlying decline rates from existing wells are so much higher now than at the start of the shale gas boom.”
My take-away from this blog post is this : you claim that showing a correlation between EU countries’ debt levels and bond interest rates has policy implications for the USA, in the sense that it demonstrates the importance of reducing debt.
This is a political assertion, and frankly laughable from an economics point of view. The above graph demonstrates that, as long as the market was under the illusion that the Euro was a normal currency, debt levels had no influence on interest rates for member countries. It was precisely when it became apparent that the ECB was unwilling to function as a true central bank, and was in fact prepared to let member countries’ economies go to the wall, that the correlation between debt levels and interest rates becomes apparent.
The policy takeaway from the ongoing failure of the euro is this : if you want interest rates to correlate with debt levels, then kneecap your central bank. The Fed has made it abundantly clear that it will find creative ways to print money, as much and as long as necessary. If it were to signal that it was no longer willing to accommodate debt-based stimulus, then buying treasuries would suddenly become dangerous. And the interest rates would soar. Wouldn’t that be nice?
I just replayed the NG comment on CNBC. She definitely said production was down 20% year over year, along with the decline in storage year over year. It’s at the 10:37 AM Central Time mark on CNBC. I haven’t been able to find any confirmation anywhere else, but there has been no correction on CNBC so far. Seems like a huge year over year decline though.
To be clear : In the dataset used for the paper, there is a tipping point for bond interest rates. That tipping point is the one marked “Lehman bankruptcy” in the graph above. The reason for that tipping point is well-understood : it is the point when the market realises that the ECB has no clothes. It is disingenuous to claim that it was caused by the tripping of some magical debt-to-GDP ratio.
Krugman and O’brien’s point still stands : using Eurozone countries in the study as if they were similar to other advanced economies leads to no useful conclusions for those countries who are able to borrow in their own currencies. The Eurozone countries having effectively become “developing” nations in that respect.
A couple more questions/comments:
1. How does your model account for the widely varying rates for the PIIGS nations?i
2. What advice would you have given Spain & Ireland in 2007? They did not have high debt levels, and had very small deficits.
3. Why do you use an integral of one variable (debt = integral(deficits)), but not of the current account? A nation could have had years of cash coming in, and had it slow, so that the integral would be large, but the 5 yr average would not be out of the ordinary.
4. What is the predictive power of your model if you remove debt and only use current accounts? What if you include private debt/savings? Ireland’s public debt situation is largely a function of its bank bailout (as you note). The increased debts of its banks would not have shown up in your model, but put Ireland at risk.
5. Why not extend the sample data to before 2000, and test on other debt/currency crises? If there is useful information in this analysis, it should show through by seeing predictive analysis in the past – you must be careful to only use training data from prior to your testing period – can’t use 2000 data to predict a crisis in the 90’s.
@Alistair Connor
Well said.
Regarding the natural gas report, it looks like someone at CNBC confused the percentage decline in storage year over year, down about 20%, with the production change (which was basically flat).
Gordon / Brooks I understand that you’re all excited to think that you caught Krugman in a whopper of an inconsistency, but I’m afraid all you’ve done is demonstrate your inability to follow the arguments. First, Krugman has not only admitted that he was wrong in 2003, but he insists on publicizing this admission. So as a “gotcha” moment this is pretty lame. The reason Krugman was wrong in 2003 is because he assumed that higher deficits would “crowd out” private sector investment and increase interest rates. What he forgot about was the old Hicks IS-LM liquidity trap, which describes today’s situation. But we won’t always be in a liquidity trap.
My reading of JDH’s paper is that he is not talking about higher interest rates due to crowding out, although sooner or later that will probably come to pass as well. What JDH is talking about has to do with the possible box that the Fed might find itself in which could lead to investors demanding a higher risk premium to hedge against the possibility of surprise inflation. I’m not a mindreader, but I don’t think Krugman disagrees that this could be a real risk down the line. Krugman’s beef seems to be whether or not existing econometric models are up to the job of being able to predict a tipping point in general, and for countries with their own currency in particular, and for a country that owns the world’s reserve currency especially.
A lot of this also depends on your theory of how inflation gets propagated througout the economy. At one extreme are economists who insist that inflation is all about excess aggregate demand and if there’s more money in the system than there is aggregate demand for that money, then the money just hides under a mattress. The other extreme genuflects to MV=PT and turns towards the Hyde Park region of Chicago five times every day.
What I find most interesting about JDH’s paper is that it tries to describe a way in which investors might expect surprise inflation even in the absence of actual inflation as a result of a perception that the Fed’s back is against the wall. I’m less convinced about the econometric model that tries to predict a tipping point. I’m pretty sure that there eventually there will be a tipping point, but the data are so noisy and the time series so thin, and the country differences so disparate that it would be a Herculean effort to try and sort it out with what is afterall a fairly naive model. All kinds of problems…panel unit roots, practical impossibility of testing for different slopes, volatility shift versus volatility clustering, yada, yada, yada. I’m not an economist, so if it were up to me I’d have given up on the whole project, called it bad habit and then poured myself a cold one.
2slugbaits,
Just because someone comes up with some explanation (and again, I’d like to see what he actually said, so please provide at least one link) doesn’t mean an allegation such as mine has necessarily been invalidated. The explanation may not be sufficient, and suspicion still may reasonably remain, considering all key factors — factors relating both in terms of economics (does the nature and magnitude related to the explanation suffice?) and other factors, including some related to common sense/judgment (we are all too familiar with how politicians who have flipped positions on issues come up with an explanation that, on paper, could explain the flip, but when they go from passionate supposed conviction and certainty at one extreme when that is politically convenient to the opposite extreme when THAT is politically convenient, we are reasonably suspicious). And by the way, seems odd that someone at Krugman’s level simply “forgot about the old Hicks IS-LM liquidity trap.”
As for “crowding out”, yes, of course, as I’ve noted previously, there is more risk/degree of that in a stronger economy than in a weaker one, but why would he assume back then that devastating crowding out would eventually occur, yet feel so confident now (amid much higher debt/GDP and much worse outlook, and without, I assume, a basis for feeling certain the economy will stay weak forever) that one would have be “hysterical” to worry about eventual crowding out even over the mid/long-term (e.g., 10 years out)?
I searched for his admission and explanation (since you provided no link) and it’s this:
[In 2003] the Bushies were pushing permanent tax cuts that had nothing to do with economic stimulus, and did so at a time of war with no offsetting spending cuts (and then pushed through an unfunded expansion of Medicare too). This struck me at the time as banana-republic behavior, and still does.
However, I wrongly believed that markets would look at it the same way, and that they would lose faith in American governance, driving up interest rates on our debt. Instead, bond investors discounted the politics, and acted as if they believed that America would eventually pull itself together and start behaving responsibly. The jury’s still out on that, but clearly my short-run prediction proved wrong. http://krugman.blogs.nytimes.com/2010/09/01/mistakes/
So he’s saying he was wrong because he thoughts the bond market would react — amid war, tax cuts and Medicare expansion — based on the perception that we had become a banana republic, which it didn’t. But first of all, why wouldn’t that apply to our current (much worse) medium/long-term outlook, particularly at whatever point the economy becomes stronger? Secondly, that 2010 (supposed) explanation, which de-emphasizes the aging population other than referring to Medicare Part D, doesn’t even seem to fit well with his 2003 piece, which emphasized the aging population as the key factor, which, combined with the aforementioned deficit-increasing policies, made a bond crisis inevitable — an aging population factor that is now more severe due to baby boomers having started to retire.
In the 2003 piece he wrote:
That may sound alarmist: right now the deficit, while huge in absolute terms, is only 2 — make that 3, O.K., maybe 4 — percent of G.D.P. But that misses the point ”Think of the federal government as a gigantic insurance company (with a sideline business in national defense and homeland security), which does its accounting on a cash basis, only counting premiums and payouts as they go in and out the door. An insurance company with cash accounting . . . is an accident waiting to happen.” So says the Treasury under secretary Peter Fisher; his point is that because of the future liabilities of Social Security and Medicare, the true budget picture is much worse than the conventional deficit numbers suggest.
Of course, Mr. Fisher isn’t allowed to draw the obvious implication: that his boss’s push for big permanent tax cuts is completely crazy. But the conclusion is inescapable. Without the Bush tax cuts, it would have been difficult to cope with the fiscal implications of an aging population. With those tax cuts, the task is simply impossible. The accident — the fiscal train wreck — is already under way.
Krugman’s 2010 explanation seems inadequate on its face, but even more so considering the alignment at each time with his policy and party preferences.
Well, the Krugman zombies are certainly out in force, judging from the many absurd comments.
First, JDH and his co-authors present 90 pages of argument and evidence to support their point. Then, Krugman, in his usual drive-by-shooting economic analysis, completely dismisses the work as “obviously flawed.” His evidence? Some regressions run by a magazine journalist, an argument from De Grauwe that Krugman treats like Holy Scripture, and a cheap shot against one of the authors about an interest rate forecast. That’s it. No argument, no evidence, nothing. He just moves on to his next target while his zombies start prowling.
Meanwhile, JDH presents a careful and methodical refutation. He shows the journalist’s regression is misguided while honestly acknowledging the limitations of the analysis. He shows that not being able to issue debt in your own currency with your own central bank doesn’t matter for his argument. And he provides some further arguments to boot.
And what does JDH get from the zombies? Do the they directly address his points? No–he gets mindless repetition of Krugman’s arguments, irrelevant points, and demands for even more evidence. And of course silence from Krugman.
JDH has provided more than enough evidence. Why doesn’t Krugman provide some evidence for once? His only real argument is the De Grauwe view that financial markets have inordinate power to drive states in a monetary union into default. What’s the evidence for that? States and municipalities are in a monetary union in the U.S. Do we see that? What about local government borrowers in European states? Do we see that? Some of us would like to see some evidence.
No serious economist would dismiss the work of eminent fellow economists in a national newspaper as “obviously flawed” without a solid consensus about the evidence backing him up. But Krugman is not a serious economist. Paul Krugman is Rachel Maddow with a Nobel Prize.
Why did Spain’s bond yields fall considerably in late 2011? The idea that confidence in a nations bonds can trigger a spike in interest rates is one that happens in a fundamentally different way in a country with its own currency than one without. With an active central bank, the confidence issue is moot – there is a buyer of last resort.
There are key problems to the Euro monetary union, ones that are making things worse for the PIIGS countries. First it lowered their rates during the early 00’s, second it took away their ability to devalue to lower relative wages.
States and local gov’s don’t run up debts like nations can. There is much more migration between Georgia and Florida than between Spain and France. State & local gov’s are pseudo back-stopped by their sovereigns.
The interest rate forecast is relevant…because this paper is in reality an interest rate forecast! Someone being so wrong should be somewhat relevant to the discussion.
This is also not the first analysis of its type. The ‘reduce deficits to restore confidence in your nation’s debt’ medicine has been prescribed a lot. Look at the results.
The authors use a small data-set, and ignore a known difference between data points. They also fail to show how their model would have predicted the current trouble that Spain and Ireland are in – both were not near any ‘danger zone’ in 2007.
Gordon / Brooks Krugman explained how and why he changed his mind in this recent (July 2012) interview with Business Insider:
http://www.businessinsider.com/paul-krugman-on-the-deficit-2012-7
You can watch the video, but the bottom line is that he thinks countries with their own currency have a lot more room to maneuver. He makes a point of saying that they do not have an infinite amount of maneuver room, but much more than he thought in 2003. And if you’ve read his book on Depression Economics, then you know that he doesn’t believe bond vigilantes are a threat as long as we’re in a liquidity trap:
…shouldn’t we be concerned about the burden of debt we’re leaving for the future? The answer is a definite “yes, but.” Yes, debt we run up now, as we try to cope with the aftermath of a financial crisis, will place a burden on the future. But the burden is a lot smaller than the heated rhetoric of deficit hawks suggests.
The key thing to bear in mind is that the $5 trillion or so in debt that America has run up since the crisis began, and the trillions more we will surely run up before this economic siege is over, won’t have to be paid off quickly, or indeed at all. In fact, it won’t be a tragedy if the debt actually continues to grow as long as it grows more slowly than the sum of inflation and economic growth.
The Return of Depression Economics, page 108.
Note the last sentence…sounds a lot like JDH’s formulation. If the debt grows greater than than the interest rate, then we’re screwed. As he explains in the book, the key insight comes from Japan’s experience of a liquidity trap and his re-examination of the IS-LM model. One of the results of that model is that there is no such thing as “immaculate inflation” (a term he borrowed from Karl Smith), which means an increase in the money supply without a matching and permanent increase in aggregate demand cannot by itself lead to inflation. That does not mean inflation from the Fed monetizing the debt isn’t a real risk; but it does mean it’s not a risk as long as the economy is stuck at a low output equilibrium due to weak aggregate demand. It’s in that sense that countries with their own currency enjoy some limited immunity from bond vigilantes.
And his most recent reference to his changing his mind is here:
http://krugman.blogs.nytimes.com/2013/03/01/disastrous-predictions-and-predictable-disasters/
Correction. The quote on page 108 was from End This Depression Now. It’s what I get for using the e-book version rather than the hardcopy.
@2slugbaits
Making an additional point, not disagreeing with your position.
It is not enough to have your own currency. The debt also has to be denominated in the same currency. Obviously not a problem for the US, which has the additional advantage of having the USD as the world’s reserve currency.
A few thoughts:
1) Long-term rates will never force a crisis, because the Treasury chooses the rate structure. It could roll over maturing 10-years by issuing 2-week notes if it wished. Offering longer terms is a service to investors, not a requirement.
2) The short-term rate is a policy variable, not a market outcome. It is set by the Fed.
3) Inflation depends flow variables (aggregate demand and supply), not stock variables like the money supply, at least not directly. A change in stock variable e.g. household net worth based on housing prices, can result in a change in aggregate demand by changing the desire to save (to spend less than they earn), thus shifting the AD and/or AS curves.
4) The danger, then, is inflation and a degradation of the Fed’s ability to fight it, as follows:
a) The debt becomes very large.
b) Interest payments on the debt represent a flow of “free money” to the private sector — income available to spend boosting AD, without accompanying production to provide a matching increase in AS. Thus this flow of money is potentially inflationary.
c) The Fed might try to fight inflation by raising rates, but the effectiveness would be blunted because the higher rates also increase the flow of interest payments. Painfully high interest rates (stunting investment and thus future growth) might be required; or in an extreme case, the Fed might completely lose the ability to restrain inflation.
5) At this point there would be two policy options: Raise taxes or cut spending, decreasing AD through fiscal policy. Or, let inflation run, effectively “taxing” wealth-holders and reducing the real value of the debt. The dollar would fall, improving the current account. And as the real value of the debt fell, and thus the purchasing power of the stream of interest payments, the Fed would regain traction to eventually tame that inflation.
Personally, if we ever find ourselves in a situation of high debt, inflation due to elevated AD, and a weakened or impotent Fed, I’d favor a mix of moderate inflation (keeping rates low) and fiscal tightening.
But that’s a long ways away at best, and fairly hypothetical. RIGHT NOW we should be running a substantially larger deficit to meet the private sector’s desire to save, invest in our future productivity, and restore full employment.
Rick Stryker I agree that Krugman’s short and rather dismissive blogpost had a certain “drive by” whiff about it. I think he owes his readers a better effort. But as I said before, Krugman is laser focused on the immediate aggregate demand problem because he doesn’t believe our political class is capable of nuanced academic arguments. If you say there is some risk of higher debt levels 15 years out, the usual suspects will hear that as an imminent debt crisis in the next 15 minutes.
he gets mindless repetition of Krugman’s arguments, irrelevant points, and demands for even more evidence.
Welcome to the world of applied econometrics. Look, I think JDH has done a pretty good job of squeezing out a lot of information from some pretty thin data, but that doesn’t mean the regressions are a slam dunk by any means. There are plenty of problems. It is possible that the slope for non-euro countries is different than it is for euro countries. There are studies that show panel unit roots in macroeconomic variables across OECD countries. And there are studies that show it’s a tricky business to try and correct for that problem while trying to maintain country specific fixed effects. The dimensions of the fixed effects panel data are geared towards short-run dynamics, but the relevant risk for the US is longer range. We don’t know the out-of-sample properties of the regression. Seven parameters out of twelve time series observations and a 0.82 R-square can smell like overfitting to the sample. I could go on. Like I said, it’s a good effort, but there are plenty of legitimate questions. And even the authors don’t entirely believe their model predictions are likely to happen:
We should emphasize that we are not presenting these alternative simulations as more realistic forecasts of what the U.S. experience will actually be. In a country like the United States, the debt premium presumably would arise from inflation fears rather than concerns about outright default. And if we are talking about a higher inflation rate, forecasts of nominal GDP should be adjusted as well. Instead, we view these simulations as illustrating the extent to which the path implied by baseline CBO projections could quickly become much more difficult to manage than some policy-makers may be assuming
I think that is a much more cautious statement than pointing to a regression that says we’re doomed at the magic fill-in-the-blank threshold.
Dear Professor Hamilton,
I’ve read through your paper twice now, and fearful of straining regard, can say little.
I am afraid you have let yourself be taken for a ride, though.
Let me remind you that Dr. Mishkin campaigned for years for interest payments on reserves, based on ECB practice. Letting go of that conceit would pretty much eliminate the projected wind-down fed losses. And, 6 percent on required capital? Can’t amount to much. But, on balance, not inconsiderable.
Only twice, and not thrice, but so far no “tipping point.” More like a mild exponential, so why the extremist verbiage?
Finally, what is really disappointing, you express mild caveats about cointegration, without bothering to use the word; but it has no power in your argument, beyond speculations that there are only “limited” traders resources available for sovereigns trading, might be, but un-sourced.
OK you aren’t the “inventor;” but no mention of regime change? Does the global economy in depression act the same way as during normal times? That’s the central Keynesian point; and I must say that your paper has made absolutely no acknowledgement of it.
Asking rhetorical questions about whether Krugman or O’Brian see any downside to debt is the same thing as saying, “they don’t give a damn.” That’s tea party talk, and totally misrepresents at least Krugman’s often-repeated sentiments.
So please, don’t go cranky on us like this again.
Jim, thanks for the thoughtful post.
Having a look at your paper, I see you offer a very aggressive conclusion in the second sentence of the abstract when you “conclude that countries with debt above 80% of GDP and persistent current-account deficits are vulnerable to a rapid fiscal
deterioration as a result of these tipping-point dynamics.” In this post, by contrast, you seem to have backed off this strong assertion and retreated to the impossible to quibble-with notion that it’s not true that debt never matters. I suggest you update the abstract of your paper in the next round.
Given the history of Japan, UK, and the US, I don’t think there is any way your original conclusion follows, and so I can see how some commenters might be openly derisive. Later in the abstract, warning that the budget need be fixed now now now to avoid having the Fed run capital losses later is complete nonsense. It’s not the Fed’s goal to make paper profits, and nor should it be seen as goal which may trump stabilization policy.
I’d have to agree with commenters that including country fixed effects in no way deals with your problem. Some may think the way you try to pass this off in the post sounds slick.
You write in this post that “We comment in detail in our paper, for example, on the fact that countries like the U.S. and Japan seem to have a significantly higher debt tolerance (in the form of big negative values for αi) than other countries.” While you are at it you could throw in the UK and Canada. In that case, you’ll want to change the strong conclusion in your abstract to — “some countries, primarily those that effectively borrow in foreign currencies (such as the Euro) run into trouble with debt over 80%…”
In Figure 3.3 (&3.9), you need to include the ECB interest rate hikes, so your readers can see what caused the interest rate spikes. You mention nothing about the ECB’s tight monetary stance which is an oversight.
I wouldn’t bother citing Hoshi & Ito. They don’t even know what a liquidity trap is.
On that note — a search for liquidity trap got no hits in your paper. Embarassing. Nice thorough discussion of what is special about Japan’s situation the past 20 years.
A regression of 20 countries for 12 years? What is this, the 1984 QJE? Can you really not marshal any more data than that?
“printing money does not generate any magical resources with which to resolve a real fiscal shortfall” Oh, but it can though, can’t it. Read Milton Freidman on the Fed’s role in the depression. Looser monetary policy would have put more people to work, thereby lessening the fiscal burden on government. This is econ 101…
OK, we all know there are counterexamples to the 80% doctrine — the US, the UK, Japan, planet Canada. Are there any examples of countries that borrow in their own currencies who suddenly run into problems as debt hits 80% of GDP? I didn’t see any mentioned in this column…
Searching your paper, I got no hits for the word “cluster”. Did someone forget to cluster their standard errors? (What is this, the 1984 QJE?) In fact, this application calls for multi-way clustering — on both years and country — Cameron, Gelback, Miller.
My favorite line of the post was “It is true that you won’t find statistical confirmation of the nonlinearities reported in equation (3) if you confine yourself to recent experience in the major non-eurozone advanced economies.”
Indeed.
Winstongator,
Right on cue, you do exactly what I complained that the Krugman zombies always do. First, you just repeat back Krugman’s argument about monetary union. But what Krugman, and not you or any of his other zombies needs to do, is provide real evidence. Rather than basing his arguments on De Grauwe’s speculation about what the market is thinking, Krugman should review and discuss real market analysis. Krugman should for example review sovereign credit ratings put on these countries by the major credit ratings and the analysis that supports them. When he does that, he’d need to explain how it’s irrelevant that these reports focus exactly on the issues that JDH and his co-authors are raising. Rather than just claim that EMU states can’t get support from their central bank, he should review the European Financial Stability Facility (EFSF) and the European Stability Mechanism (ESM). He should explain how his view that the central bank can’t support member states in a monetary union is consistent with the fact that states in Europe can now request an ESM precautionary credit line that will activate the Outright Monetary Transactions program (OTM) of the ECB, allowing the central bank to buy sovereign debt of member states to provide support in a potential liquidity crisis.
Maybe you or other zombies will rush in to try to fill in the blanks for Krugman, but the point is that Krugman should have done this himself. However, given how complex the subject of sovereign credit analysis is, Krugman’s readers would have immediately seen that Krugman is being idiotic to dismiss the JDH et al study as “obviously flawed.” In fact, an honest review by Krugman would have shown how on target this study actually is. That’s why Krugman doesn’t do it.
You can’t read JDH’s analysis and conclude it’s an interest rate forecast. It’s clearly not. It’s rather an analysis of what could happen if the fiscal problems are not addressed. Krugman’s interest rate forecast jibe was a cheap shot, and not one that Krugman should be making considering his own forecasting record.
You end your comment doing the other thing I complained about: you demand more evidence from JDH that their model predict Spain and Ireland. But you demand nothing additional from Krugman. But JDH has already provided a ton of evidence. It’s Krugman’s turn now. As it stands, JDH has wiped the floor with Krugman. Why should JDH bother with any more?
2slugbaits,
To say that JDH and his co-authors have done a “pretty good job” strikes me as faint praise that damns. Of course, no econometric analysis is a slam dunk, but they’ve done a very credible analysis in my view. What makes their argument compelling is that they are not just relying on the econometrics but supplementing with case studies and projections based on realistic economic forecasts. So, to me it’s impressive and persuasive work overall.
One thing I find disheartening about all this is that Krugman’s drive-by also distracted attention from the analysis that JDH and his co-authors did on the interplay between unsustainable fiscal policy and monetary policy. This is an important topic that I hope JDH will turn to in future posts.
Rick Stryker distracted attention from the analysis that JDH and his co-authors did on the interplay between unsustainable fiscal policy and monetary policy.
There’s a fair amount of truth in that; however, I suspect that a lot of that distraction was invited by some overselling in the abstract. The attention grabbing headline was the 80% figure, and by publishing an op-ed in the WSJ they (perhaps inadvertently) concentrated attention on their regression results, which I believe is the weakest part of the paper. I suspect that an op-ed written for a FT audience would have gotten a better reception because the editors would have insisted on greater emphasis on the monetary policy aspects of the paper.
Krugman should for example review sovereign credit ratings put on these countries by the major credit ratings and the analysis that supports them.
Well, actually Krugman has done that…in fact, he’s done quite a bit of that. For example, he likes to remind folks that the markets responded to the downgrading of the US credit rating by increasing the price of US Treasuries.
Part of the problem is that right now most of the US debt problem is more of a political problem than it is an economic problem. Even in the worst case scenario the interest burden from the debt is well within the country’s economic ability to afford. Total government spending would still be far less than it is for many western European countries today. But politically it would be a hard sell because a lot of Americans have an almost preternatural aversion to taxes. And a lot of the European countries that are in trouble also share that aversion to paying taxes. Greece and Italy are good examples. Setting revenues to 23% of GDP fixes the problem. And since most of the opposition to higher tax rates seems to be coming from a dying demographic, I’m confident that eventually we’ll get there. Look, even Texas will be a blue state by 2022.
@Richard Stryker
You wrote: “But JDH has already provided a ton of evidence.”
Quick — name one piece of non-Euro evidence on the 80% doctrine. You said they provided tons of evidence. Let’s see it.
Counterexamples to the 80% doctrine from Krugman came thick and fast. There’s the US. There’s the UK. There’s Canada. There’s Japan. Four out of the 7 non-Euro countries in the JDH sample directly contradict the notion that going over 80% of debt-to-GDP makes any difference whatsoever. Which is why Hamilton himself in this post turned tail and ran away from this thesis, and now makes a very sensible argument that debt may matter in some situations.
Thorstein Veblen,
You are just repeating Krugman’s argument yet again. JDH wrote the above post to refute Krugman’s argument that Euro country evidence is illegitimate. But you act like that never happened.
It’ now Krugman’s turn. You should go on his blog and tell him to answer if he can. Krugman seems to think he’s above arguing for his position, as if he’s the pope of economics and we’re all waiting for the white smoke to waft above Princeton University, signalling that he’s spoken ex cathedra on some policy issue. So far, Krugman’s contribution has been a cheap shot on an interest rate forecast, an endorsement of a journalist’s regression, and a pointer to De Grauwe. When Krugman writes a 90 page paper and a long involved blog post supporting his view, JDH and Krugman will be even.
@ Menzie No you miss my point. The only thing we can conclude from the longer dated US bond market is that there is a structural shortage of assets and one very large buyer out there. It says nothing about peoples expectations of future interests, only that today there is a structural shortage that comes about via financial repression and that is all that matters.