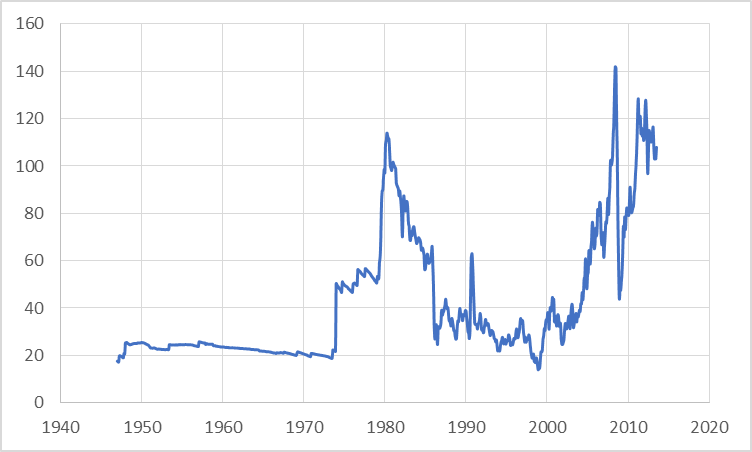
We’ve been seeing oil over $100 a barrel and gasoline above $3.40 a gallon for much of the last 3 years. Those prices would have shocked many Americans a few years ago, but have now become the new normal. What has changed and what hasn’t as a result?
|
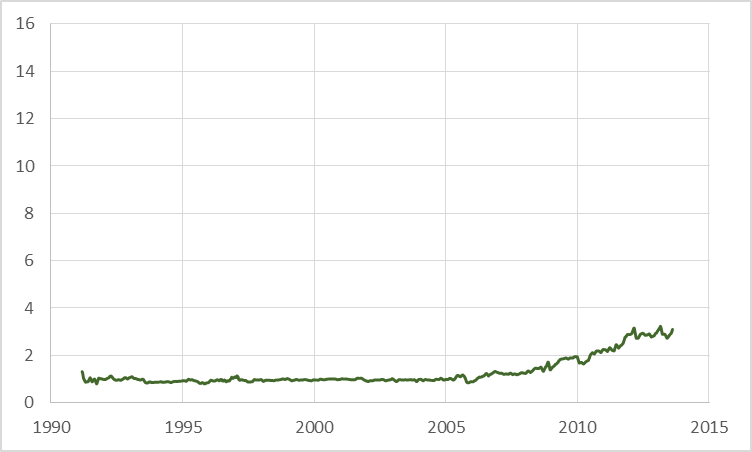
One effect of higher oil prices has been a surge in U.S. oil production coming from horizontal fracturing of shale and other tight formations. These methods would not have been profitable at the oil prices of 2004, and it’s not clear how long the new supplies will last. But for now they are making an important contribution to U.S. income and employment.

|
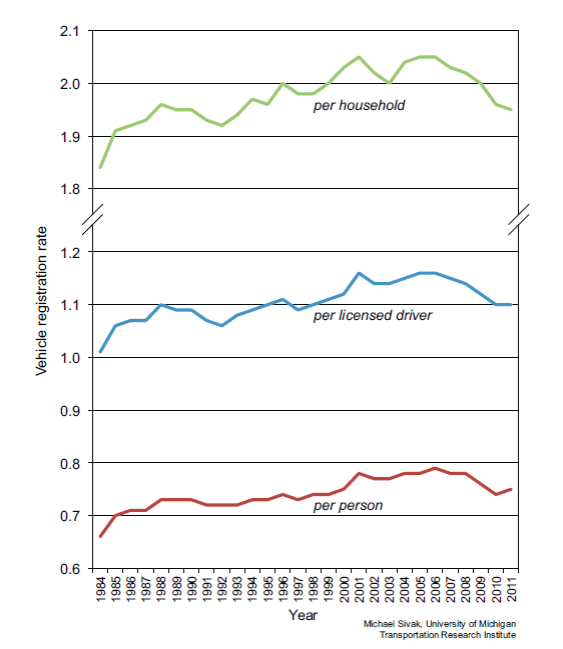
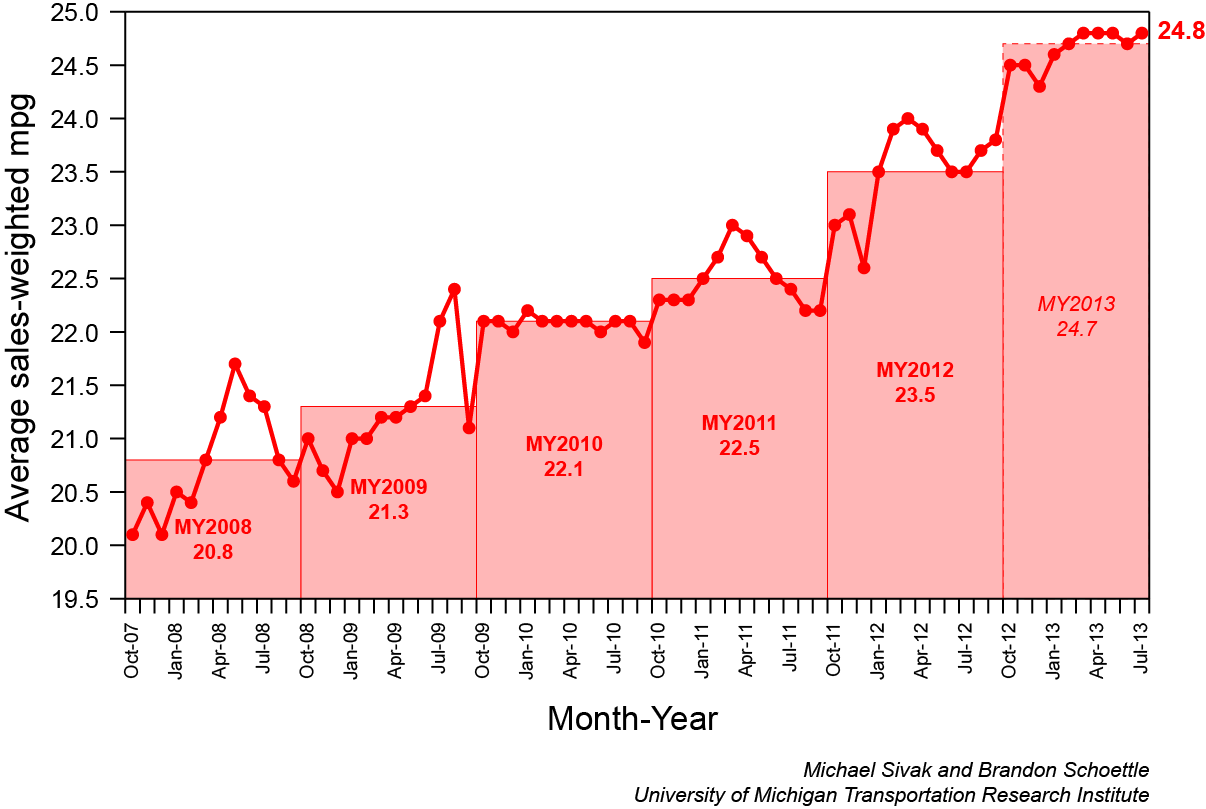
Higher prices have also led to significant changes in U.S. driving habits and the kinds of cars we buy.
|
|
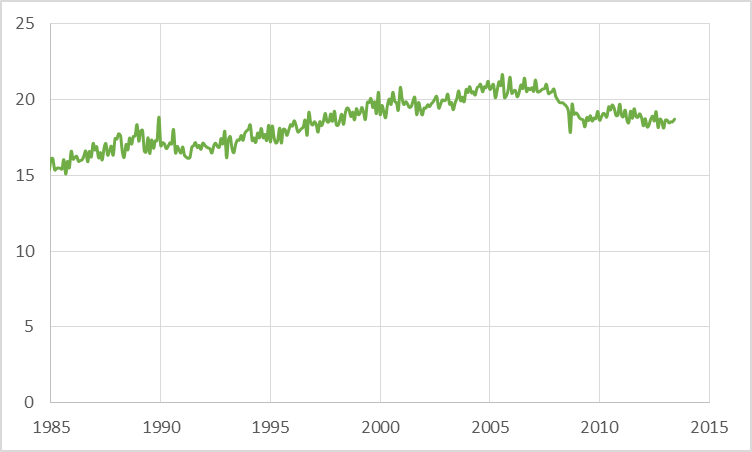
The result has been that U.S. petroleum consumption, which for years seemed like it could only go up, has been steadily declining.
|
Higher domestic production and lower American consumption have meant declining imports of crude oil and petroleum products– a reversal of another once seemingly inexorable trend.
|
The price differential between internationally traded crude oil and that produced in central North America gave U.S. refiners a competitive advantage to export refined petroleum products. The quantities are significant, but are still swamped by the volume of crude oil imports portrayed in the graph above.
|
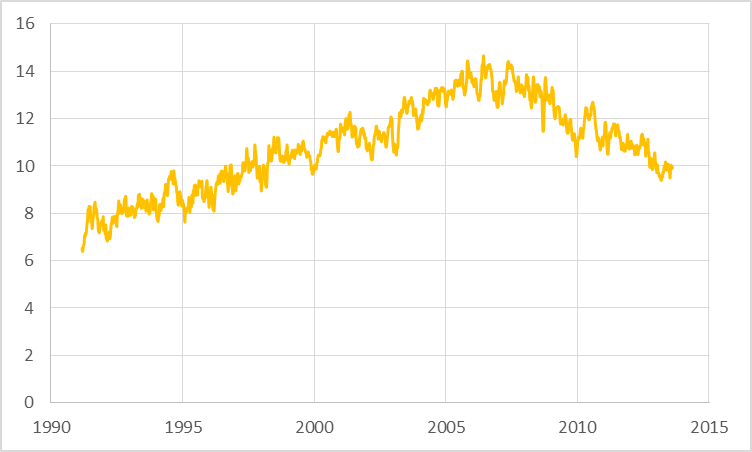
The economic burden of imported oil is represented not by the number of barrels, but instead by the real value of the resources we must surrender in order to obtain the oil. The dollar value of petroleum imports as a share of GDP has come down a little as a result of recent gains in production and conservation, but still remains significantly elevated relative to the levels of a decade ago.
|
In other words, despite impressive gains in production and conservation, the bill for oil imports remains a significant burden on the U.S. economy.
High oil prices have also lead to a surge in domestic production. (ie. more expensive transportation and packaging costs) This could easily be part of the BRIC slow down.
Very nice presentation — the last chart is particularly intriguing.
As a minor point, clearly the state of the economy plays an important role in determining oil imports, oil consumption and even vehicle registration (for instance, all of these series see dips in the early 1990s, the early 2000s and around 2008 coinciding with the last 3 recessions). Along the same lines, one has to wonder the extent to which the less-than-stellar recovery since 2009 has played a role in reducing oil imports, oil consumption and vehicle registration today?
As Kosta stated, will done indeed, Professor Hamilton…Professor Perry, has so aptly addressed this issue.
America is being “peak” efficient with the use of energy..This is one of the variables that the peakers never took into consideration.
The reduction or decline in per capital use is, if I may say so, rather astonishing…
Frankly, there was an enormous waste when it can to gasoline, in America…May I suggest inefficiency up to 10% of consumption…
There is still rood for improvements and more competition for the ICE, with perhaps Musk Motors leading the way…
Technology beats oil shortages is the message I see. But for some reason technology never soundly thrashes oil shortages, as if technology reaches victory over a near term battle, then decides to halt the march. That is, there is a second, longer term constraint we run up against, not related to energy.
To keep the Tejas black gold production gushing into ’18-’20 at the trend rate since ’09-’10, the price of crude will have to rise to $325-$500 and gasoline to $10-$11 with oil consumption to GDP at the trend rates of GDP and crude production and price rising from 4-5% today to $7-$11.
But there’s a non-linear log-limit cost constraint of crude to production at $100-$120, implying that extraction is peaking and will decline back to the ’10-’11 levels in the years ahead with contracting real GDP per capita and demand.
And oil persistently above $75-$80 constrains BRIC countries’ growth as client-states for the Anglo-American imperial “trade” (offshoring) regime, i.e., “globalization”.
Sorry, gents, we can’t have profitable extraction of domestic crude at $85-$100+ AND grow real GDP per capita.
Without commenting on the merits of the U.S. Ethanol laws/policies, ethanol has something to do with falling imports of crude, as well.
Also, unfortunately, some of the reduction in motor gasoline consumption directly relates to massive under-employment, especially among those under 25, as well as lower wages among the employed.
Thank you for providing the UMTRI graph–it seems hard to maintain that CAFE is not having an effect beyond the consumer response to gasoline price signaling in the face of that evidence.
It might also be useful to graph the ratio between VMT and motor gasoline consumed to roughly approximate existing fleet mpg. This might reveal consumers switching miles driven to higher mileage vehicles within the existing fleet.
It is also worth remembering that ~55% of U.S. petroleum consumption is not motor gasoline.
Thanks. One small oddity: Sivak’s data implies a more rapid increase in the size of the average household in 2008-11 than I’m aware of.
I see Paul Krugman “Bankers, Workers….” recently posted on how the employment ratio plunged a few years back and has stayed down, referring to: “A catastrophic collapse in employment, with only a modest recovery even after all these years.”
I’m not sure where you covered this in your post, maybe under the heading of ‘impressive gains in conservation’
Well, we all re-fi’d under 4%, so that saves us a few hundred bucks a month which is more than enough to offset the price of gasoline.
And the savers and the elderly who were robbed by ZIRP don’t drive much anyway.
Tom: Speculating, It may depend on the definition of household. Some definitions include everyone under the same roof (including multi-family households as one), others may be closer to “tax unit” definitions. Doubling-up is a real and still increasing phenomenon in the post-bust world.
Hans – A reduction in consumption automatically drives an increase in efficiency. If we consumed only one barrel of oil in the US, I can assure you the marginal utility of that barrel would be extremely high. But declining consumption is not a sign of prosperity, only efficiency.
As for 10% waste: The relative level of consumption for various items depends on their relative costs. For example, in Manhattan, the ratio of people to land is very high, thus apartments are small and very expensive. Should we then conclude that people living in the suburbs are somehow wasting space? Or take water: In Nevada, water is scarce and is priced and treated accordingly. On the east coast, we have plenty of water, and correspondingly “waste” much of it. We allow rain runoff, for example, to flow uncaptured into streams and rivers. And we water our lawns freely.
Finally, in poor countries, they will save on items inconceivable in the developed world. For example, in 1991, a colleague of mine needed a root canal in Prague. He received it, but it was unbelievably painful. He noted this to the dentist and asked, “Wasn’t there something you could have done about the pain?” The dentist replied, “Of course. I could have given you a pain killer.” “Well, why didn’t you do that?” cried my colleague. “It would have been very expensive,” replied the dentist, “It would have cost three dollars.”
True story.
Now, my colleague did not waste any pain killer, but he suffered a lot of pain. So, one man’s waste is another man’s necessity. It’s all a matter of perspective.
Nice post James. Do you enjoy your Harvard visit ?
Reducing Oil Consumption: The Opportunities
Bena had argued that US oil consumption could be further reduced with intelligent and pro-active policies by the government. I thought to take a look at where oil is being consumed, and how consumption has developed over time by way of framing the debate. The findings follow.
Uses of Oil
Our friends at the EIA (God bless the EIA!) track oil consumption by use in the MER. The categories include Industry, Transport, Power, Residential and Commercial.
Industry and Transport together account for 95% of all oil consumption. Thus, Power, Residential and Commercial are incidental uses. Let’s dispense with these first.
Oil use in power is down by 82% since 2005, but it’s only 0.5% of total consumption. No great opportunities to reduce consumption here.
Commercial use represents only 1.8% of total oil consumption. LPG use is up 11.4% for this category since 2005. LPG historically arises 60/40 from natural gas production and as a result of oil refining, respectively. If we exclude LPG, commercial use of oil has fallen by 22% since 2005.
Residential use represents 3.3% of oil consumption, with LPG alone representing 2% of US oil consumption. The remainder is kerosene (almost nothing in volume) and heating oil. Heating oil use is down 41% since 2005 and 48% since its peak in 2003. Heating oil represents only 1.3% of oil consumption today. There are no great opportunities to save volumes here. Residential LPG consumption is about flat.
Now for the big categories.
Industry
Industry represents almost a quarter of US oil consumption. Industry oil use is down 12% since 2005, but if we exclude LPG, which is up 15% (are we seeing a theme here?), crude oil-based consumption is down 23%. Crude oil-based consumption for industry is only 15% of total US oil consumption. Since 2005, oil-based (non-LPG) consumption has been falling at a 3.7% pace, which is impressive. But much of that fall came with the recession, and in fact, consumption has stabilized over the last four years. How much more can we save here?
Transportation
Transportation is the primary user of oil, representing 71% of total US oil consumption. Within this, vehicles represent about 62% of oil consumption, aviation just under 8%, and marine, about 1.4%.
Aviation fuel demand has fallen by nearly 17% since 2005, and commercial airline departures are off by a similar number for the period. There may be additional opportunities for efficiency gains here, primarily by use of larger aircraft (ie, efficiency per passenger mile, not per aircraft). Aviation fuel use has largely stagnated since 2009, but a yearly 2% efficiency improvement looks feasible. This would amount to 25,000 barrels per year, or 0.1% of US oil consumption.
This leaves vehicle use, representing 61.5% of oil consumption. Oil consumption has declined less here than in any other category, down only 4.5% for both diesel and gasoline. This is much much lower than the adjustment seen in either industry, aviation, power, residential or commercial. It speaks both to the central importance of transportation and the lack of ready fuel substitutes.
For those who wish to trumpet the glories of CAFE standards, they have in fact lead to an improvement in vehicle efficiency at a much slower pace than unregulated sectors.
Most importantly, the efficiency improvement in oil consumption (gasoline, diesel, lubricants and LPG) for vehicles is only 0.9% and 1.1% annually for the periods 2007-2012 and 2010-2012 respectively. In other words, US vehicle fuel efficiency is improving at a glacial pace. At the same time, this represents an appreciable contribution of 125 kbpd / year, about enough to offset half of US oil consumption declines, but not nearly enough to insure growth in mobility in the future.
In short, our opportunities to save on oil are limited. Expect a continued struggle to improve efficiency, accompanied by more weak economic growth.
Kopits: I’m very familiar with the EIA data. I draw different conclusions. BTW, for the benefit of others here, you may not want to conflate personal auto use with heavy trucks. The market dynamics are quite different.
I’m all ears, Bena.
Steven, excellent points, as always. See the Seneca effect/cliff and Jevons paradox to support your conclusions (and Jeffrey’s) and, regrettably, suggest that we can expect a power law, log-linear decline in domestic energy consumption per capita, and thus an acceleration of the contraction of real GDP per capita over the next 7-10 to 20-30 years.
Economists are so far behind the Peak Oil and power law, log-linear decline/collapse curve to be quite literally, and sadly, irrelevant, and even dangerous should one presume that economists have a clue.
Note that monthly Brent prices exceeded $100 for six months in 2008, while monthly Brent prices have exceeded $100 for 30 of the past 31 months.
My premise is that net oil importing OECD countries like the US have been coping with high oil prices by trying to keep their “Wants” based economies going, via deficit spending, with said deficit spending financed by real creditors and by accommodative central bankers.
The following chart shows total global public debt versus the decline in the GNE/CNI ratio* from 2002 to 2011. For 2012, total global public debt rose to $49 trillion, as the GNE/CNI ratio fell to 5.0:
http://i1095.photobucket.com/albums/i475/westexas/Slide5-3_zps9a533a56.jpg
What I define as Available Net Exports (ANE, or GNE less Chindia’s Net Imports, CNI) fell from 41 mbpd (million barrels per day) in 2005 to 35 mbpd in 2012.
Or, total global public debt divided by ANE rose from $660,000 per bpd of ANE in 2005 to $1,400,000 per bpd of ANE.
*GNE = Combined net exports from top 33 net exporters in 2005, CNI = China + India’s Net Imports. At a GNE/CNI ratio of 1.0, China & India alone would theoretically consume 100% of GNE. Debt data from Economist Magazine.
To my point about driving:
http://www.cnbc.com/id/100997323
Not enough attention has been given to the impact of electronic media on oil consumption. The US Post Office is going bankrupt because of the reduction in traffic, but consider how much fuel is being saved by lowered transportation costs. Innovation is ways not often imagined works wonders.
Ricardo –
While I can appreciate the role of electronic media on oil consumption, the thrust of the data suggests that people are driving less because they can’t afford it. Remember, highway diesel and gasoline consumption have fallen less–far less–than oil consumption for aviation, commercial, industrial, power and residential uses. It would be fairer to assert that US consumers have fallen out of love with heating their homes–at least using oil.
Michael Sivak at UMTRI has a piece out on driver’s licenses and economic activity. UMTRI conducted a survey on the matter. Of more than 600 respondents aged 18-39 without a driver’s license, 46% were unemployed, and only 19% were employed full time (the balance being students and part-time employees).
Now, as Michael points out, you can argue the causation in either direction, but the statistic is still staggering. If you don’t have a driver’s license, and you’re an adult less than 40 years old, then there’s a greater than 80% chance you don’t have a full time job.
That’s simply stunning, no matter how you slice it.
The opportunities to save on oil are virtually endless in the personal transportation category.
We increased our weighted family fleet average mpg by over 40% without decreasing vehicle utility. There’s real utility and imaginary utility. Imaginary utility includes things like excess towing capacity beyond any load that one is likely to pull; all wheel drive where two is adequate; carrying huge volumes of air when 2 person capacity is adequate; etc.
And by decreasing real utility slightly, much bigger savings are possible. The US could cut personal auto oil consumption in half with little effort and little loss in real utility.
Would people drive more if costs per mile were lower? Some would. Most simply don’t have more time to throw away. Self driving cars could change that, but self driving cars could also primarily be the VW XL1, dispatched as an individual needs it, given most car trips are undertaken by individuals.
Steve Kopits
I think you are understating the fleet effect?
The US has c. 150m automobiles (the ‘car park’) with average life of c. 13 years.
Sales peaked at around 15m automobiles in 2007 (ie before oil prices really took off) and feel to about half that at the bottom. They won’t get back to the 15m pa level before 2026-2018 period.
So in total, less than 10% of US passenger vehicle fleet is turned over in any given year.
Thus, an improvement of say 20% of new car mileage compared to the existing car park, would at most lower consumption the next year by 2% (10% cars x 20% better mileage). Assuming there is no net new demand for vehicles of course (ie that all new vehicles replace vehicles which are scrapped).
In short, there’s lots to go for on vehicle fuel economy, even before hybrids become more widespread (hybrid municipal buses are much more common than they were), let alone electric vehicles.
I’d be interested to hear your thoughts on how projected electric vehicle sales will influence this situation over the next 10 years or so. I understand that cars aren’t the only petroleum burning machines in the US, but are their sales projected to impact oil demand and import prices over the next decade.
Small uses: (Residential, Commercial, and Power)
Residential petroleum consumption peaked in 1972. It now accounts for only a few percent of total U.S. consumption as Kopits notes. This does not mean that the current pace of decline is unhampered by market failures or that near total elimination is not possible. Instead my contention is that eliminating the 5% or so of petroleum still used in residential and commercial sectors is desirable and possible to accelerate markedly. If the goal is a 2.5% reduction per year (per Kopits), then elimination of a sector using 5% of oil means 2 years of progress without touching other sectors. If the reason someone is still using oil for space heat is that they are a renter, that is an agency problem easily addressed by government. If the reason is a lack of credit, again there is scope for intervention. Heat pumps (to be preferred), modern natural gas furnaces, and wood stoves can replace almost all of this usage economically. I include LPG, since LPG is the 3rd most common auto fuel internationally.
Power consumption of petroleum (in this country) is almost gone, a big chunk of it is on small or remote islands or villages. Hawaii is probably the biggest example. Examples nearer to JDH would be Catalina (fuel cost for 4,000 population spread across 5 million customer mainland ratebase) and San Nicolas (military). Examples nearer Kopits would include Block Island (costs passed to tourists). There is scope here for federal funding of grid and renewable infrastructure (geothermal plus inter-island grid in Hawaii for instance).
The key factor in these sectors is that most of this remaining consumption would already be gone if there were not market failures or obstacles which we have incentives to remove given the positive externalities for other consumers of reducing consumption in these sectors.
Industrial use:
About 3/4ths (6 of 8 quads) of industrial petroleum usage is in the refining sector–use less finished petroleum product and energy consumption in this sector goes down.
Of course, we will likely continue to import crude, use our refinery capacity, our cheap electricity, our cheap natural gas, and our port infrastructure to export refined products for profit. I don’t count petroleum consumption for export.
In short, our opportunities to save on oil are limited. Expect a continued struggle to improve efficiency, accompanied by more weak economic growth.
– Steven Kopits
So how do all the fuel-efficient rich countries do it?
Included in Kopits’ 62% of oil consumption by “vehicles” are 25,000 sweet rides which got less than 1 mpg despite CAFE rules. These ‘vehicles’ are known as locomotives, and despite using more fuel per vehicle, they use only about 1% of oil to move more freight (in ton miles) than moved via road using dramatically more fuel (~15%). The remaining 45% or so is used for light-duty vehicles, although much of this is by fleet vehicles not owned by individuals.
This raises several issues for fuel consumption. One is that it is much more fuel efficient to move goods by rail than by rubber-tire. Shifting freight from road to rail saves fuel. This is not a major focus of my short-term ideas, but over time, road freight should not continue to be advantaged over rail. In fact, substantial public investment in rail trackage and signaling is appropriate in the context of other transportation modes relationships with government*.
Another issue is that although we can’t ignore the 45% of oil used by the passenger auto fleet, we need to evaluate other markets as well.
For instance, many countries are electrifying their freight rail system. One quicker, less capital intensive stopgap to reduce petroleum usage is to convert our relatively small locomotive fleet to LNG, eliminating about 1% of oil consumption.
Another is improving fuel efficiency in the road freight sector. One major market failure in the industry is that trailers are typically not owned by those paying the fuel bill to haul them. Aerodynamic and rolling resistance improvements which can be added to trailers can easily and cheaply increase fuel efficiency by 20%. Again we have an agency problem. To overcome this, CA requires (CARB) implementation of a certain subset of these improvements. EPA Smartway works with the industry to increase voluntary implementation of such improvements. However, more than 2.5% reduction in oil consumption could be made simply by retrofitting existing tractors and trailers with cheap proven technology. Over the next 5 model years (2014-2018), medium and heavy trucks will also see consistent improvement due to new efficiency standards for manufacturers (20% for OTR tractors). Unlike light vehicles, the majority of fuel consumption in the heavy sector occurs among the previous 3 model years. This may have the effect of improving road freight cost structure. We should take advantage of this market shift to more fully offset road damage costs via increased fuel tax on truck diesel, to avoid driving a need for additional road maintenance and construction subsidies.
CAFE is only one leg of strategies to reduce oil consumption in the light auto sector. Part of the reason recent effects have been muted is that CAFE standards were rolled back and then flat for 20 years (so the differential between new and scrapped vehicles is smaller than had mpg been climbing consistently). Nonetheless if CAFE is allowed to stay in place for an extended period we will see marked improvement in fleet averages. CAFE is not sufficient in and of itself to outrun shrinking fuel availability, so other policy is required.
*Where there are other substantial benefits, it may be worth examining current incentives. For instance, the Alameda corridor is currently underutilized, choking the 710 freeway with trucks, primarily because it is cheaper to leave the West Coast’s largest port complex via road than rail due to fees on use of the corridor (which should apply to all containers leaving the port, not just those which use the corridor).
There is not enough oil for the entire world to adopt western style usage rates. As the rest of the world slowly industrializes, they import oil that the west used to import. Misallocating scarce oil into Keynesian pyramids diverts finite oil away from useful projects. These trends coincide with the switch from inexpensive conventional wells to resource intensive unconventional oil.
Models developed using 1930s data will not work in this new environment.
Steven Kopits,
I do not at all disagree with your post, but it does not disagree with me either.
There have been huge innovations in industry because of electronics and electronic media. It is obvious that our world is moving more and more toward electronic solutions from automobiles to factories. For example government can mandate emission standards all day by locking people up or fining their resources away, but one device that allows the caputure of emissions to be utilized and sold benefits everyone with no downside.
A declining economy will always lower energy consumption, but a thriving economy will always create more efficient use of energy.
Steven,
I should have added that developed nations always use energy more efficiently than developing nations. They are still learning how to become efficient above a subsistence economy.
Westslope –
In short, our opportunities to save on oil are limited. Expect a continued struggle to improve efficiency, accompanied by more weak economic growth. – Steven Kopits
So how do all the fuel-efficient rich countries do it?
Increasing oil consumption efficiency is usually achieved through recession. That’s how they are adjusting in Japan and Europe. In Europe, for example, GDP change was -0.9% in 2012, and oil consumption was down, -4.0%. Thus, oil efficiency was rising at a 3.1% pace. You’ll recall my earlier statement that sustained efficiency gains are projected at 2.5-3.5% per annum, and probably not more than 3%. Well, this fits the pattern, although greater efficiency gains have been seen during recessionary periods, and US efficiency increased at a 3.7% pace during the 2010-2012 period without a recession (bearing in mind that the period was coincident with the shale oil and gas boom).
In any event, at issue here is how fast an economy can adapt without material impact on GDP growth. That is, at what point is oil consumption not a binding constraint on economic activity, and what policies do we need or are available to mitigate a chronic shortage of oil while maintaining a desirable growth rate?
That’s what we’re trying to determine.
On locomotives and energy use.
As Bena notes, there are about 25,000 freight locomotives in the US stock. These are long-lived assets with an average age of about 25 years. About 1,000 new locomotives enter the fleet each year (a 4% replacement rate).
These locomotives move goods about 1.5 trillion ton miles per year. It takes a barrel of oil equivalent to move a ton of goods approximately 20,000 miles. (Pretty impressive, actually.) Do the math, and freight locomotives in the US use about 200,000 barrels of oil per day. This is about the same as residential heating oil use.
If we assume a 4% replacement rate, and just for fun, a 50% efficiency improvement per new locomotive, then the total savings per year comes out at 4,000 barrels per day, or about 0.02% of US oil consumption.
That’s negligible.
Gentlemen: As an investor I specialize in overseas oil exploration companies. Naturally commodity price risk looms, always.
Part of my investment strategy is based on the assumption that the USA will not increase excise taxes on gasoline, diesel and similar. If I read this blog and the comments accurately and use it as another indicator of US political mood, there is zero appetite for tax increases and continued faith in emission standards and similar.
Elsewhere, generous US financial and military support for the Israeli settlement of Jerusalem and the West Bank continues unabated. Although many in the US (including senior US military officers) may believe that Israel is the friendly outpost helping to maintain secure, cheap energy for American citizens, I would argue the opposite. US support for a greater and more glorious Israel has helped prop up oil prices and US oil import bills.
The USA slept walk through the Oslo Peace Accords and reacted to the Sept. 11th attacks by turning a small tactical loss into a major victory for Al Quaeda and similar anti-American terrorists. That helps up prop the near permanent risk premium in the price of oil.
All that to say: 10^3 THANKS! The status quo suits me as an oil exploration investor just fine.
As an investor I am also heartened by the CAN’T DO attitude I read in these posts as well as what appears to be a complete lack of knowledge and understanding of how colonial and imperial violence destroyed the former European powers. Couple that with the popular view that war is somehow good for the economy and my favourite market play will continue to shine for years.
Bena- On Residential and Commercial Use
Residential petroleum consumption peaked in 1972. It now accounts for only a few percent of total U.S. consumption as Kopits notes. This does not mean that the current pace of decline is unhampered by market failures or that near total elimination is not possible. Instead my contention is that eliminating the 5% or so of petroleum still used in residential and commercial sectors is desirable and possible to accelerate markedly. If the goal is a 2.5% reduction per year (per Kopits), then elimination of a sector using 5% of oil means 2 years of progress without touching other sectors.
This is not a serious response. All commercial and residential consumption gone in two years? Great on paper. How do you propose we do that specifically? LPG represents half of residential and commercial use. I presume we want to leave this? Diesel represent almost as much. If we want to eliminate that, then the options are LPG or nat gas. But in many cases, converting won’t be worth the effort, and nat gas lines are unavailable locally.
We can see in the data a pace of reduction in residential oil (heating oil) consumption at around 8% per year–which is impressive, but represents an efficiency improvement of only 20 kbpd/year.
Nor do I see any evidence of a market failure. Residential oil consumption is down by nearly half in ten years. That speaks to a pretty high pace of adaptation, given the fixed assets involved.
If you want to be convincing on this, you’re going to have to dig deeper.
On industrial use:
About 3/4ths (6 of 8 quads) of industrial petroleum usage is in the refining sector–use less finished petroleum product and energy consumption in this sector goes down.
Of course, we will likely continue to import crude, use our refinery capacity, our cheap electricity, our cheap natural gas, and our port infrastructure to export refined products for profit. I don’t count petroleum consumption for export.
So what is this industrial petroleum usage thing? Well, one website tells us this: “42 gallons per barrel makes about 19½ gallons of gasoline, 9 gallons of fuel oil, 4 gallons of jet fuel, and 11 gallons of other products, including lubricants, kerosene, asphalt, and petrochemical feedstocks to make plastics. That adds up to more than 42 gallons because of something called ‘refinery gain’ – the processing and chemical changes increase the volume.”
Now, Bena, you are admonishing us to “use less finished petroleum product”. So you’re suggesting we make do with less of the stuff in bold. And indeed, asphalt production is down nearly 40% compared to 2005. (So much for “shovel ready”!)
But that’s not efficiency. It’s just reduced industrial production and a commensurate reduction in GDP.
Is that your suggestion?
Fuel economy:
According to UMTRI, new vehicle fuel economy increased at a 3.9% pace in 2010-2012 period.
Calculating on-road gasoline, diesel, LPG and lubricants use divided by VMT yields a 1.1% efficiency improvement pace for the same period.
It’s difficult to compare these numbers, but it is certainly possible oil use per VMT will improve at an increasing pace as more efficient vehicles cascade through the fleet year after year.
For now, however, increased VMT efficiency is not sufficient to offset anticipated oil consumption declines. To date, oil consumption reduction have been carrying primarily by industrial, commercial and aviation sectors, in part with lower levels of activity and in part with substitution towards LPG.
Neither US VMT nor US airline departures have improved in the last two years. Thus, the current pace of oil consumption decline is about enough to maintain current levels of mobility, but to date, not enough to increase them.
If we wish to return mobility growth to long term trends, the rate of fuel substitution or efficiency growth will have to increase, and increase materially.
Steven Kopits, when does Gas-to-liquids become viable in the US? If the issue is the lack of transportation fuel, and we have an abundance of natural gas, at some point it has to make financial sense, right?
GTL results in primarily a diesel fuel, and a premium one at that (zero sulfur, better than ULSD).
Kopits: On locomotives, I did not suggest that improved locomotive efficiency or fleet turnover would result in appreciable gains. Diesel conversion to LNG and/or dual fuel is not technically difficult or expensive. Existing locomotives could perform the same work, while using much less diesel. Of course, as I pointed out, this mode is already quite efficient and much larger gains are available by evening the playing field with other modes.
Kopits: Your characterization of my comments on industrial use is inaccurate. Refining, like power plant operation, is an energy conversion process using substantial primary energy at less than 100 percent conversion efficiency. I simply note that assuming this energy consumption is allocated to end use, reducing energy consumption in end use sectors (as we are discussing) automatically reduces energy consumption in the refinery sector. About half of refinery sector petroleum use is for heat per the 2010 MECS. Note also that I did not include the chemical sector or plastics production, the 6 quads of refinery sector petroleum usage is about 1/3rd of industrial sector energy usage despite being about 3/4ths of refinery energy. It is probable this does include some final products lumped under refinery use that I have not bothered to separate out.
Buzzcut: We already have a significant “GTL” sector, it’s called ethanol … Snark.
Buzz –
GTL is interesting, but has it’s own challenges.
Shell’s Pearl GTL plant in Qatar is the biggest in the world, with a nameplate capacity of 250 kbpd, producing primarily a very high quality diesel which Shell calls GTL Gasoil. So far so good.
Now, the Pearl plant will draw a volume of nat gas equal to 2% of US consumption. It’s really a monster, and cost $20 billion at that.
In addition, there are significant conversion losses in GTL production. Shell estimates these at 25%, but other observers put it as high as 40-50%. Thus, LNG (liquefied natural gas) immediately becomes a competitor. For example, I estimated the payback period for the Pearl plant at three years (!). But Shell was criticized nonetheless because it could have sold the output as LNG at oil prices without GTL’s conversion losses. So the issues is whether to produce GTL or LNG, and in many cases, LNG has a better economic proposition.
Finally, GTL does not solve the high cost of transportation fuel. From the consumer’s point of view, it’s just diesel and will be priced as diesel. At the same time, 250 kbpd is really not that much in global terms, so you need a lot of these plants to move the oil price needle materially. Thus, it doesn’t really lower the price of diesel in the marketplace very much.
What the US consumer needs–particularly at the lower income levels–is an affordable transportation fuel. CNG, at $2 / gge (gallon of gasoline equivalent), fits the bill better.
I envision inreasing vehicle efficiency as changing the slope of the demand curve for oil, making it relatively more elastic. The demand curve itself, indexed to GDP, shifts with income growth. Increasing supply due to new technlogy – supply curve shift…but, as petroleum product export prices are set in the world market (eg diesel) the US enjoys the benefit of a reduction in the trade deficit and of course the returns to domestic producers, but consumers have yet to benefit as the world price remains elevated for many reasons. As a result elevated gasoline prices continue to impinge upon consumer budgets and retard US economic growth. The shale gas phenomenon broke the link – perhaps only temporarily – between natural gas prices and oil prices that was tight the previous two decades. The fall in heating-related expenditures (and in some places power) helped save us from a double dip. But for “shale” to save us, we need the substitution of natural gas for oil products to cause oil prices to drop. I can’t say that will happen anytime soon.
Again, Bena, you’re not talking about any sort of specific efficiency gain. All your saying is that if we consume less of anything made from oil, then we’ll consume less oil.
Well, OK. That must have taken a long time to figure out.
Steve Kopits, if CNG is $2 a gallon, and if GTL Diesel is 50% more expensive, conceivably GTL would be roughly $3 a gallon.
It seems to me that it makes a lot more sense to use the diesel engines that are already on the road, the diesel supply infrastructure that already exists, etc. etc. etc.
Although, I do see that spending $20 billion for 250k bpd of diesel is kind of insane.
US Refiners are STARTING to make the investments they need to skew their refineries towards diesel (installing hydrocrackers, essentially). In some sense, hydrocrackers also turn natural gas (used to make hydrogen) into diesel, ultimately.
Buzz,
As Steven has already noted, diesel will sell for the market price + taxes, regardless of the cost of producing the product.
Note that the overall refined petroleum product price in the US much more closely followed the Brent crude price, even in areas where refiners were buying lower cost WTI crude, which was reflected in the huge WTI crack spreads that we saw not too long ago (until the Brent/WTI price gap narrowed considerably).
In any case, as of 2012, the US was still a net natural gas importer, and a recent Citi Research report puts the decline rate for existing US natural gas production at about 24%/year, which implies that the industry has to replace about 100% of current natural gas production in four years, in order to maintain current production–or we would need to put on line the productive equivalent of about 30 Barnett Shale plays over the next 10 years, in order to maintain current natural gas production.
Kopits:If in your 9/5 comment you are referring to my 9/3 1043hrs comment, I think it is worth pointing out that, in contrast to other sectors, most industrial petroleum use is not actually end-use, but amounts (in effect) to conversion losses which (roughly) scale with production, as well as byproduct which is readily replaced in various end uses. If we use less gasoline, we automatically burn less still gas and have less pet coke to get rid of.* Instead of writing off this sector as irreducible, “how much more can we save” it is clear that even without attempting to directly save in this sector it will multiply savings acheived in other areas.
*With the exception, as noted, of products produced for export which, I trust, neither you nor I see as a direct problem for our economy
I’m not super confident in the VMT. That data is more adjusted than GISS temp data. It’s good for some things, here I think it’s good. For a broad trend over a time where conditions are stable, but it makes assumption that will create bias when people don’t behave as expected.
I still think there was a decrease in efficiency prior to the crisis. The initial data showed it clearly until it was adjusted for the report in 2010 (IIRC).
Bena –
It’s not clear to me that what you’re saying is actually true.
First, consider that diesel and gasoline consumption is down only 4.5% since 2005.
By contrast, in industrial use,
– asphalt is down by 38%
– kerosene is down by 97%
– lubricants are down 20%
– residual fuel oil is down 21%
So the notion that end use of diesel, gasoline and jet fuel will dictate other refining products is not supported by the consumption data.
Nor is it supported by the refinery data.
For the three years ended 2011, compared to the same period a decade earlier, refineries are reporting, as a share of total product
– LPG production down 6%
– jet fuel down 6%
– kerosene down 77%
– distillates (diesel) up 22%
– residual fuel down 22%
– pet coke up 11%
– asphalt down 26%
– and refinery gain up 16%
I thought you stated you were well acquainted with this data. Are you? You’ve not put a quantitative argument on the table yet.
In any event, you’re still arguing only for lower consumption and lower GDP. If we consume less diesel and gasoline, then we consume less oil, and we’re better off.
Well, no, we’re not.
Buzzcut: GTL economics are as influenced by the difficulty of achieving the ULSD spec as they are by gas pricing. As Steve Kopits notes, the capital cost is very high for GTL relative to output and as a result depreciation, maintenance and return on capital become significant determinants of cost. As for losses in terms of energy, in graduate school I had an industrial practitioner give a rule of thumb that stated GTL projects will burn about 1/3 of their natural gas input for heating value.
All that being said, Sasol certainly thinks that there is room for a GTL megaproject in the US – though almost certainly not on the scale of Pearl GTL in Qatar.
http://www.sasol.com/innovation/us-mega-projects
Of note and under the radar: RINs policy. RINs were put in place to force compliance with renewable fuels quotas. The effective results of soaring RINs prices are to create import tariffs on refined products and to incentivize refiners to export refined products. To fill legislated quotas we are subsidizing non US gasoline and diesel consumers. As such, the US consumer sees no benefit from the surge in domestic crude oil production. Simple answer: export duties on refined products. Chances of that: close to 0.