The growing likelihood [1], [2], [3] of U.S. military action in Syria seems to be one factor in the recent sharp rise in oil prices.
|
That is not because Syria itself is an important producer of oil. According to the EIA, the country was producing less than 370,000 barrels a day in 2010, only half a percent of the world total. Civil unrest and an embargo had brought that down to 71,000 barrels this May, less than 1/10 of 1% of global supplies. If that goes too, nobody but the Syrians will miss it.
|
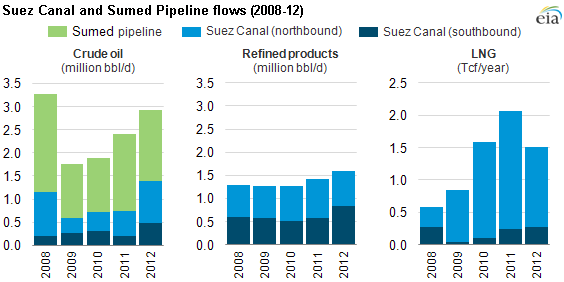
But the question is whether conflict would be neatly contained within Syria. The situation in Egypt, for example, remains quite unstable, and it would not take much to set it off again. Egypt is also a relatively minor contributor to world production. But the Suez Canal and Sumed pipeline together transport 3.5 million barrels of crude petroleum and refined petroleum products through Egypt each day, a number that would correspond to 4.6% of total world field production of crude oil.
|
Libya may already be tipping. The country was producing 1.9% of the world’s total last May, but worker strikes and armed occupation of energy infrastructure may have brought the country’s recent production down to 250,000 b/d.
| Country | Oil production | % of world total |
|---|---|---|
| Syria | 71 | 0.1% |
| Egypt | 541 | 0.7% |
| Libya | 1,420 | 1.9% |
| Algeria | 1,510 | 2.0% |
| Nigeria | 2,400 | 3.1% |
| Iraq | 3,075 | 4.0% |
| Iran | 3,200 | 4.2% |
| Saudi Arabia | 9,640 | 12.6% |
| Sumed and Suez | 3,510 | 4.6% |
| Strait of Hormuz | 17,000 | 22.3% |
Iraq currently produces 4% of the world total and is a critical component in many analysts’ scenario for how world production will continue to grow over the next few years (some of which extra production had been intended for planned pipelines through Syria). But dozens of people are being killed daily in Iraq’s violence. And the Wall Street Journal reported this information on Friday:
The U.S. has intercepted an order from Iran to militants in Iraq to attack the U.S. Embassy and other American interests in Baghdad in the event of a strike on Syria, officials said, amid an expanding array of reprisal threats across the region.
Saudi Arabia backs action against Assad, so the kingdom might try to increase production to offset losses from the above possibilities. But how much the kingdom is able to do, even if it is willing, is not clear. More importantly, Syria is part of a broader struggle between Saudi Arabia and Iran. If events were to lead to disruptions in either of those countries, the effects on oil markets would be quite dramatic.
To put these numbers in perspective, the table below summarizes the major geopolitical disruptions in oil-producing countries over the last 40 years. The Libyan disruptions two years ago took about 2% of world production offline, and were associated with a 20% increase in crude oil prices. The combined effects of strikes in Venezuela and the Second Persian Gulf War in 2002-2003 took away 4% of global production, and oil prices were up 35% at the highest point. Neither of those events were associated with significant downturns in the world economy.
| Event | Date | Lost output |
|---|---|---|
| OPEC embargo | Nov 1973 | 7.5% |
| Iranian revolution | Nov 1978 | 7% |
| Iran-Iraq War | Oct 1980 | 6% |
| Persian Gulf War I | Aug 1990 | 9% |
| Venezuela and Persian Gulf War II | Dec 2002 | 4% |
| Libyan revolution | Feb 2011 | 2% |
On the other hand, the first four events listed above took out 6-9% of world production. These were accompanied by oil price spikes of 50% or more, and each of these was followed by a global economic recession.
Of course, another possibility is that the world will become a safer, more stable place if the U.S. launches a few cruise missiles on Damascus.
Regarding President Obama’s upcoming address to the nation Tuesday night, regarding Syria, I wouldn’t be surprised to hear references to the failure of appeasement in the Thirties, prior to Germany invading Poland in 1939. Churchill said, after the Munich Agreement in 1938, “You were given the choice between war and dishonor. You chose dishonor and you will have war.” Russia (or more accurately the Soviet Union) had a mutual defense pact with Czechoslovakia, and they were disgusted with Great Britain and France over the Munich Agreement. The Soviet Union was only too happy to divide up Poland with Germany, in 1939. What if Great Britain, France and the Soviet Union had all jointly threatened war with Germany over Czechoslovakia?
On the other hand, following the assassination of Archduke Ferdinand by a Serbian nationalist in 1914, Austria-Hungary attacked Serbia, an ally of Russia, triggering the First World War–indirectly contributing to the Second World War. What if Austria-Hungary had not attacked Serbia?
Was it Mark Twain who said that history does not repeat, but it rhymes? I would think that a US attack on Syria, an ally of Russia, would be more similar to 1914 than to 1938.
Following is an excerpt from “The First World War,” by John Keegan:
The Libyan disruptions two years ago took about 2% of world production offline, and were associated with a 20% increase in crude oil prices…[this was not] associated with [a] significant downturn in the world economy.
I am not sure I am convinced by this characterization, based on OECD y-o-y quarterly SA GDP data.
The Euro zone averaged 2.3% growth in the three quarters to Q1 2011. Subsequently, quarterly GDP growth fell into secular decline, culminating in a six quarter recession from Q1 2012 to Q2 2013. I would say this is a material downturn, and the break in trend clearly started with the Arab Spring.
Japan also saw a virtual four quarter decline from Q1 2011 (0.04% growth) to Q1 2012 (0.05% growth), with two quarters of material decline in between. So we could also argue that Japan saw, for all practical purposes, a four quarter recession during this period.
US GDP growth was tracking Euro 17 GDP growth very closely, with the US growth rate only 0.06% above the Euro rate for the Q4 10 – Q3 11 period. You’ll recall that this period ended with the whole sequester debate.
After this point, however, US GDP growth diverged materially from the Euro 17, with a difference as much as 3.8%, and averaging 2.75% for the Q4 2011 to Q2 2013 period. This also coincided with the surge in US shale oil production (as well as increasing shale gas production, the rise of the Apple iPhone, continued progress by Google and the Facebook IPO).
So, I would argue that $125 Brent oil prices in Spring 2011 put the OECD countries into recession, a fate from which the US was spared only by surging shale oil production.
The Oil Drum blog is shutting down in a few days. My first guest post on The Oil Drum was the following, in January, 2006, more than seven years ago:
Hubbert Linearization Analysis of the Top Three Net Oil Exporters*
*At the time, Saudi Arabia, Russia, Norway, and Hubbert Linearization is a way to estimate recoverable reserves from a region, using the decline in the ratio of annual production to cumulative production versus cumulative production
http://www.theoildrum.com/story/2006/1/27/14471/5832
Excerpt:
From 2005 to 2012, here is what EIA data show for these three countries:
As expected Norway, continued to decline. Note that Norway’s ECI ratio (ratio of total petroleum liquids production to liquids consumption) fell from 13.7 in 2005 to 7.4 in 2012. Of course, at an ECI ratio of 1.0, net exports = zero.
Saudi annual production did decline, until they finally slightly exceeded the 2005 annual crude oil production rate in 2012, although their total petroleum liquids production exceeded their 2005 annual rate in 2011 and 2012. However, their net exports (total petroleum liquids) have been below their 2005 annual rate for seven straight years. Saudi Arabia’s ECI ratio fell from 5.7 in 2005 to 4.0 in 2012.
Russian production did show an inflection point in production in 2007, with a much slower rate of increase in production after 2007, but they have not yet declined. However, their net exports were flat in 2007 and 2012, with lower values in intervening years. Russia’s ECI ratio fell from 3.7 in 2007 to 3.3 in 2012.
In any case, the three countries’ combined net exports were 15.3 mbpd in 2002 and 18.6 mbpd in 2005, a 6.5%/year rate of increase (EIA). This is what we were seeing when I wrote the above brief article. At this rate of increase, their combined net exports in 2012 would have been in excess of 29 mbpd, versus the actual value of 17.5 mbpd, a decline relative to 2005, and a gap of about 12 mbpd between where they would have been at the 2002 to 2005 rate of increase in combined net exports and the actual value in 2012.
Note that the combined net exports from the (2005) Top 33 net exporters, what I define as Global Net Exports of oil (GNE) were increasing at 5.4%/year from 2002 to 2005, versus a slight decline from 2005 to 2012 (0.5%/year, EIA), and I estimate that post-2005 Global CNE (Cumulative Net Exports) may already be about 20% depleted. Following is a ink to an updated “Gap Chart,” through 2012, for Global Net Exports of oil:
http://i1095.photobucket.com/albums/i475/westexas/Slide1_zps3161a25b.jpg
And of course, through 2012, developing countries, led by China, consumed an increasing share of a declining post-2005 volume of GNE.
Continuing, and perhaps worsening, short term supply disruptions are certainly a possibility due to instability in the Middle East, but as noted above the dominant post-2005 pattern we have seen is that developed net oil importing countries like the US were gradually being shut out of the global market for exported oil, via price rationing (at least through 2012).
http://www.ritholtz.com/blog/2013/09/numerous-intelligence-officials-question-us-claims-on-syria/
False flag attack by the rebels via CIA equ. US, as Syria gov. was on the way to win, and Israel wants the conflict to continue.
Hi Jim,
From your own oil shocks research, I would think that we could have predicted no recession from the 2002 and 2011 events, since they didn’t result in a quarterly price average above what had been seen in recent prior years. The prior episodes all had events that would qualify as a “shock” under the definition in your 2003 paper.
Do you agree?
My sense is that with counter-seasonal draws in OECD stocks in Q2 and with supply already as tight as it is, it wouldn’t take much to send oil to new highs. In fact, I would give a calibrated estimate of 60% that we’ll see new highs in Brent and products sometime between now and end 2014.
“Of course, another possibility is that the world will become a safer, more stable place if the U.S. launches a few cruise missiles on Damascus.”
Here’s my take regarding my own congressman’s support of U.S. military action in Syria.
Mike Rogers is my congressman and I have written to him about this irrational support of an action that will be symbolic, meaningless, ineffectual, unfocused, and without strategic merit. I believe that Mr. Rogers has become confused by the notion that poison gas weapons are inherently different from other chemical weapons… napalm and non-nuclear bombs which are also chemical in nature. They are all indiscriminate killers except that poison gas is tactically difficult to use and can turn back against the users. Mr. Rogers has tried to equate the use of sarin-type poisons [which can be cooked up in the kitchen] to the development and deployment of nuclear weapons. That is nonsense.
The real issue is that the U.S. is reluctant to take strategic military steps to prevent the spread of nuclear weapons to the hands of Islamists in Iran, so Obama et al are using the smokescreen of “doing something” in Syria as proof that the U.S. is morally superior and resolute in its determination to prevent dictators from abusing their countrymen while preventing terrorists from coming to power… neither of which has any resemblance to reality as shown by Obama’s retreat from Iraq and Afghanistan, refusal to take timely action in Libya, support of the Muslim Brotherhood in Egypt, and the fact that al Qaeda is taking over the “rebellion” in Syria.
In the Middle East, the enemy of my enemy is probably a worse enemy of mine.
As far as oil is concerned, the U.S. is fortunate to have the significant increase in shale oil production. While that may not have any bearing on oil prices in the U.S., it certainly can have a bearing on the reliability of supply for this country… a far more important consideration in a world filled with Irans and Syrias.
Why don’t we let the UN do a full investigation of the gas attack and review the 100 page Russian document that says the rebels used the gas? We would thus not be acting as “cowboys” a phrase I seem to remember. We could announce to the world that we want proper investigation at the UN before taking reckless action and that we reserve the right to make a future unannounced attack anywhere anytime a regime uses WMDs that threaten US interests. I wonder if we would attack Russia or China if either of those countries used poison gas on their respective populations.
A U.S. strike will kill innocent Syrians. How many innocient Syrians should the U.S. kill in order to punish Assad for killing innocent Syrians? It’s irrational.
A great number of nations have signed at least 2 treaties outlawing the use of chemical weapons against civilians.
Where are those countries now?
The countries that signed the treaties must form a coalition, declare Assad a war criminal (assuming evidence is produced to convict him), then sentence him to a punishment equal to the crime.
It’s also possible the proposed military response is being orchestrated in order to draw a retaliatory response agains Israel. If the West can coax a retaliatory response against Israel, then Israel can respond by taking out Iran’s nuclear facilities/capabilities without being labeled the instigator.
It’s clear that a strike by the U.S. creates a potential quid pro quo scenario that draws Israel and Iran into the conflict.
Professor,
Thank you for posting of the real issues of the day.
There are many who have been predicting this conflict since 2006. This piece from ZeroHedge borders on conspiracy theory but when it comes to oil conspiracies seem to come true.
The Qatar Connection
Can Israel push Obama (or congress) to strike no matter what?
Otherwise, its a no go. Its exactly as Iraq, the whole charade. Looks and sounds like it, smells like it, walks like it.
Though I do not miss Saddam Hussein, Syria and today geopolitics are different from what was trending in 2003.
There are links among all these events in the Middle East, albeit not very strong ones between, say, Syria and Libya. The most important Syria-related threat to oil is in Iraq. The conflict in Syria is partly a continuation of the conflict in Iraq. The Iraqi Shiites have moved towards an alliance with Iran and Syria, and the US and Saudis are reacting by exploiting the opportunity of the Syrian rebellion to try to oust Assad. The Shiites seem well in control of Arab Iraq, and I don’t see why bombing Syria would change that, but it is anyway possible the front could move back to Iraq at some point.
JDH An econometrics question. Is there an inherent inconsistency in the way most studies view changes in oil prices? Okay, what do I mean by that? Typically when economists look at oil prices over some long time horizon they model those prices as a random walk. On the other hand, when economists explain specific spikes in oil prices they almost always identify and describe some exogenous deterministic reason for the price spike, and then describe some mean reversion after the event fades. For example, in this post you highlighted several political and military events as the source of price shocks. The prices eventually settled back to some longer run mean after the crisis de jour faded away. Your event oriented narrative seemed to describe some time series path that would suggest a deterministic level shift followed by a ramp down towards a more normal mean as the immediate crisis recedes. But when economists look across long horizons the data generating process gets treated as a random walk. All of the deterministic explanations seem to go out the window. I’m not questioning the claim that unit root tests cannot reject a random walk in these cases. My question is whether or not there is some unsettling inconsistency in the way price spikes are treated at the individual event level and the way they are treated over longer time horizons.
tj A U.S. strike will kill innocent Syrians.
Perhaps, but I doubt it. US strikes will be targeted against combatants, and they are not innocents. The 50% circular error probability for today’s cruise missiles is measured in centimeters, which means the warhead yields can be quite small given the nature of the likely targets (note: warheads trade accuracy for yield according to the squared cubic root formula). Don’t confuse the collateral damage of a drone fired Hellfire missile with a cruise warhead.
Bruce Hall I agree that chemical weapons are not weapons of mass destruction. WMD is a term that should be reserved for nuclear or biological weapons. That said, chemical weapons have no legitimate military use. Chemical weapons are a nuisance, but relatively easy to defend against. For example, the US Army has a “sniffer” vehicle we bought from the Germans:
http://www.army.mil/factfiles/equipment/nbc/m93.html
Chemical weapons are only effective against undefended civilians and there is no justification for the targeted and deliberate killing of civilians when those civilian deaths are avoidable and the attack serves no military objective.
I don’t take Iran’s warnings about launching attacks against the US Embassy in Baghdad all that seriously. Afterall, if Iran’s proxies really had the capability to launch that kind of a strike then you have to wonder why they haven’t been able to do so over the last 10 years despite ample reasons for doing so. So this is clearly a bluff.
Military technology has advanced to the point where we really need to think in terms of the evil Captain Kirk analogy. Remember the Star Trek episode in which the Enterprise gets caught in some kind of space storm where parallel universes touch? The good Kirk and the good Spock get switched over to an alternate universe Enterprise. The evil Captain Kirk had a magic viewer in his quarters that allowed him to dispatch any potential rivals at the touch of a button. Well, that’s kind of where we are with today’s cruise missiles and today’s satellites. So when Obama talks about targeted hits, I don’t think he just means artillery pieces and helicopters. He’s talking about decapitating the regime. And I’m pretty sure the Russians and Assad know this. And it’s that threat that is likely to make Assad cave and accept something like international control over his chemical weapons.
It is a good thing Russia has stepped up to run US foreign policy; otherwise, the US policy would be in total confusion.
Since the 1973 quadrupling of price, OPEC strictly determined the price of WTI crude until Reagan’s energy price deregulation finally broke OPEC’s hold. From January 1974 to September 1981, the oil market was characterized by long strings of consecutive months where price remained constant. The oil market simply moved from one cartel-determined plateau to the next. This was interrupted by the second oil price spike in 1979. Then from October 1981 to January 1986, prices slowly leaked downward until finally Saudi Arabia was forced to abandon its policy of restricting output to keep prices up. The increasing amount of cutback in Saudi output to maintain price finally drove Saudi oil revenue so low that that policy was no longer tenable. In 1986, oil prices collapsed.
Looking at Jim’s event table in terms of price, the 184% year-over-year spike in January 1974 was a major cause of the recession that year. The same for the Iranian revolution spike that hit 149% in May 1980. With prices then firming at around $38 per barrel, by March 1981 the year-over-year had dwindled to zero. Evidently in the wake of the Iranian revolution shock, lost output from the Iran-Iraq war in the fall of 1980 was of much less consequence. By then demand was rapidly adjusting. Even though global output fell 6% because of that war, from February 1980 to December 1981 prices held steady in a narrow range from $35 to $39.50, falling in real terms. And it’s price that determines behavior. The 1990 Gulf War precipitated a 79% spike, an important causal element of the 1990 recession. The spike in the second Gulf War in 2003 reached 73%. But coming off a low base just after the trough of the 2001 recession, it didn’t have recessionary impact. Similarly, big year-over-year spikes in 1987 and 2010 came off “artificially low” bases and were not recessionary. The Libyan Revolution spike was only 37%. Conversely, the spike in February 2000 of 144% and the spike in June 2008 of 99% were – though not supply disruption driven — certainly causal elements of the 2001 and 2008 recessions.
No one size fits all. However history shows that 75% spikes (no matter their cause and if not from an artificial low base) are quite likely to be recessionary. 75% is a trigger point rule-of-thumb, and price is visible daily in contrast to output numbers. Thus to the risk of a Syria event. Only if crude surges to $160 per barrel or beyond does a recession become likely. It goes without saying that the impact of an oil price spike is always modulated by the larger context.
“Of course, another possibility is that the world will become a safer, more stable place if the U.S. launches a few cruise missiles on Damascus.”
HAHAHAHA ok Dick Cheney!
holy crap 2slugbaits SPRINTING to this post to defend Obama’s prefferred action of nuking Syria, wow I am SHOCKED.
Aug STEO Comments
The EIA issued its August Energy Outlook today.
Some highlights:
For the three months ending August 13, compared to the same period previous year:
– US lower 48 production was up 1.04 mpbd, up 22% (mostly shales)
– Gulf of Mexico was up 0.1 mbpd, up 8% (albeit with pretty weak performance in recent times)
– NGLs production was up 0.16 mbpd (7%)
Put it all together, and US liquids production was up 1.32 mbpd (12.1%).
That’s a truly blowout performance. You’d have go back quite a ways in the historical record to find a year-on-year performance like that.
Anonymous Where did I say that I supported “nuking Syria”? Forget about the nukes, where did I say that we should bomb Syria at all? I simply pointed out that a cruise missile strike was unlikely to result in large numbers of innocents being killed.
As to decapitating the Syrian regime, a credible threat can be (and appears to have been) an effective motivator in getting Assad to rethink his position. But that doesn’t mean we should bomb Syria. Taking out Assad would risk handing those chemical weapons over to radical Islamic groups who would be even less constrained about using them than Assad.
Despite the Obama Administration’s clumsy and hamhanded handling of the Syrian problem, thanks to Kerry’s off-the-cuff remark and Putin’s picking up on it, the Administration may yet come out of this smelling like a rose. They probably don’t deserve it, but I’m sure they’ll take it.
I’m working on updating, with 2012 annual data, my paper on what I call the Export Capacity Index (ECI*). Here is a chart showing the 2005 to 2012 rates of change in the ECI ratios, by country for the (2005) Top 33 net oil exporters:
http://i1095.photobucket.com/albums/i475/westexas/Slide1_zps5a656e89.jpg
Based on the 2005 to 2012 data, about four-fifths of the top 33 net oil exporters in 2005 were trending toward zero net oil exports.
Note that even if an oil exporting country is showing increasing production, if their consumption is rising faster than production, their ECI ratio is declining, and they are headed toward zero net oil exports, which is why the US and China both became net importers, prior to production peaks.
*ECI = Ratio of total petroleum liquids + other liquids production divided by liquids consumption (EIA)
Your date on the Iranian Revolution is arguable, and if you change the dates you get a different result.
The Demonstrations started in ’77. the Shah left in January of ’79 and Khomeini took power in December of ’79. Gas prices did not move much in 1978 – In July of ’78 gas was 66.3 cents. In December of ’78 it 70.9. However, from March of ’79 to April of 1980 the price of gas went from 70.3 cents to $1.25.
There is more to learn. The Russian Invasion of Afghanistan took place in December of ’79. That invasion, Khomeini taking power, and the taking of the hostages pummeled consumer confidence which went from 66 (which is still low) to 56 in January and 52 in February. Moreover, how you date the Iranian Revolution has a large effect on how you view the effect on the US Economy. U3 in ’78 was pretty flat – it hovered around 6. In Dec of ’79 it was still 6. But by July of ’80 it was 7.8.
Here is what I find interesting – the professor’s list here misstates the inflection point, and doing so lets us learn an important lesson. In looking at the events of ’79 a good argument can be made that the actual oil supply is far less important than the EXPECTATIONS about future oil supply.
Shakespeare wrote “Present fears. Are less than horrible imaginings”. It would appear he would have been really good oil trader.
Data is here:
https://docs.google.com/spreadsheet/ccc?key=0AntBZ5YD–zQdEpwTS0xN1hqcFhla0o3QnNUOTF6dEE#gid=0