The EIA is now reporting that U.S. field production of crude oil averaged almost 8.7 million barrels a day in 2014. That’s up 1.2 mb/d from 2013, and is only 0.9 mb/d below the all-time U.S. peak in 1970.
Production of oil by means of fracturing shale and other tight formations is the main reason. The EIA drilling productivity report estimates that production from the Permian, Eagle Ford, Bakken, and Niobrara– the main tight oil producing areas– was 1 mb/d higher in 2014 compared to the previous year. I used that estimate to update my graph of U.S. production by source. The tight oil story is pretty dramatic.
![U.S. field production of crude oil, by source, 1860-2014, in millions of barrels per day. Updated from Hamilton (2014) based on data reported in [1], [2].](https://econbrowser.com/wp-content/uploads/2015/03/us_oil_prod_mar_15.png)
U.S. field production of crude oil, by source, 1860-2014, in millions of barrels per day. Updated from Hamilton (2014) based on data reported in [1], [2].
And it seems to be continuing. The February drilling report estimates production from those 4 regions will be almost 0.3 mb/d higher this month than it was in December. That’s leading to record levels of U.S. inventories.
Source: EIA.
How much longer will production keep going up? Much of the new production can’t be profitable at current prices, and the number of drilling rigs operating in the tight oil areas has fallen 12% since September.
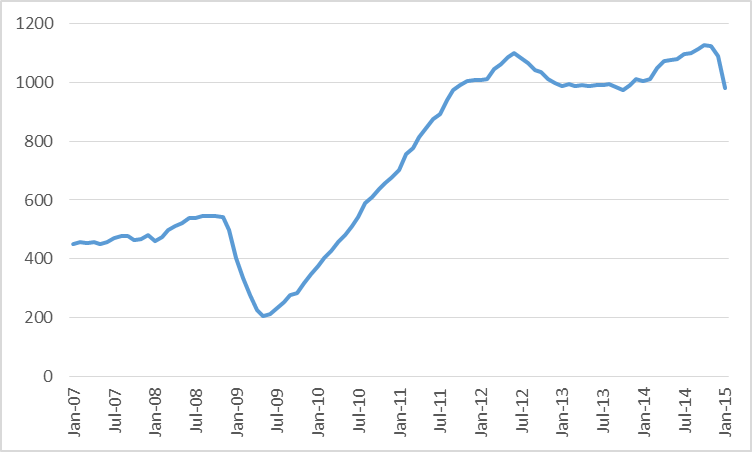
Combined oil rig count for Permian, Eagle Ford, Bakken, and Niobrara, January 2007 to January 2015. Data source: EIA.
That presumably means less than a 12% reduction in production from new wells, for two reasons. First, it is the least promising new prospects that will be cut first. Second, there has been a learning curve improving productivity of new wells.
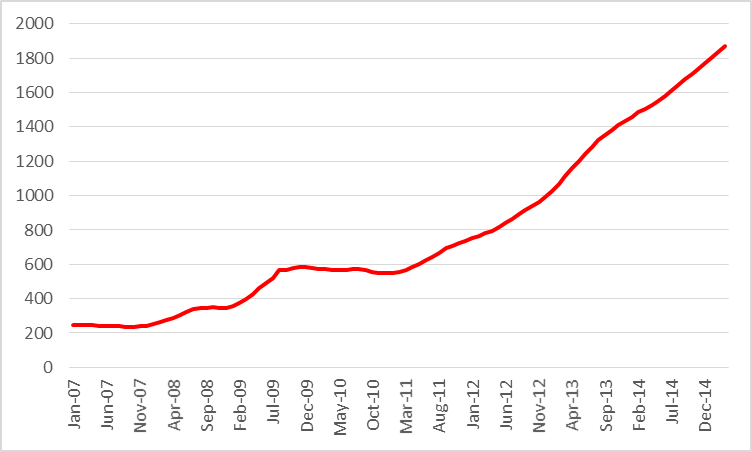
Average oil production per rig (in barrels per day) across Permian, Eagle Ford, Bakken, and Niobrara, January 2007 to January 2015. Data source: EIA.
Working against these is the fact that production from existing wells continues to decline. But at the moment, it seems further adjustments on the part of drillers will be necessary in order to bring the supply of oil in balance with the demand.
Because of declining production, Mexico no longer has sufficient domestic light, sweet crude oil production to meet the domestic demand from refineries designed to process light crude, so they are going to have to start importing light crude, although they remain a net oil exporter.
In any case, the Pemex official quoted in the following article had an interesting comment about condensate (which is basically natural gasoline that is not of much use as feedstock for producing distillates like diesel fuel).
As I have previously noted, in my opinion it is very likely that actual global crude oil production (45 and lower API gravity crude oil) probably peaked in 2005, while global natural gas production and associated liquids–condensate and NGL’s–have so far continued to increase.
And when the EIA refers to “Crude Oil,” they define it as actual Crude Oil + Condensate (C+C). Just as we don’t know for sure what the Condensate to C+C ratio is for US production, we don’t know what the ratio is for US C+C inventories, but in both cases, I suspect that the Condensate to C+C Ratio has increased substantially in recent years.
In any case, US imports of crude oil remain relatively high, at about 44% of the C+C inputs into refineries. I suspect that refiners continue to import a lot of crude oil, because they have to, in order to get the product output that they need.
Mexico’s Pemex aims to start importing light crude this year (2014)
http://uk.reuters.com/article/2014/08/28/mexico-pemex-idUKL1N0QX2TL20140828
A product yield by gravity chart follows, which explains why Pemex, and other refiners, need crude oil, not condensate. Note the substantial decline in distillate yield, just going from 39 API gravity to 42 API gravity (labeled as “Condensate” on the chart):
http://i1095.photobucket.com/albums/i475/westexas/Refineryyields_zps4ad928eb.png
And a graph showing API gravity versus sulphur content for several grades of global crude oil (note that the chart scale tops out at 40 API gravity):
http://i1095.photobucket.com/albums/i475/westexas/APGravityVsSulfurContentforCrudeOils_zpsc28e149c.gif
EIA Forecast for US Crude + Condensate Production by Type
Note the forecast for the very modest increase in 40 API gravity and lower crude oil production, versus the total increase in US C+C production:
http://i1095.photobucket.com/albums/i475/westexas/US%20Crude%20Oil%20Production%20by%20Type_zpsso7lpqgq.png
Second, there has been a learning curve improving productivity of new wells.
The standard learning curve formulae and learning curve tables that I know and use typically show a very sharp increase initially and then the curves go very flat very quickly.
so, i’ve got a question…if oil inventories are at a record high 444.4 million barrels, up 22.2% from the same period a year ago, as your EIA graph shows, then why did we continue to import 7.4 million barrels a day during the last week of February, 89,000 barrels a day more than we imported during the previous week?
Perhaps because the bulk of the increase in US Crude + Condensate production and inventories consists of condensate?
We are probably importing more oil because speculators are bring home and selling stocks that had been held in tankers offshore as a bet on higher prices.
They have to cut their loses at some point.
i answered my own question above here: http://www.dailykos.com/story/2015/03/09/1369526/-rig-counts-for-February-and-the-week-just-ended-and-what-are-we-gonna-do-with-all-this-oil
in a word, contango
Jeffrey J. Brown, Peak oil has been delayed by technology for extraction of tight oil. The future is uncertain. The doomsters of 10 years ago were excessively pessimist. Care to own up to excessive pessimism? I’m guilty.
The $100 trillion dollar question: can tight gas extraction be made to work outside USA?
To be clarify slightly, in my opinion tight/shale plays have delayed Peak Liquids, while the trillions of dollars spent on global upstream capex since 2005 have just kept us on an undulating plateau of actual crude oil production.
Note that when we ask for the price of oil, we get the price of actual crude oil (45 and lower API gravity crude), but when we ask for the volume of oil, we get some combination of crude + condensate + NGL + biofuels.
Following is a chart showing normalized values for global gas, global natural gas liquids (NGL) and global Crude + Condensate (with 2005 values = 100%), through the year 2012 (similar trends for 2013):
http://i1095.photobucket.com/albums/i475/westexas/Slide1_zps45f11d98.jpg
The following chart, posted up the thread, really tells the tale. It shows the EIA’s own projection for the composition of US C+C. As noted up the thread, the distillate yield from 40 and higher API gravity liquids drops tremendously, and what refineries need, in order to meet refined product demand, is mostly 40 and lower API gravity crude (as expressed by the Pemex CEO), while the vast majority of the increase in US liquids production is from 40 and higher API gravity liquids.
http://i1095.photobucket.com/albums/i475/westexas/US%20Crude%20Oil%20Production%20by%20Type_zpsso7lpqgq.png
Condensate & NGL are byproducts of natural gas production, and in my opinion the only reasonable interpretation of the available data is that actual global crude oil production (45 and lower API gravity crude oil) effectively peaked in 2005, while global natural gas production and associated liquids, condensate and NGL, have so far continued to increase.
@ Jeffrey J. Brown
Great charts!
They go a long way in explaining why, in many parts of the US, gasoline now sales for more than low-sulfur diesel. Fifteen years ago that never happened.
I’m no refinery expert, but I believe many, if not most, of the myriad petroleum byproducts we depend upon also come from the lower-gravity crude oils. See, for example, A partial list of products made from Petroleum (144 of 6000 items). “One 42-gallon barrel of oil creates 19.4 gallons of gasoline,” the heading reads. “The rest (over half) is used to make things like:”
I would add a caveat to your discussion. The decision to send Mexico’s low-gravity, high-sulfur Mayan crude to the Gulf Coast for refining also has to do with the high-sulfur content of the crude. It’s not all about gravity. Like I said, I’m no refinery expert, but I remember reading that Mexico’s current refinery infrastructure lacks the capability to refine high-sulfur crude oils. The Gulf Coast refineries, on the other hand, have a surfeit of this type of refining capability. I do not know how much of the decision to send much of Mexico’s low-gravity, high-sulfur Mayan crude to the Gulf Coast has to do with gravity, how much has to do with sulfur content, and how much has to do with other factors, such as US geopolitical exigencies (as is the charge frequently leveled here in Mexico). However, these factors are worth looking into.
To clarify slightly, my analysis suggests that gasoline may be in surplus*, relative to distillates like diesel, and the most recent data put the US average retail price for gasoline at $2.46 versus $2.93 for diesel. *Or to be more accurate, refiners don’t need any more condensate input.
I think that the following EIA chart, which shows that US 40+ API gravity C+C liquids increased from 1.4 mbpd in 2011 to an estimated 4.2 mbpd in 2015 (an increase of 2.8 mbpd), versus a projected increase of only about 0.7 mbpd in 40 and lower API gravity crude from 2011 to 2015, really tells the tale, especially when combined with the refinery yield chart that shows that Cat Feed + Distillates drops from about 52% at 39 API gravity to about 20% at 42 API gravity:
http://i1095.photobucket.com/albums/i475/westexas/US%20Crude%20Oil%20Production%20by%20Type_zpsso7lpqgq.png
http://i1095.photobucket.com/albums/i475/westexas/Refineryyields_zps4ad928eb.png
40 API and lower crude accounted for 75% of US C+C production in 2011, but the projection was that it would only account for 54% of US C+C production in 2015.
And as noted elsewhere, it took about half the global rig fleet (targeting oil and gas reservoirs) just to show a projected increase of about 0.5 mbpd in quality crude oil production (40 API gravity and lower) from 2011 to 2014.
In areas where tight/shale plays may be commercially feasible outside the US and Canada, the key question is whether operators in a given play can drill and complete wells fast enough to offset the declines from existing wells and add new production. Early last year, US rigs accounted for about half of the total global rig count, which gives one an idea of the scale of the drilling and completion effort that it would take to replace the output from giant declining global oil and gas fields with the output from high decline rate tight/shale plays.
It’s interesting to look at some regional declines in US oil and gas production, e.g., marketed Louisiana natural gas production (the EIA doesn’t have dry processed data by state).
According to the EIA, the observed simple percentage decline in Louisiana’s annual natural gas production from 2012 to 2013 was 20%. This would be the net change in production, after new wells were added. The gross decline rate (from existing wells in 2012) would be even higher. This puts a recent Citi Research estimate in perspective.
Citi estimates that the gross underlying decline rate for overall US natural gas production is about 24%/year. This would be the estimated year over year decline in production if no new wells were put on line.
Based on the Citi report, the US would have to replace 100% of current natural gas production in about four years, just to maintain current gas production for four years*.
*Of course existing production would not decline by about 100% in four years at a 24%/year decline rate, but I am stipulating a “What if” steady state production scenario.
This is an extremely bad example of reporting. Does it get any worse than this?
What it does is to take the official spin being evangelized by the EIA and other members of the “drill baby drill” crowd — folks like ExxonMobil’s chief executive Rex Tillerson — and faithfully and uncritically parrots it.
It’s the same old boilerplate, for example, that we got a couple of days ago from the Financial Times. In its drive to perpetuate what Michael Klare calls the “Reign of Carbon,” the Times sublimely reported that:
Those not enamored of being part of Karl Rove’s defactualized “create-your-own-reality” universe, however, might want to go over to the Texas Railroad Commission’s Online Research Queries to see what is actually going on in the Eagle Ford shale play.
Those who do so will make a shocking discovery: Crude oil and condensate production from the Eagle Ford peaked in August 2014 at 356 million barrels (total production for the entire month). By December 2014 it had fallen to 319 million barrels for the month. And this was well before the precipitous decline in the number of drilling rigs operating in the Eagle Ford. In the first week of September 2014, Baker Hughes reports that 202 drilling rigs were actively drilling in the Eagle Ford. That number by the first week of March 2015 had dropped to 149.
For those skeptical of the future carbon Utopia being touted from inside the Beltway, being spun by the likes of the EIA and Rex Tillerson, IHS has done significant research, and offers a dissident point of view:
IHS study suggests U.S. oil production to halt by mid-year
That should read:
Crude oil and condensate production from the Eagle Ford peaked in August 2014 at
35635.6 million barrels (total production for the entire month). By December 2014 it had fallen to31931.9 million barrels for the month.As I have often said the “peak oil” doomsayers have been wrong for 100 years. Our earth is floating on a sea of energy producing commodities (not just oil). The key is not whether it is there. The key is how to get it out and use it. This is why governments are so destructive to energy production. Over the whole world governments discourage discovery and exploitation by their confiscatory policies. It is freedom that allows the world to turn and autocracy that slows it down.
The End
Could you repeat your comments is a more succinct way (bullet points?) perhaps without sarcasm. If readers are busy, it is difficult to determine your point without reading all the citations. I am interested in what you have to say, but find it difficult to follow your thread without a lot of clicking.
@ AS
Well I’m not sure that the complexity of the human condition or the universe can be reduced to bullet points. However, I’ll give it my best shot:
• The need to slay the energy vampire (and Russia, Venezuela and Iran at the same time) for fun and profit is great.
• The US right-wingers have their preferred silver bullet to slay the energy vampire: the US’s fabled and highly touted shale gas and oil resource plays. (US left-wingers also have their preferred silver bullet to slay the energy vampire — the envisioned future Green energy Utopia — but that is a topic for a different discussion.)
• Because the need to slay the energy vampire is so great, there’s a lot of lying and wishful thinking going on when it comes to shale gas and oil.
• As it turns out, the right-winger’s silver bullet is a blank. It is little more than a flash in the pan.
• The Barnett Shale play was the first major US shale play.
• In 2013, the world was shocked when the Bureau of Economic Geology at the University of Texas concluded that the average EUR from the 16,000 wells in the Barnett Shale would be only 1.44 billion cubic feet.
• This was a time when industry, and those advocating for US full-spectrum dominance, were still touting average EURs from wells in the Barnett at between 2 and 3 bcf per well.
• When the University of Texas released its study in February 2013, many felt that even it was too optimistic. Jim Fuquay, for instance, asked in the Fort Worth Star-Telegram, “But what about producers’ estimates of 2 or even 3 bcf?”
• Fuquay pointed out that at that time, even though many of the Barnett shale wells had already been producing for years, “Only 512 wells in the Barnett Shale, or less than 3 percent, have produced 2 bcf in their lives.” He added that “A mere 70 wells, less than 1 percent, have hit 3 bcf or more.”
• As it turns out, the University of Texas study was too optimistic. If one takes a pen and traces actual production from the Barnett Shale for the past four years over the graph of the study’s production forecast, what we see is that production for a couple of years exceeded the forecast, but then production went into a steep nosedive and has declined much more rapidly than the researchers had predicted.
• Average EUR from a Barnett Shale well now looks to be well below 1 bcf, or a half, a third or even less of what producers had hyped.
• There is a long history of distortions and exaggerations, which find fertile ground with true believers in American exceptionalism and full-spectrum dominance, being perpetrated by shale oil and gas producers.
• There exists considerable evidence which suggests that these distortions and exaggerations have not stopped, and that they continue unabated to this very day.
• As I said, the need to believe in a silver bullet to slay the energy vampire, despite all factual evidence to the contrary, is great.
The End
Thanks for your comments.
If I understand you correctly you agree with Jeffrey Brown and I think Professor Hamilton that we are past peak oil and that world oil harvesting is in decline, since the harvesting of tight oil is not going to rescue an energy hungry world. What now then for energy sources?
Well, personal transportation accounts for the majority of oil consumption.
Personal transportation is easily done with EVs – a Chevy Volt costs less to own and operate than the average US passenger vehicle, and gets 200MPG. A Nissan Leaf is the lowest cost vehicle on the road.
EVs can be ramped up pretty quickly – They’re 3-4% of sales right now (including hybrids). Production volume could be doubled essentially overnight, and doubled every two years thereafter. In 8 years you could be at 80% of new vehicles, and in another 5 years they’d account for 50% of vehicle miles driven. In another 6 years they’d account for 75% (vehicles less than 6 years old account for 50% of VMT). Ethanol accounts for about 10% of passenger transportation fuel, so a fleet of Chevy Volts could be powered with no oil at all.
There’s a pretty straightforward path forward, if we needed a short term fix to get us through a period of fast depletion, or another oil shock while we were transitioning to EVs. The US could reduce passenger fuel consumption by 50% essentially overnight by raising the average passengers per vehicle from 1.2 to 2.4. Look at Uber, look at smartphones for connectin with people. There are very, very few destinations in the US that no one else is going to. On almost any road, look around: there are other people on the road, going in the same direction.
With an ad hoc smartphone based system, you could find someone going in your direction almost anywhere. And, even with old-fashioned employer-based systems, about 10% of Americans carpool to work right now.
Carpooling – the horror.
Dr. Hamilton—I was curious where you got the data points for offshore oil production statistics during the early years (~1950 to 1980).
The EIA pages that are cited as the sources of the data appear to only have data separated into on-shore and off-shore going back to 1981. Elsewhere, I’ve seen EIA data showing this split, going back to 1970, but not any earlier than that.
Mason Inman: See Annual Energy Review, Table 5.2.
Thanks so much! I hadn’t seen that data set before.
Nice
Are we surprised there’s corruption and incompetence?
http://money.cnn.com/2015/03/10/news/economy/world-leaders-salaries/index.html?iid=HP_LN
Yeah, if we want good government we have to be willing to pay decent salaries. Conservatives seem bent on not allowing government to have enough revenue to do it’s job properly. Of course, part of government’s job is to regulate business, so the motivation is clear…
I wonder if it is possible to do an econometric analysis of fuel prices and actual consumption levels.
We’ve seen very modest appreciation in fuel efficiency and less driving in the passenger transportation side considering the near tripling of real costs, i.e, how much households spend on gasoline as a percentage of their income.
So, at what price point does elasticity of demand really kick in, and can we do any realistic quantitative projection, controlling for such factors as employment levels and necessity costs (those households who have no alternatives but to pay more – they can’t don’t have any substitutes in transit or can’t afford to buy more efficient vehicles) .
Damn Yankee drillers. Too smart, too innovative, too productive for their own good.
Not so good at resolving prisoner and social dilemmas.
They have been very good at increasing very light crude oil and condensate production, but less so at increasing quality crude oil production (40 API gravity and lower).
It took roughly half of the entire global rig fleet (drilling for oil and gas) to show an increase of about 0.5 mbpd in US 40 API and lower crude oil from 2011 to 2014, based on EIA data and projections.
Despite huge US Crude + Condensate (C+C) inventories*, the latest data indicate that US refiners had to still (net) import 44% of the C+C processed daily in US refineries. I suspect that US refiners continue to net import about 44% of the C+C input because they have to–in order to meet the full spectrum of demand for refined petroleum products.
*I suspect, and EIA data indicate, that condensate represents a large and increasing share of total US C+C production, and I therefore suspect that condensate represents a large and increasing share of US C+C inventories
Re: 2008/2009 Oil Price Decline Vs. 2014/2015 Oil Price Decline
In 2008, the last month in 2008 with an average Brent price of $100 or more was 8/08, when Brent averaged $113. The monthly low price point was $40 in 12/08. The first subsequent month with an average price of $100 or more was 2/11, when Brent averaged $104.
From December, 2008 to February, 2011, the annual rate of increase in Brent crude oil prices was 43%/year.
Some Monthly Brent Prices, from 12/08:
12/08: $40
1/09: $43
2/09: $43
3/09: $47
4/09: $50
In 2014, the last month in 2014 with an average Brent price of $100 or more was 8/14, when Brent averaged $102. The (so far) subsequent monthly low price was $48 in 1/15.
Some Monthly Brent Prices, from 1/15:
1/15: $48
2/15: $58
3/15: (Average for March about $60 so far)
One crucial difference between then and now is that the Saudis were cutting their production in 2008/2009, while maintaining their production in 2014/2015.
Another important difference is that we have seen a large increase in US light crude oil and condensate production since 2008, although EIA data and projections indicate that the increase in US quality crude oil production (40 API gravity and lower) has been fairly small, about 0.5 mbpd from 2011 to 2014. Although this has reduced US demand for imported oil, currently the US is dependent on net crude oil imports for about 44% of the crude + condensate processed daily in US refineries.
On the demand side, US and global vehicle sales were down year over year in both 2008 and 2009. In contrast, global vehicle sales hit an all time record high in 2014.
However, I would argue that the most important difference between then and now is that we have, in round numbers, burned through about 100 Gb of GNE* from 2009 to 2014 inclusive.
Based on the 2005 to 2013 rate of decline in the Top 33 ECI Ratio (ratio of production to consumption), I estimate that post-2005 global CNE (Cumulative Net Exports) are on the order of about 500 Gb (rounding off to nearest 100 Gb).
Therefore, based on the foregoing estimate, during the six year period from 2009 to 2014 inclusive we may have burned through about one-fifth of the total post-2005 cumulative supply of Global Net Exports of oil.
In other words, depletion marches on, at an accelerating rate of depletion in the remaining supply of post-2005 Global Cumulative Net Exports of oil.
*Combined net exports from (2005) Top 33 net oil exporters (total petroleum liquids + other liquids, EIA)
Re: Mexico’s Net Exports of Oil
Assuming no change in consumption and based on 9 months of production data, it looks like Mexico’s net exports will drop from 0.8 mbpd in 2013 to about 0.7 mbpd in 2014–versus 1.8 mbpd in 2004 (total petroleum liquids + other liquids).
Based on the 2004 to 2013 rate of decline in Mexico’s ECI Ratio (Ratio of production to consumption), I put their post-2004 CNE (Cumulative Net Exports) at about 5.5 Gb (billion barrels, total petroleum liquids + other liquids), with 3.5 Gb having been shipped from 2005 to 2013 inclusive. I estimate that Mexico shipped about 13% of their remaining post-2004 CNE in 2014.
Global light vehicle sales were about 83 million in 2013. A forecast for 2015:
Slower, Not Lower: IHS Automotive Forecasting 88.6 Million Unit Global Light Vehicle Market in 2015
http://press.ihs.com/press-release/automotive/slower-not-lower-ihs-automotive-forecasting-886-million-unit-global-light-v
Been watching the unemployment claims in TX, ND, SD, LA, and OK. If there has been an impact, I am not seeing it. TX claims are slightly improved over last year. OK, LA, ND, and SD are about flat to last year. This is somewhat surprising.
Art Berman has an article on increased consumption, which is supportive of Steven Kopits’ (January, 2015) article on supply less demand):
http://www.artberman.com/world-oil-demand-surges-a-data-point-for-price-recovery/
As noted up the thread, global vehicle sales are projected to hit 89 million in 2015, versus 83 million in 2013. A record high number of new vehicle sales in 2014 and 2015 is one of the key differences between now and the 2008/2009 price decline.
Steven Kopits’ (January, 2015) outlook for global supply less demand:
Supply Minus Demand, Explained
http://www.prienga.com/blog/2015/1/20/supply-minus-demand-explained
The thesis remains intact. If it remains on track, expect a big Q2 for oil consumption, and probably global GDP growth as well.
Thanks for the kind words, Jeffrey.