On Friday the Bureau of Economic Analysis released its second estimate of U.S. 2015:Q1 real GDP growth. The BEA now estimates that the economy contracted at a 0.7% annual rate rather than grew 0.2% as originally estimated. The number is discouraging, though I see some silver linings.
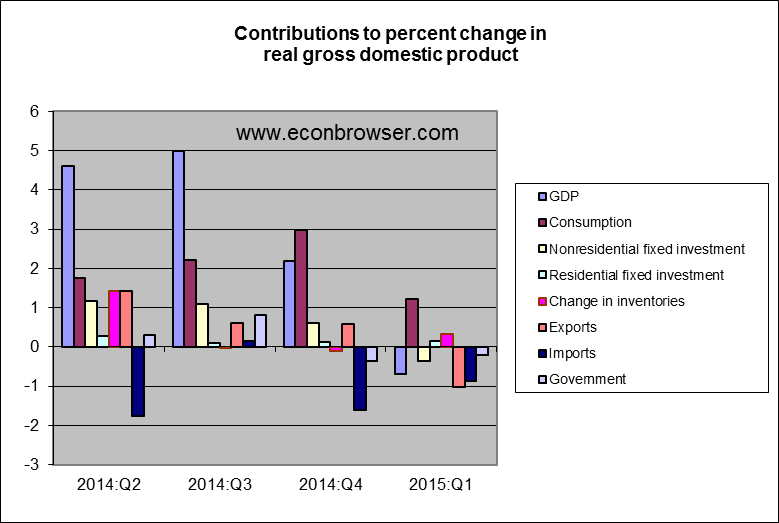
The primary factors that brought GDP growth down from the BEA’s original estimate were stronger growth of imports and a smaller inventory build than originally anticipated. Both components can be volatile, and I would not interpret the latter as a sign of fundamental weakness.
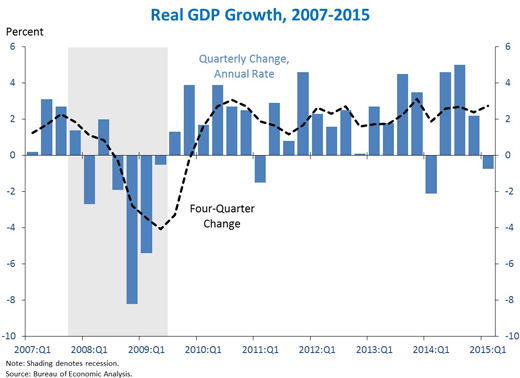
The new BEA data also allow us to calculate an alternative estimate of GDP, building the estimate up from income data instead of expenditures. In terms of the underlying concepts, the income-based and expenditure-based calculations should produce the identical number for GDP. But because the data sources are different, in practice the two estimates differ, with the difference officially reported as a “statistical discrepancy.” While the expenditure-based GDP estimate showed a 0.7% decline at an annual rate, the income-based GDP estimate implied 1.4% growth for the first quarter. Moreover, using the statistical method for reconciling and combining the different estimates proposed by Aruoba, Diebold, Nalewaik, Schorfheide, and Song (ADNSS), the best estimate of first-quarter real GDP growth based on the existing data might be about 2%.
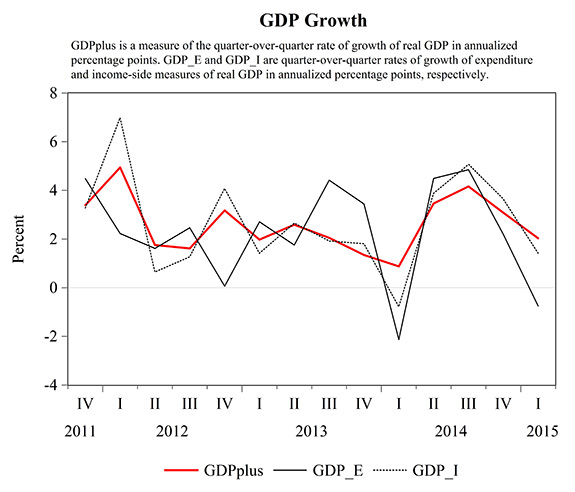
Alternative estimates of real GDP growth at an annual rate. Solid black: expenditure-based estimate reported by BEA. Dotted black: income-based estimate calculated directly from BEA-reported statistical discrepancy and GDP price deflator. Red: estimate calculated using the Aruoba, et al. method. Source: Federal Reserve Bank of Philadelphia.
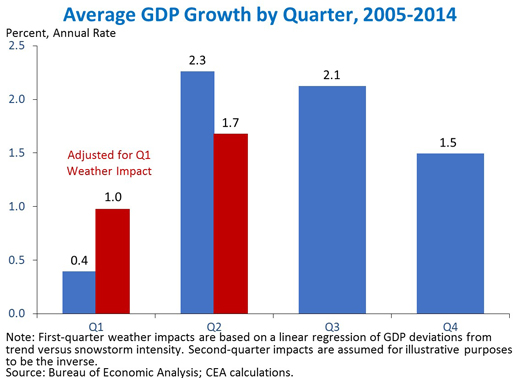
Another factor contributing to the weak first-quarter GDP number was harsh winter weather. This is becoming a pattern, with the “seasonally adjusted” Q1 estimates coming in consistently below the other three quarters for the last decade. Jason Furman had this comment:
The debate so far over the cause of first-quarter underperformance has tended to treat residual seasonality and weather effects as analytically distinct explanations. However, to the extent that worsening winter weather is part of a long-term trend rather than a random occurrence, changing weather patterns may be related to residual seasonality. A seasonal adjustment algorithm should adjust for effects of normal weather within a particular quarter—and to the extent that global climate change leads to a new “normal” for weather, seasonal adjustments will eventually catch up.
But others caution that we shouldn’t simply dismiss the Q1 GDP numbers. Here’s Richard Moody, chief economist at Regions Financial Corp.:
Many analysts seem tempted to simply brush aside the contraction in real GDP in [the first quarter] as a function of transitory factors– harsh winter weather, the port strike– that will have no lasting effect. We caution against treating the first-quarter GDP data so cavalierly, as doing so overlooks the more structural forces that weighed on the economy in [the first quarter]– the ongoing pullbacks in job counts and investment in the energy sector and related industries, still uncertain global growth prospects, and the stronger U.S. dollar.
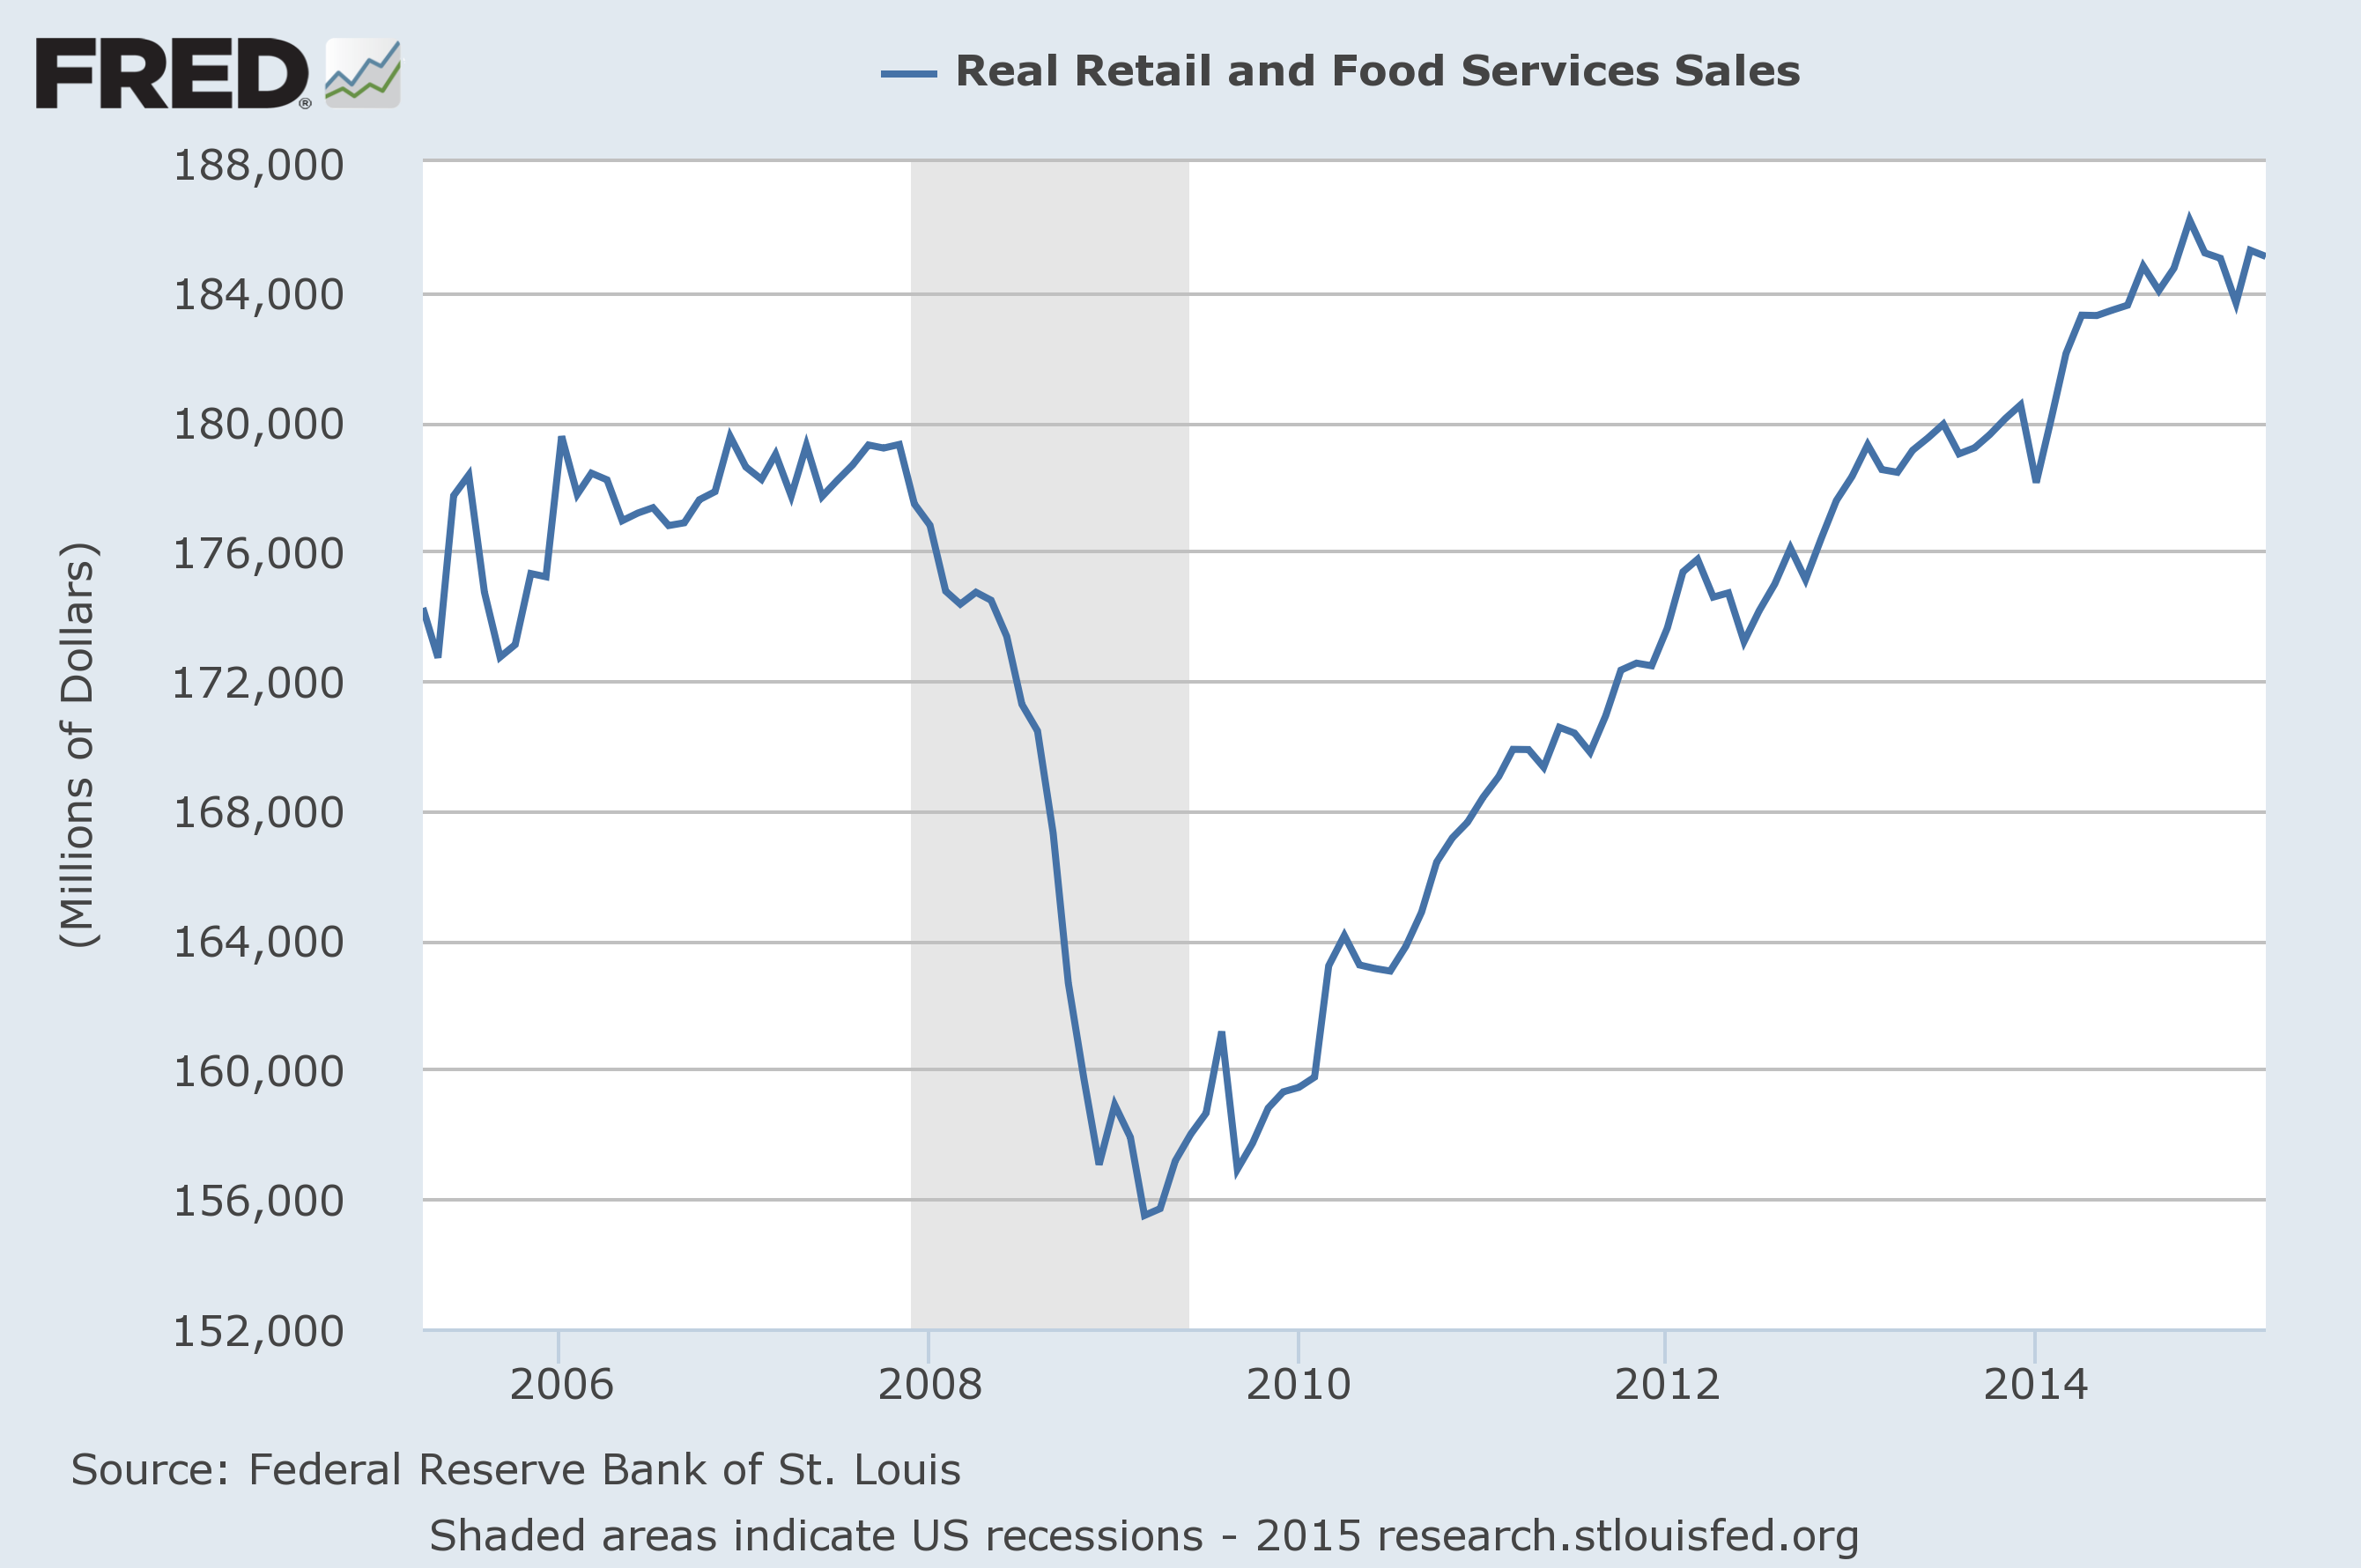
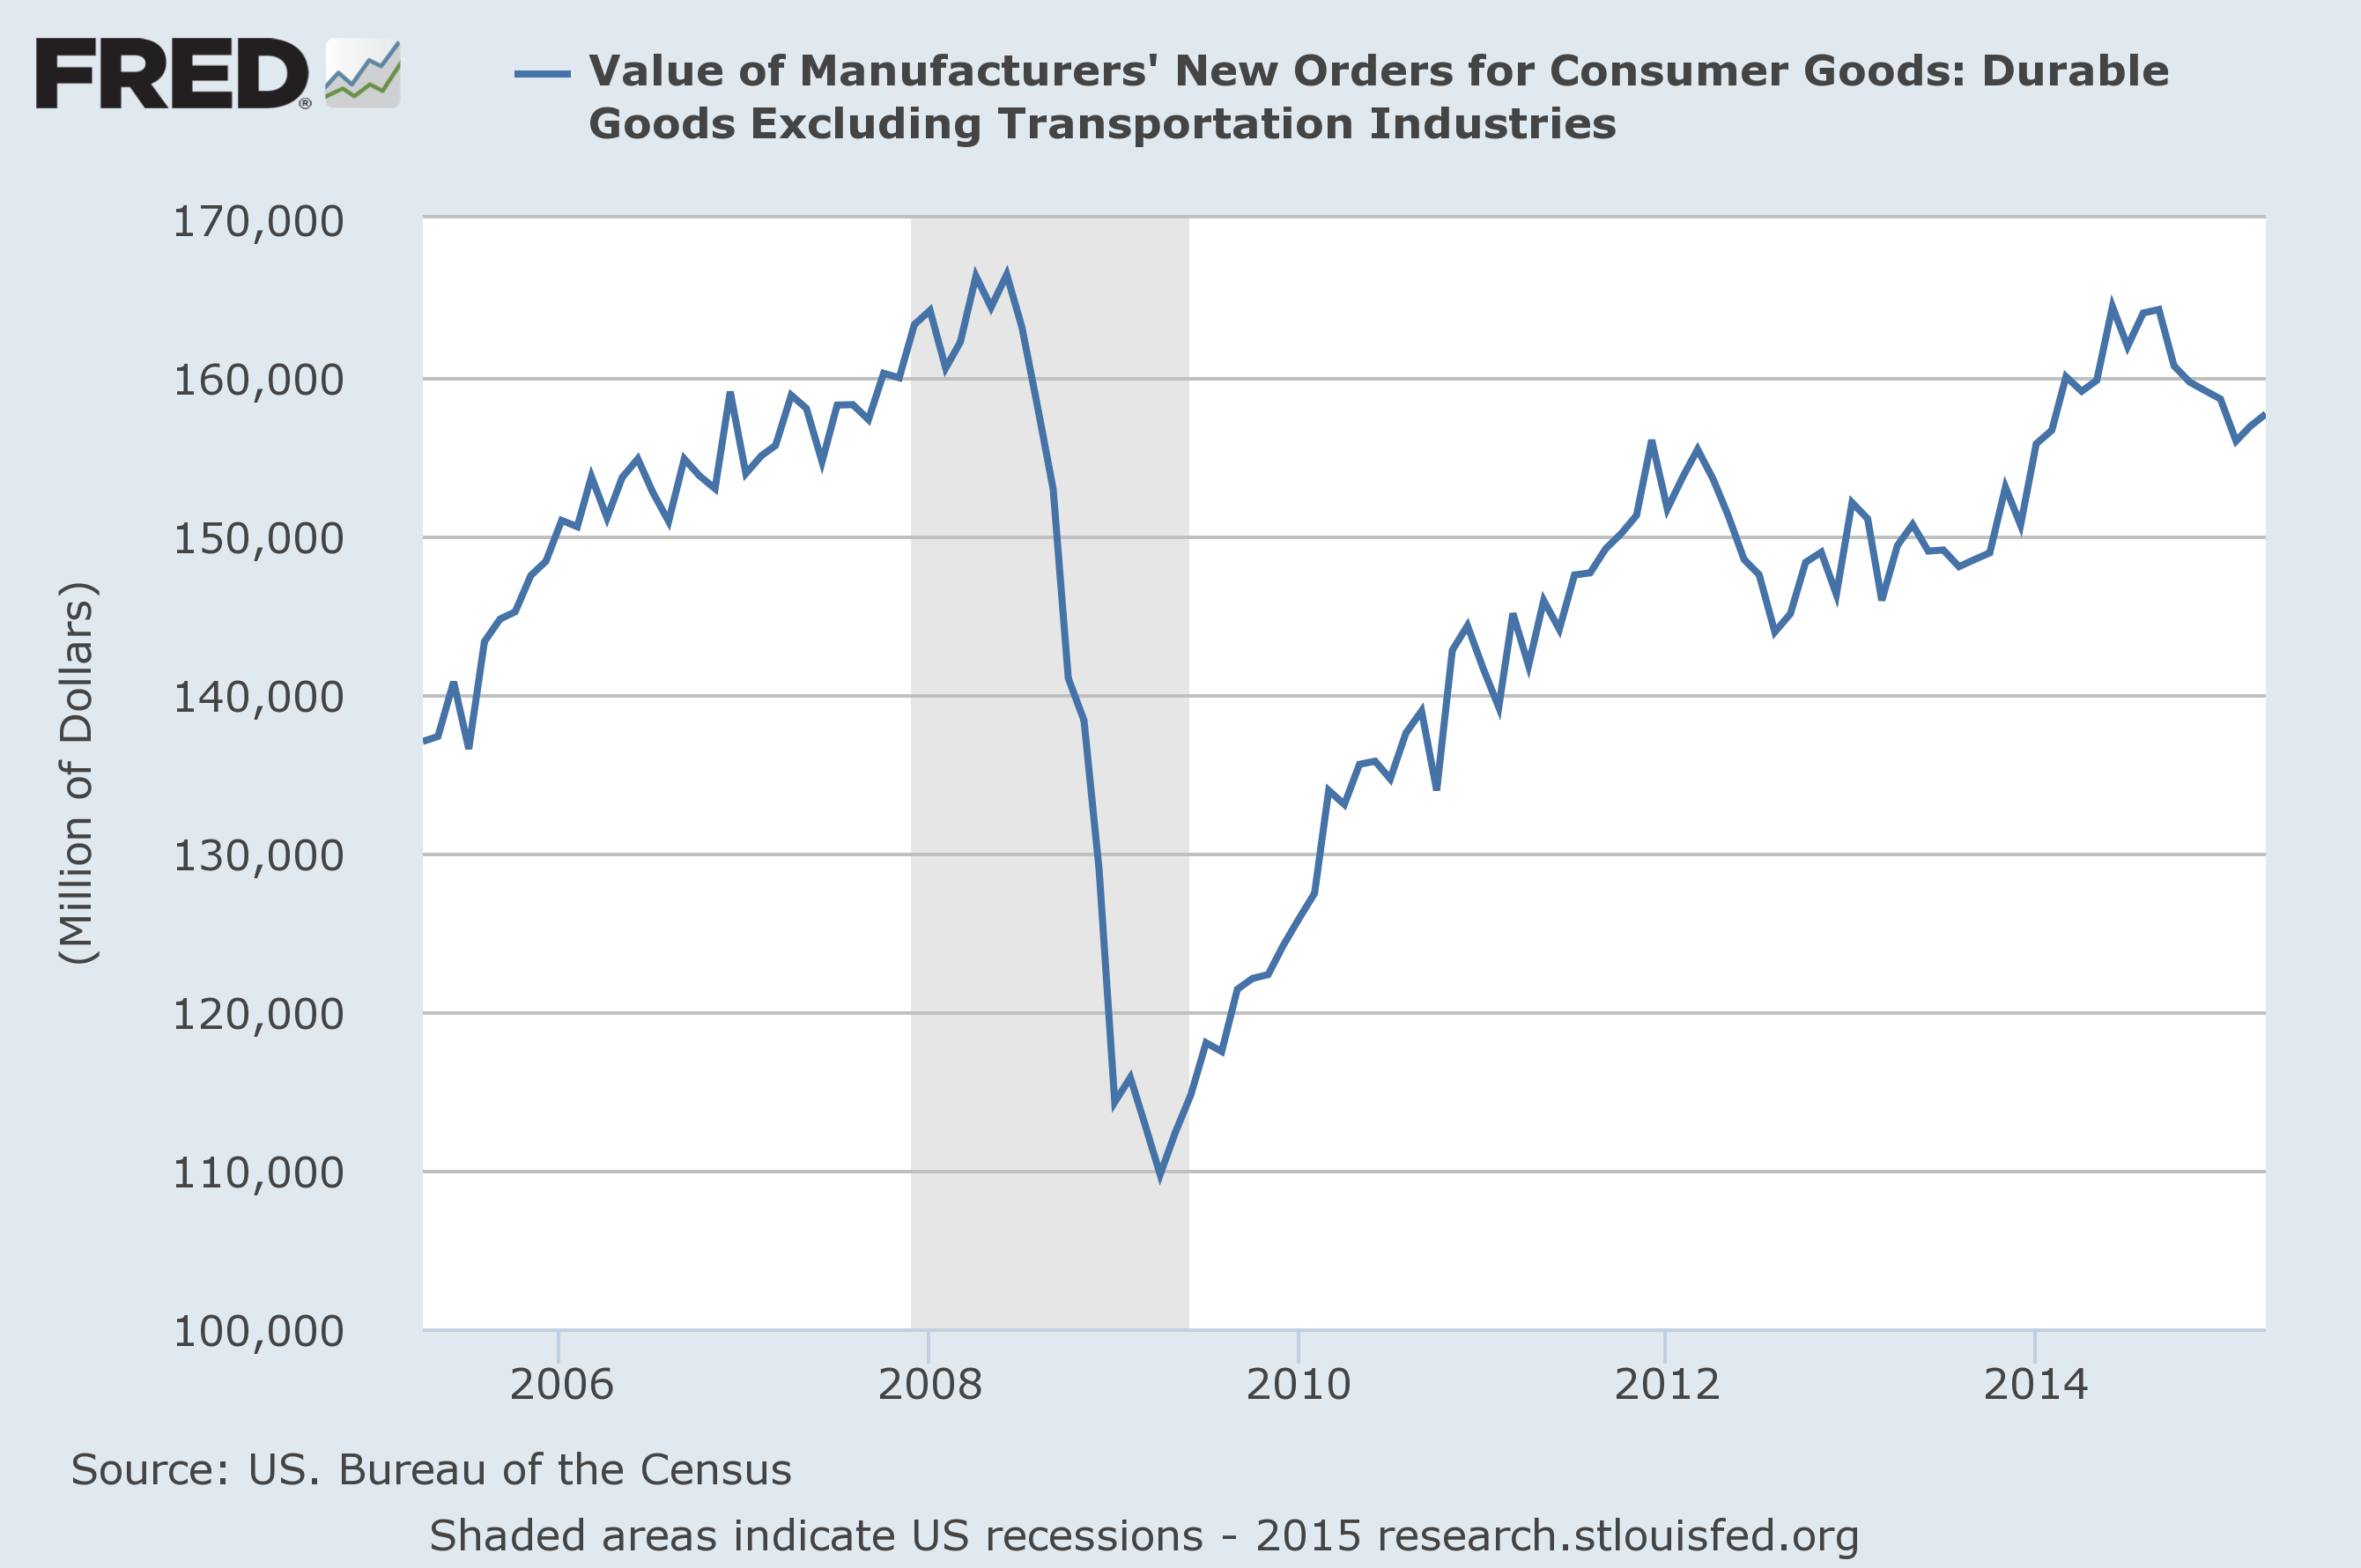
It’s certainly true that signs of weakness are not just showing up in GDP and are not confined to the first quarter. The latest numbers on industrial production, retail sales, and durable-goods orders all suggest the economy may have hit a soft spot that extended into April.
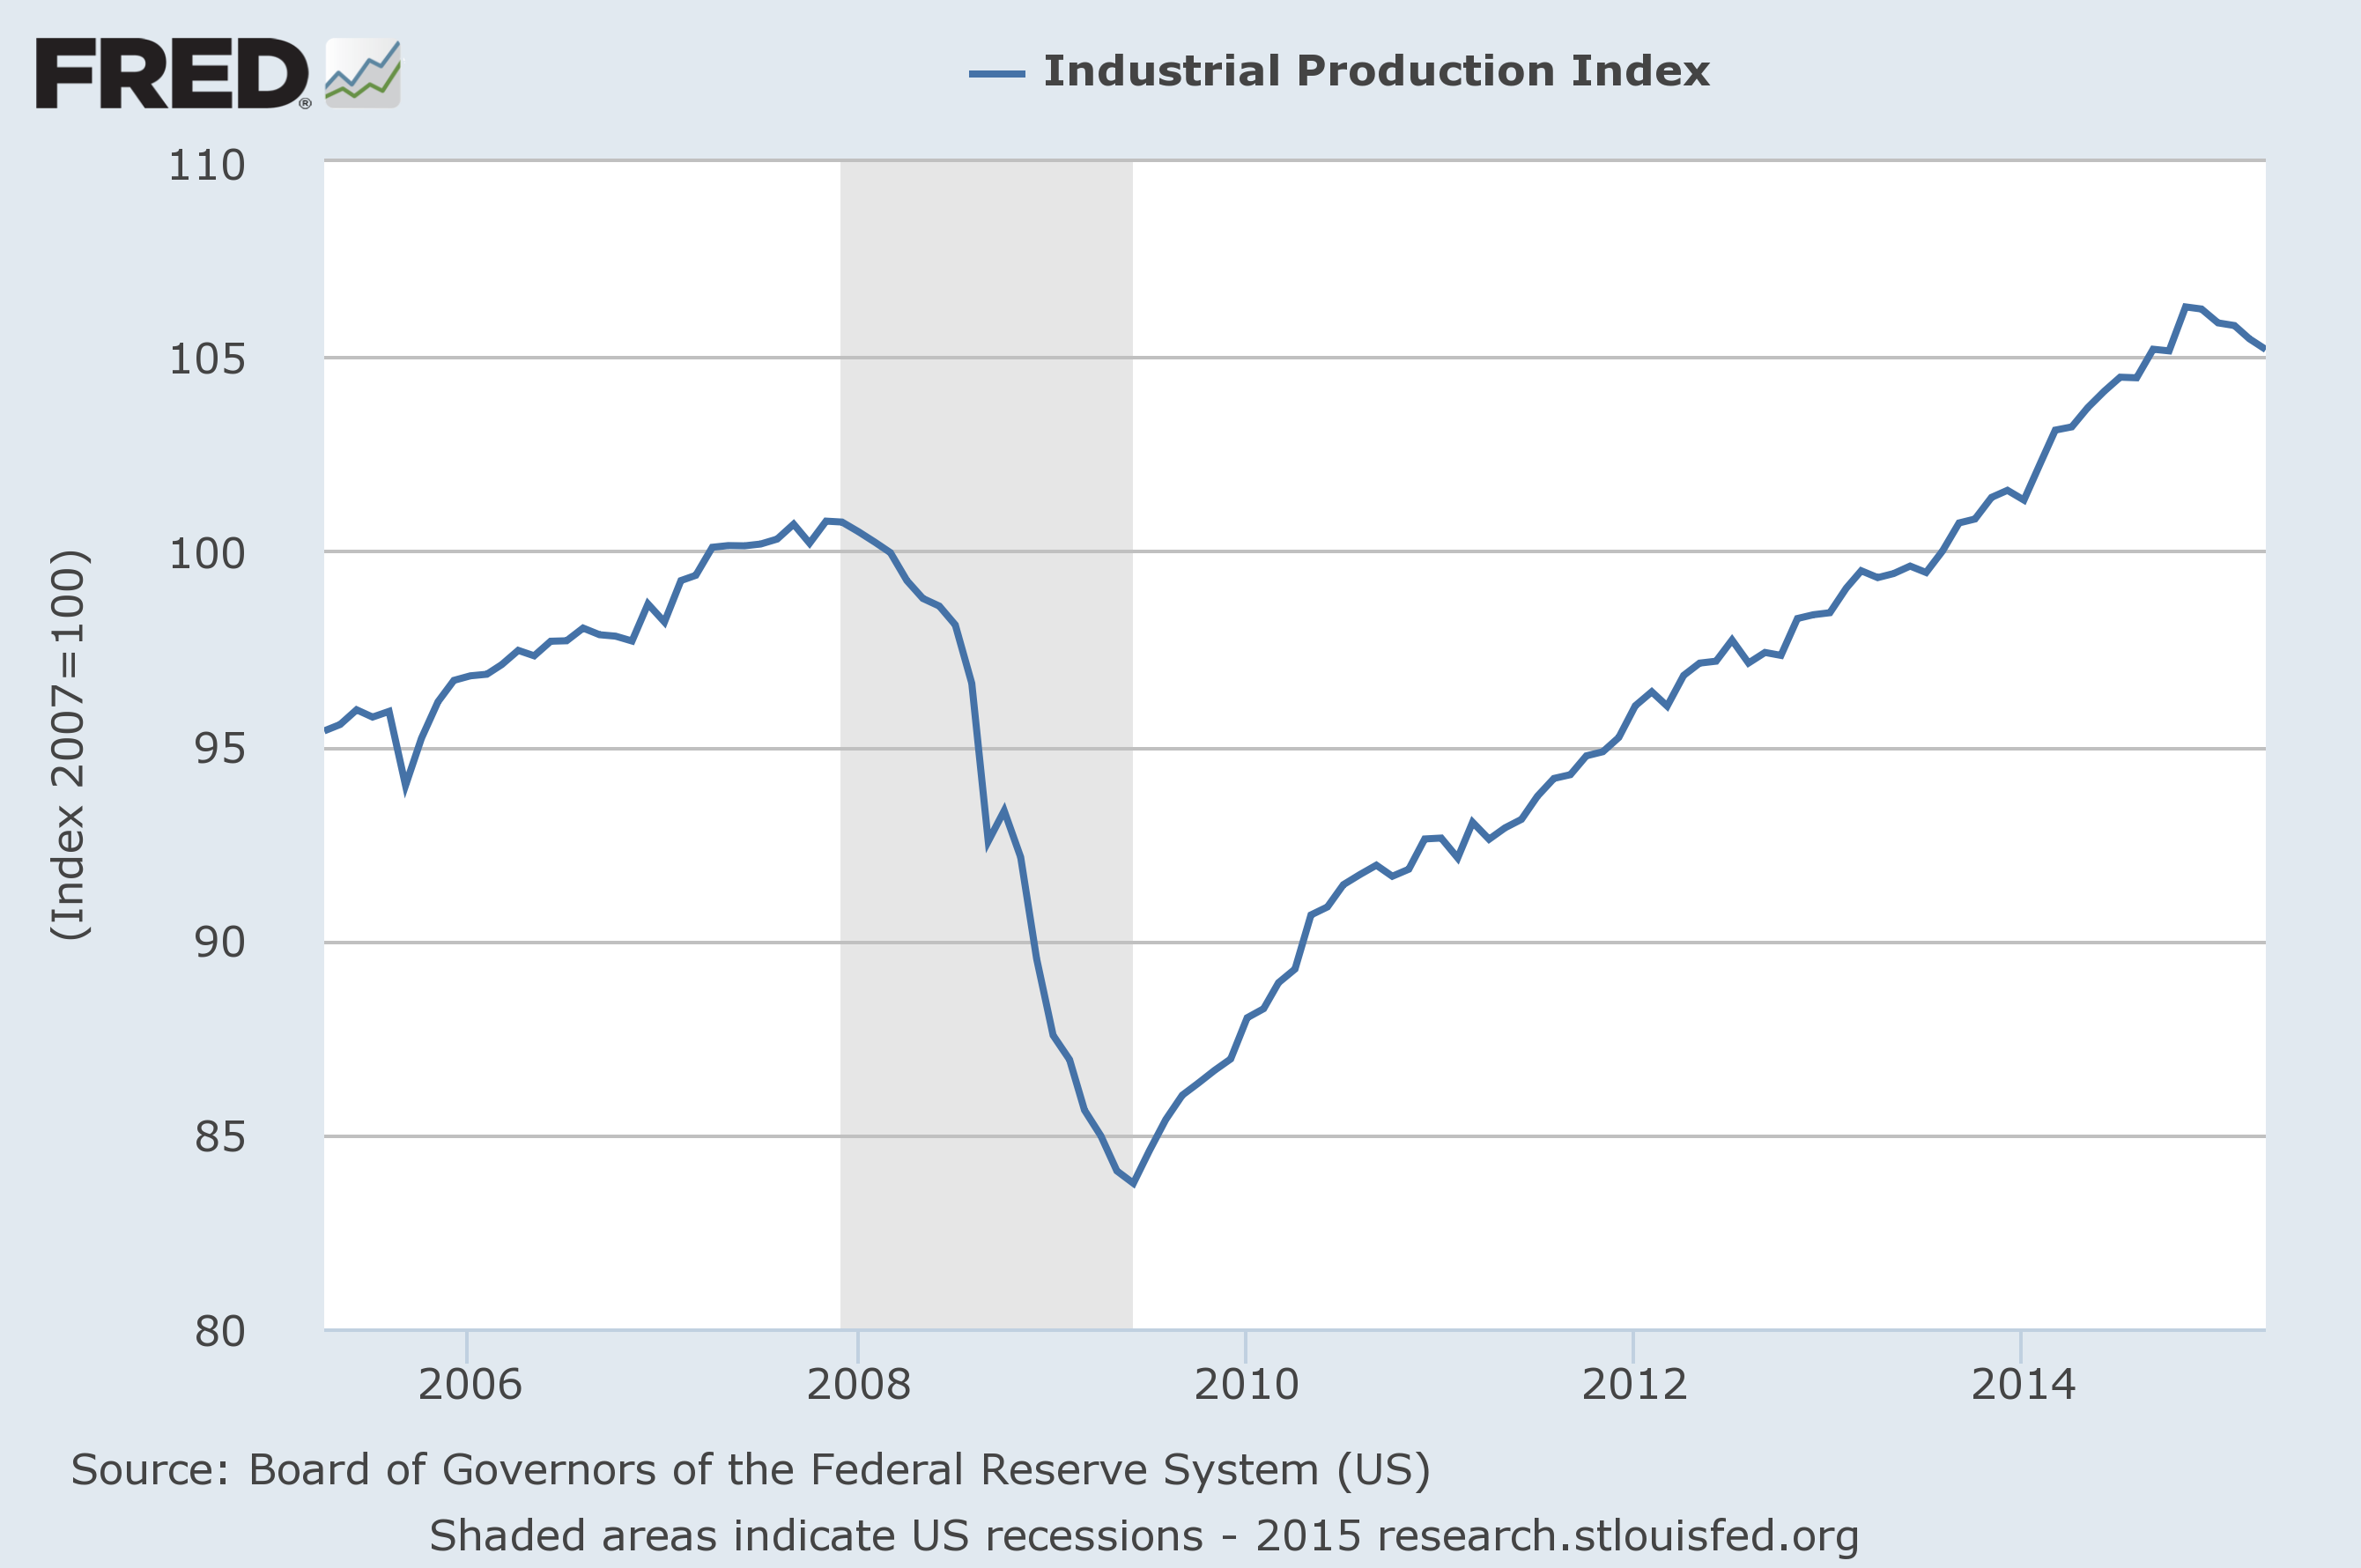
Source: FRED.
Source: FRED.
Source: FRED.
But Bill McBride explains why he’s still sanguine about housing:
Total housing starts in April were solid and well above expectations– and at the highest level since 2007…. Note the exceptionally low level of single family starts and completions. The “wide bottom” was what I was forecasting several years ago, and now I expect several years of increasing single family starts and completions.
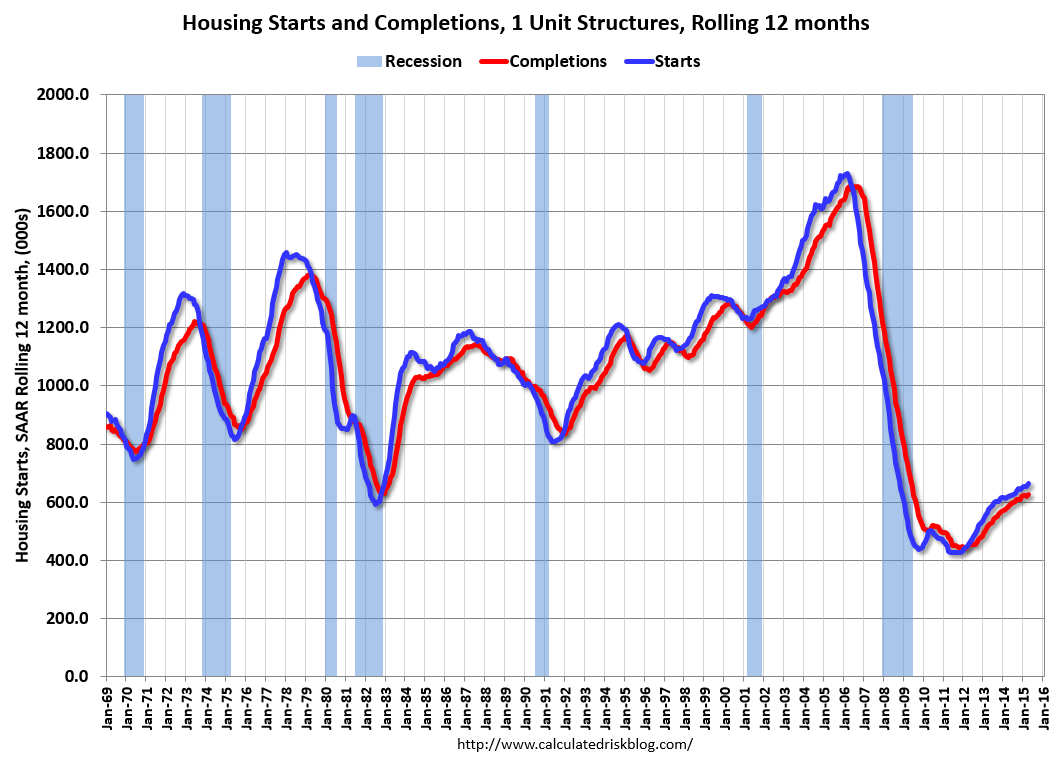
Source: Calculated Risk.
But the key is ongoing gains in employment, which still show solid momentum that should carry the economy forward.
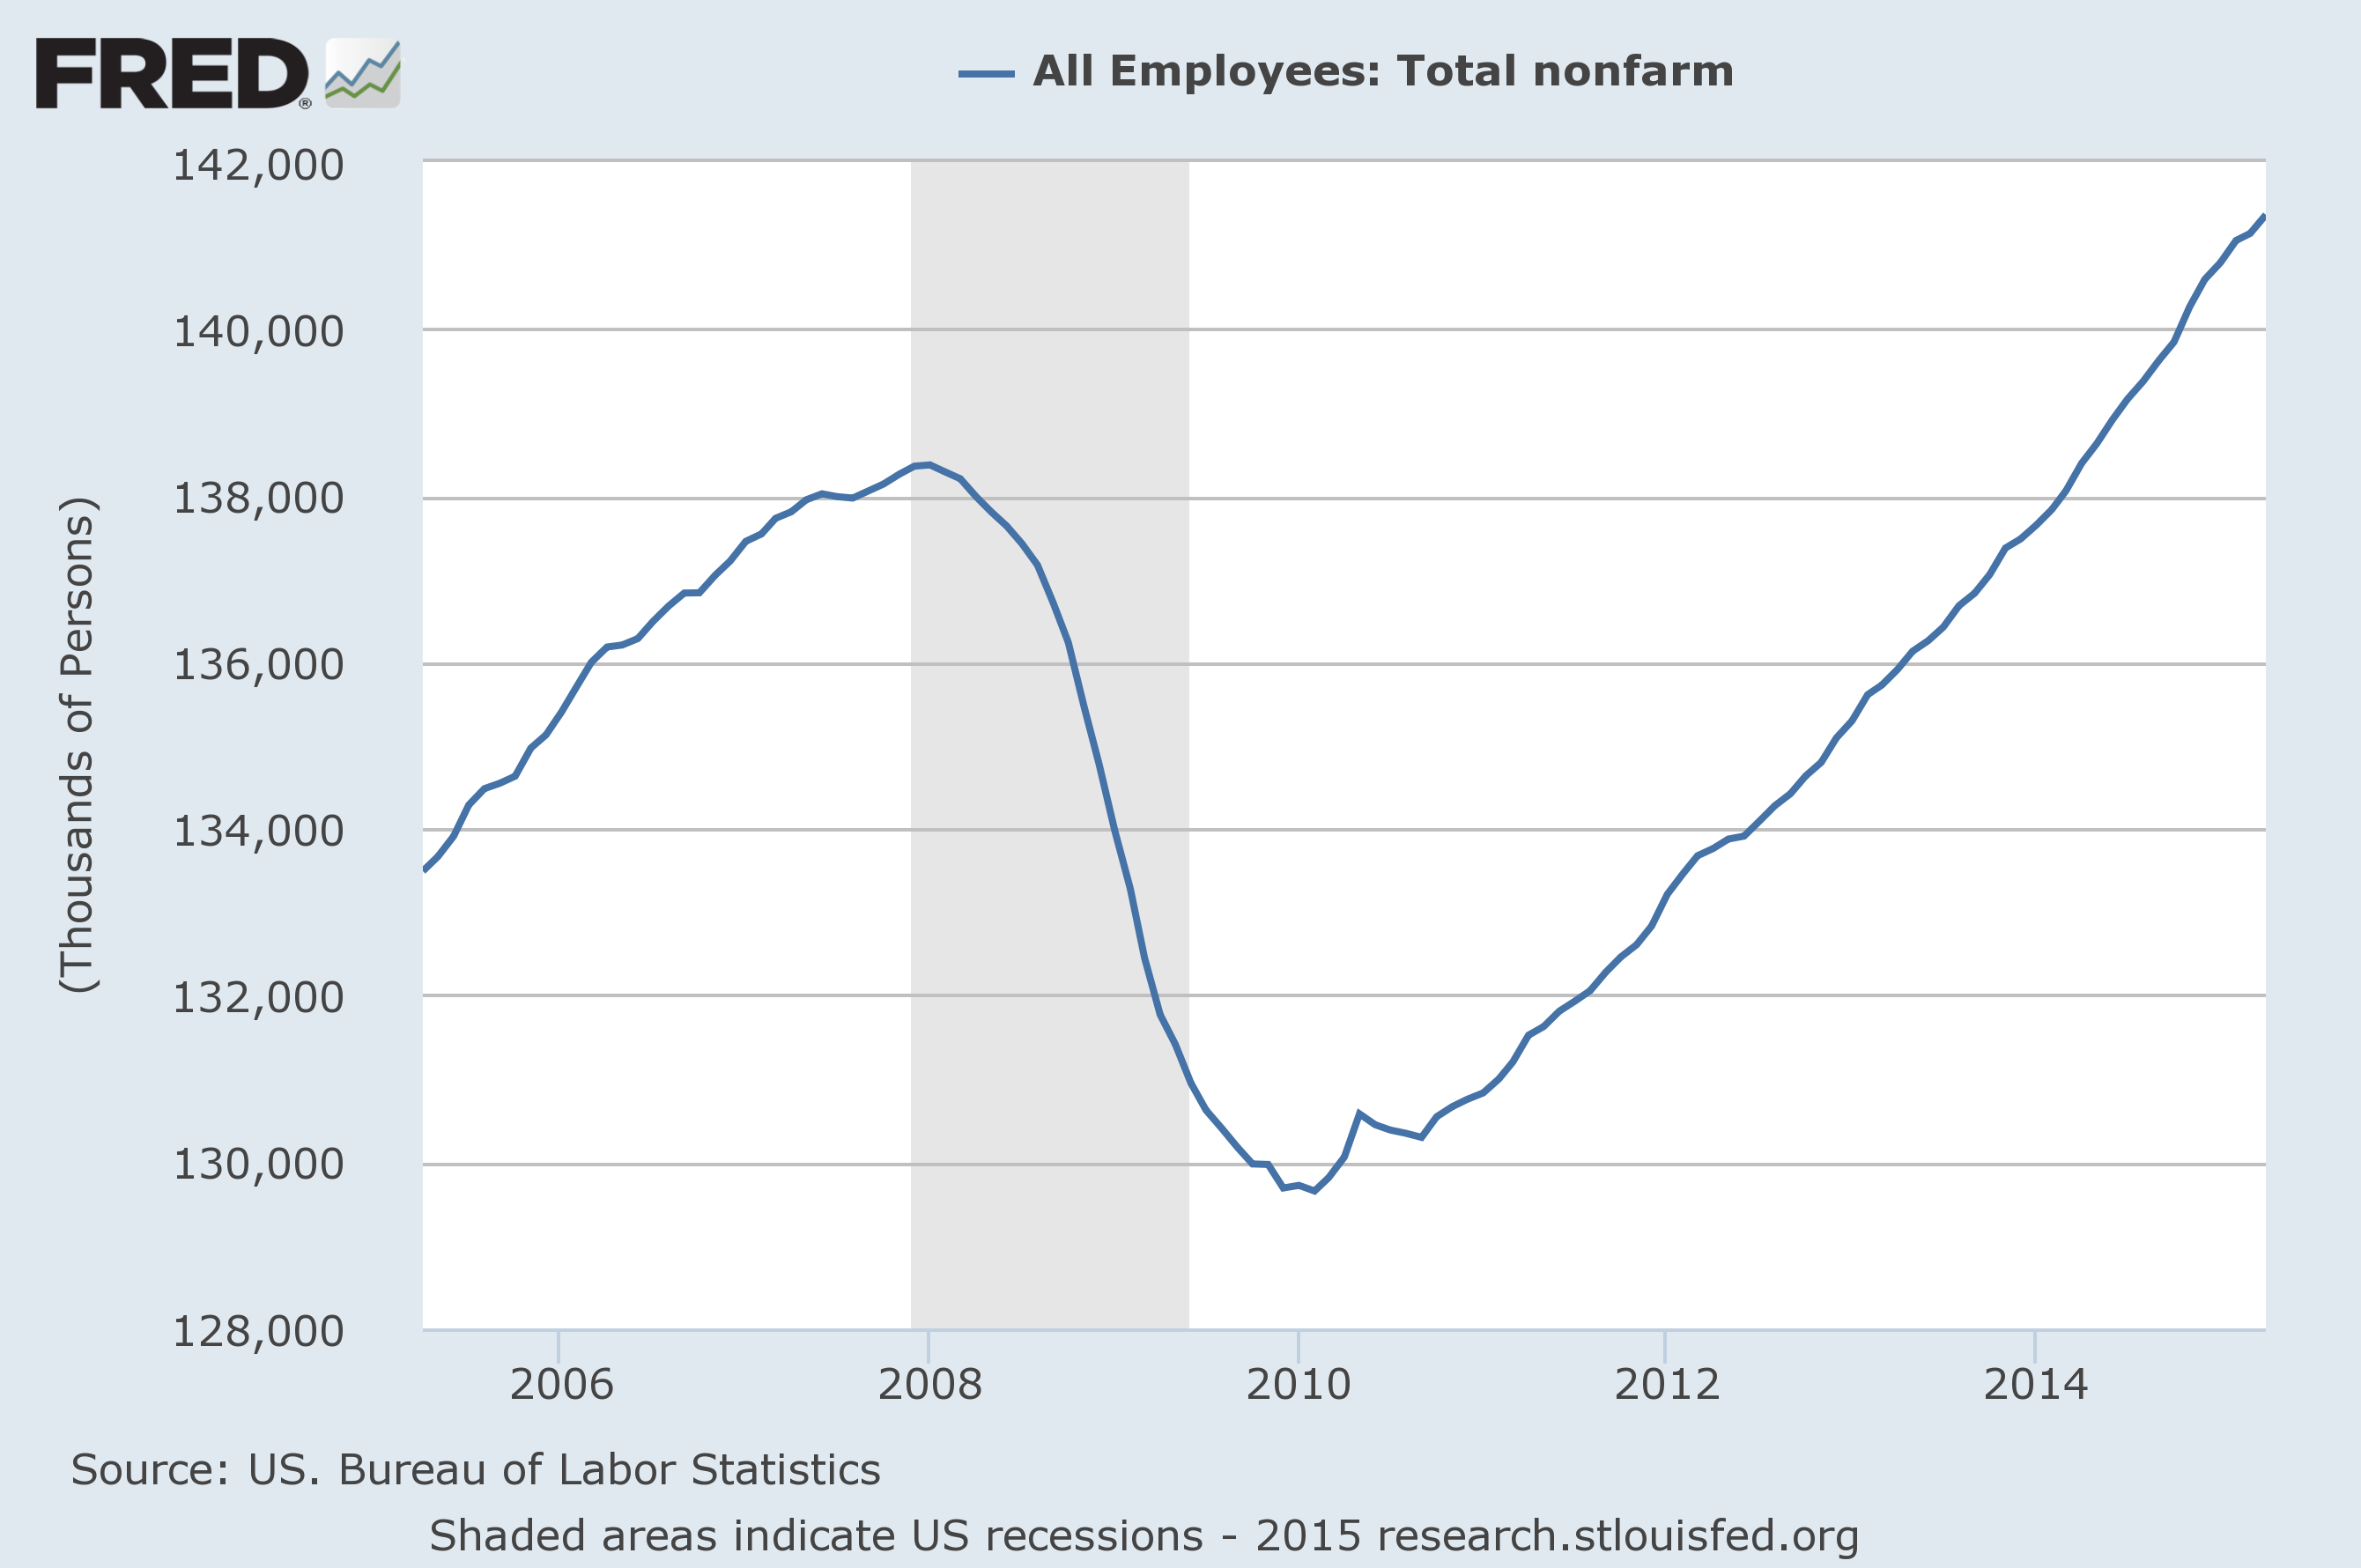
Source: FRED.
Overall, I can’t quarrel with this summary by Council of Economic Advisers Chair Jason Furman:
The first-quarter slowdown was the result of harsh winter weather, tepid foreign demand, and consumers saving the windfall from lower oil prices. The combination of personal consumption and fixed investment, the most stable components of GDP, has grown 3.4 percent over the past four quarters. This solid long-term economic trend complements the robust pace of job growth and unemployment reduction over the last year.
Great piece. Thanks
If the country was at full employment in 2007, we gained only 3 million jobs since then.
If 125,000 jobs were needed each month to keep up with population growth, we needed 11 1/4 million jobs, since 2007, to get back on track.
And, too many jobs, since 2007, have been part-time jobs.
And, part of the “train wreck” is declining real income of younger workers, while older workers postpone retirement to pay-down debt or build-up saving, that has to weigh on spending and borrowing, particularly in housing, and housing-related goods, while student loan debt continues to soar.
This is totally wrong. Older workers aren’t postponing retirement at all. They are speeding it up as the stock market recovered.
Then why, since the last recession, has the 55 and older labor force participation rate held up near the highest level in over 50 years, while the total labor force participation rate had a steep decline and reached the lowest level in 40 years.
And, why is the 55 and older unemployment rate so much lower than the overall unemployment rate.
And, there’s a lot more to it than the stock market:
“In 2012, 62 percent of survey respondents aged 45 to 60 said that the recent recession has made them consider postponing retirement, up significantly from 42 percent in 2010.
“Job losses, pay cuts, and significant declines in home values were among the major factors driving these planned delays…Workers who drew from their savings to help get through the tough financial times of recent years were also more likely to plan a delayed retirement.
Falling interest rates on even relatively stable investments…The yield on a 10-year Treasury bond was just about 3.5 percent two years ago; today it is below 2 percent.
The ongoing shift from employer-sponsored pension plans to employee-managed retirement savings…Without guaranteed benefits, more people may feel the need to work more years, in order to guarantee sufficient income after retirement.”
http://www.salary.com/older-workers-are-delaying-retirement/
I take issue with one part of this analysis: failure to include the effect of the 20% appreciation of the U.S. $ in late 2014. The collapse in exports didn’t just happen because of foreign weakness. It happened because U.S. goods became 20% more expensive. Of the 5 times since 1973 that the dollar has appreciated this sharply, 3 were associated with U S recessions.
Yeah, but that was DX over 110. This is a historically “average” DX.
The sum of real per capita after-tax profits, disposable income, and gov’t receipts decelerated to historical “stall speed” after Q3 2014 to date, coincident with the crash in the price of oil and gasoline.
Retail sales imply sub-1% SAAR real GDP so far for Q2, which in turn implies “stall speed” for the 4-qtr. average or real GDP through Q2.
US Treasury withholding receipts have decelerated from the cyclical peak to a level similar to Mar-May 2008 and Jun-Aug 2001, implying that employment is overstated and growing below 1% for the 12-month average, supporting the weakness in reported retail sales (ex autos financed increasingly by subprime loans) and real GDP.
The proportional aggregate of real GDP per capita for 70-75% of the world economy decelerated below historical “stall speed” in 2014, which historically coincided with recession.
FDI and trade are not growing.
Housing remains weak because Millennials do not have the financial capacity to become mortgage debtors given their meager average real, after-tax incomes, lack of job tenure, inability to save, indebtedness, and medical insurance costs.
The level and rate of increase of household health care spending as a share of income, PCE, and GDP is recessionary for household spending and thus for GDP.
Moreover, housing as a share of GDP no longer contributes materially to GDP growth. Given the cyclical slow or no growth of gov’t spending since 2010-11 (accelerating recently because of Obamacare subsidies) , the net of growth of housing and gov’t spending as a share of GDP is a wash.
The energy sector is in an incipient bust, manifesting in various surveys in the Texas Fed region and parts of the Midwest and Mountain regions dependent upon the shale and energy-related transport sectors. The weakness in these sectors is dragging on orders, IP mfg., and mfg. employment.
The consensus continues to believe that there can’t be a recession without the Fed raising rates and the yield curve inverting, but this condition is not historically consistent during a debt-deflationary regime, which began in 2008 and has persisted in Japan since 1998.
Additionally, with the post-2007 trend for real final sales per capita at ~0% and slightly above 1% since 2010-11, the secular trend rate of growth since 2007-08 is within the margin or error of the estimates for the deflator and import prices. Therefore, the US economy is perpetually vulnerable to experiencing “stall speed” or contraction owing to any number of shocks, including weather, drought, natural disasters, labor actions, energy, popping financial bubbles, and geopolitics.
Finally, as the peak Boomer demographic drag effects bear down in the US, Canada, UK, EZ, Japan, China, and the Asian city-states, we will experience an intensification of the effects of a once-in-history shift in the composition of US household spending from high-multiplier housing, autos (not yet), and child rearing to a permanent, structural transition to low- or no-multiplier spending for property taxes, house maintenance, utilities, insurance, and out-of-pocket costs for medical services and medications. The coincident lack of growth of the labor force and wages/GDP at a record low will continue to cause productivity to decelerate along with the 10-year rate of real GDP per capita hereafter.
Therefore, there will be no “escape velocity” for real GDP growth, despite the Fed’s obligatory forward guidance. ~0% growth of post-2007 real final sales per capita is the “new normal” of “secular stagnation”, i.e., as good as it gets. Therefore, the Fed cannot raise the funds rate (or not much before reversing course) under these conditions. The deceleration of real GDP will cause the deficit/GDP to increase this year, making it more likely than not that the Fed will resume QEternity later in the year.
That isn’t real retail sales. Adjust out for the deflation adjusted to oil price decline, that means real pce is being underestimated. GDP boomed between Q3-2013 and Q4-2014. They have it at 2.95% during that time, but I have it at 4.4% in the same timeframe and may have been 5% without the port strike(which will accelerate the 2nd quarterly). That would change things quite a bit, quite a bit. My guess they under estimated the domestic energy boom was having on fixed non-residential spending. It created a good deal of catchup speed in the economy. So we slow down “real time” to 2.5%. My guess the “weakness” persists until Residential investment accelerates over the course of 2015 and the Arabs run out of gas and drive prices back up. I see domestic energy production in a mid-cycle slump. Lets note low gas prices are fueling a boom: in restaurants. Total bar/restaurant spending is at a bush era high.
Interbank lending has accelerated rapidly in since the 4th quarter of 2014.
BC nailed it
This is the new normal. The fed won’t raise rates, or unwind QE ever.
The logic would suggest that underlying GDP was higher in Q1 than the reported figures. We added 550,000 jobs, which is a very solid quarter for the US and converts into 1.6% annualized GDP growth assuming only labor (no productivity) effects and assuming new entrants have average productivity rates (which I believe Menzie’s post suggested a couple of months back).
We just missed initial unemployment claims falling to the lowest since 1973–so that’s also a strong indicator. They are currently at the lowest level as a percent of the labor force since 1960.
The rig data suggest the US shale recession is ending. My view is that we’ll see a hard re-start of the sector before the end of the summer. To wit: Friday’s BH rig report indicated the Canadian horizontal oil directed rigs rose by 95% last week, and up three fold in the last three weeks, albeit from a low base. We don’t really have more than a leveling from the US side, but I think we’ll see a solid rebound pretty soon. That should also help Q3 GDP data.
Overall, Q1 data was pretty weak, but, like Jim, I don’t think we should read too much into it.
I’m on CNBC tomorrow in the 12-1 pm time slot.
Steve,
Well, we are 2/3 the way through Q2, and rhe weekly reports also show:
1. Johnson Redbook and Gallup consumer spending still stink (Gallup just had its most negative YoY 14 day average this year)
2. Steel production still stinks, down between -5% to -10% YoY
3. Rail carloads still stink, down about -9% YoY in the most recent week
4. The American Staffing Association’s staffing index turned flat YoY in the last two weeks, for the first time since the Great Recession ended.
Bottom line: the most up-to-date evidence is that the weakness in Q1 has persisted more than halfway through Q2.
I’m not sure I see what you see in the data.
Take rail. Coal shipments are down, but we expected that. Oil is flat, which is perhaps a bit better than I expected. Grains are down modestly but within recent averages.
Temporary and contract staffing is flat year over year. But wouldn’t we expect temporary workers to move into full time jobs as the economy recovers? Wouldn’t we expect to see weakness in ‘part time for economic reasons’?
As for steel, 2/3 of steel output goes to automotive or construction, and both these sectors seem to be doing well. About 10% of steel goes to energy, and it’s pretty clear that sector is taking a breather.
Steve, metals shipments by rail are also down. Coal for export is down as the US’s competitors have picked up some demand, due to USD strength.
Steel is also down due to a big increase in steel imports in the last year, again coinciding with USD strength.
As to staffing, first of all, there are plenty of full time temp jobs. Secondly, part time employment peaked about 4 or 5 years ago, and the temp staffing index had gone up almost relentlessly since.
Meanwhile, April industrial production and real retail sales declined.
Weekly steel, rail, and retail sales all turned down between the first of the year and mid-February, and have stayed down. Why shouldn’t we conclude that the part of the economy responsible for the Q1 decline is still down as well?
Don’t know what to tell you. Maybe you’re right. It’s clear that the strength of the dollar has taken a toll. But is that a reflection of economic weakness?
In April, hotels had the best month ever, according to McBride.
http://www.calculatedriskblog.com/2015/05/hotels-best-april-ever.html
Auto sales are the best in fifteen years
http://www.calculatedriskblog.com/2015/04/vehicle-sales-forecasts-best-april-in.html
Housing starts best since 2007, with plenty of running room ahead
http://www.calculatedriskblog.com/2015/05/housing-starts-increased-to-1135.html
Maybe things fall apart, but the data are not uniformly bad. I’ll wait to see until passing judgment.
John, adjust retail sales and PCE for core CPI/PCE deflator and the effect of accelerating costs of so-called “health care”, and the real disposable income and potential spending capacity of the bottom 90-99% is weak and poised to weaken further.
Moreover, real, after-tax profits are contracting, which portends further weakness in real non-residential investment per employee, IP mfg., and thus further deceleration of real GDP per capita.
One has to understand the once-in-history transition of the composition of household spending to discern this clearly and its implications hereafter for the next 5-10 years.
Steven, employment is being overstated/overreported since Aug-Nov 2014, as is typical at the peak of the business cycle and deceleration to, and below, “stall speed” prior to recession, i.e., a “banana”.
Moreover, the US economy is now increasingly dependent upon (1) the unprofitable, unusustainable energy costs of growth of energy extraction, (2) the discretionary spending of the top 1-5%, mostly for luxury imports and no-multiplier domestic spending, and (3) the working class bottom 90% borrowing via subprime loans for “higher education” and autos that they can’t afford to service.
IOW, the US is exhibiting increasing evidence of becoming (already is) a Third World economy/society.
Granted, I concede that no one of vetted professional legitimacy and standing can publicly concede or admit this, and I deeply empathize, believe ME.
But you and I are faithful students of history and human nature, and it will escape neither of us that the collective resources and intention of Anglo-American-Zionist empire, Wall St., the int’l banking syndicate, and the Anglo-American-Zionist imperial military war machine is now preparing for the full application of resources and power against the Middle Kingdom (that the empire created, incidentally) in the Pacific, Central Asia, the Middle East, Africa, and the western hemisphere, which will likely include, if history is our guide, blockades and embargoes against China, as in the case of Japan in the 1930s, precipitating the increasing risk of war of the West against China in the years hence.
Achilles last stand: https://www.youtube.com/watch?v=YWOuzYvksRw
Here’s the link to the interview with Steven Kopits on CNBC:
http://video.cnbc.com/gallery/?video=3000384466
I do think Jim underestimates the impact of the a 20% appreciation of the dollar over the last year (even with the slippage since the peak in March). When nominal economic growth is low in a a low inflation/disinflation environment, even a 1% increase in -net exports is going to flatten the economy and slow growth below the real 2% trend (growth in labor force plus productivity increases). Further, dollar appreciation not only weakens demand for U.S. exports, it reduces demand for U.S. goods and services that compete with foreign imports and places downward pressure on the wages in these sectors, a downward pressure that spreads out through the whole economy. Finally, as Dean Baker points out, the U.S. personal consumption level is not low (except in comparison to the bubble/HELOC fueled spending of the housing bubble years) when examined over the long term. Neoliberals who want to cut social security and medicare and other safety net programs should expect that ordinary people will reduce consumption and try to build savings in order to achieve “the self-reliance” they believe the hoi-polloi should have as their goal. The problem is that as U.S. consumer adopts private austerity, and states around the world adopt public austerity, a question arises as what to do with all the “supply” of stuff and labor coming into the world from societies previously not part of the global capitalistic economy.
i have trouble with the revision to imports….recall that our imports jumped in March when the West coast dock strike ended and the ships were unloaded, and as a result the March trade deficit increased 43%…i went through the itemized list of March imports and found for instance, that imports of consumer goods rose by $9,013 million to $54,164 million on a $1,677 increase in imports of cell phones and similar household electronics, a $1,293 increase in imports of synthetic textiles, and a $981 million increase in our imports of furniture and similar household goods..in addition, our imports of cotton apparel and household goods, footwear, pharmaceutical preparations, toys, games, and sporting goods, televisions and video equipment. other consumer nondurables, non textile apparel and household goods, household appliances cookware, cutlery, tools, and camping apparel and gear all also rose by more that $250 million each…those increases almost certainly did not indicate an increase in consumption of consumer goods by that much, but rather just an offloading of ships…there were similar increases in every other catagory of imports except petroleum and similar industrial supplies…
since those goods were not consumer, i expected they’d show up as an increase in wholesale or retail inventories…did not show up in March business sales, business inventories, or anywhere in investment…so while BEA applied their GDP formula to subtract imports from 1st quarter GDP as they normally would, the reason imports are subtracted is because they represent consumption inventories or investment that was previously added to GDP that was not produced here…considering that those March imports don’t seem to have been added to any of the other national accounts, they shouldn’t subtract from GDP…where those March imports went is still a mystery, perhaps they’ll show up in consumption or inventories in the 2nd quarter, but from here it appears that the subtraction of the March jump in imports was misallocated by the automated GDP algorithm …
A large share of imports are for intermediate use in production by the business sector. These imports would not show up in inventory change for the quarter because they are used in production before the end of the quarter. These imports (along with imports that go directly into final use) are subtracted in calculating GDP to offset the portion of the value of final goods that incorporate foreign production.
It is important to remember that if their is a problem with first quarter GDP seasonal adjustment there is a problem with the other quarters with the same but opposite signs. The monthly or quarterly seasonal adjustment factors have to sum to one (1).
If we add 2% to first quarter growth we also have to subtract 2% from the other quarters. A different seasonal adjustment will not change the year-over-year growth rate. If we though trend real growth was some 2%, after correcting the seasonal adjustment we should still think that trend growth is some 2%.
The difference between income and production is a more significant problem because it suggest we have been underestimating real GDP growth. I suspect the problem may stem from growing inequality and the more rapid growth of non-labor income. This could also be the source of the seasonal adjustment problem.
Right, and some of the increased spending will be for repairs and increased maintenance costs from the harsh winter. This will cut into disposable/discretionary income and property damage could cut into savings and also could drive up savings rates as these increased expenses will cause show previous savings inadequate and also to recoup losses. The belief that a climate shift which will make these harsh winters more likely over the next 10-15 years would also demand more savings.
I should have said annual growth rather than trend growth.
JDH wrote:
“The primary factors that brought GDP growth down from the BEA’s original estimate were stronger growth of imports…”?
Professor,
I am confused by this statement. It is my understanding that both imports and exports were down for the first quarter 2015. Are you talking about the net?
This appears once again to reveal one of the serious weaknesses of using GDP to measure growth. Because imports are negative they are added to exports. Even though both are down the net of the two gives the impression that trade is adding to the growth of the US economy. But in truth this is very alarming. What we are seeing is a significant decline in world trade unlike any for the three quarters year. A decline in world trade cannot be a good thing no matter what the math of the GDP trade component indicates. Am I reading something wrong?
If one uses a simple cointegration model for log_GDP and log_Personal Consumption Expenditures, the result is a forecast of about 2.0% SAAR GDP growth. Is this just happenstance that it agrees with the “reconciling methods” described above or does it give some support from a simple model?
@Ricardo: there were large inflation adjustments to imports and exports…the deflator for imports was negative 16.6%, the deflator for exports was negative 9.8%; hence both were much higher than nominal in real terms…
our real exports fell at a 7.6% rate and subtracted 1.03 percentage points from 1st quarter GDP growth; our real imports rose at a 5.6% rate and hence also subtracted another 0.87 percentage points from the quarter’s growth rate…hence the 1.90 percentage points subtracted from GDP by trade were greater than all the additions elsewhere…
Thanks. I guess I misread it.
McBride is right. Housing starts is the key. And don’t look at the noise.
Next quarters will be shiny.
Jeb Bush looks already worried.
Ricardo– if you buy a foreign mad car how doe it show up in GDP?
It shows up in two places. One is an increase in personal consumption expenditures, Second, it shows up as a negative in the trade numbers.
These offset each other so the net impact is zero. That is what it should be as GDP measures what is American made and that foreign caq is not American made.
Exactly how do you think the BEA should treat your foreign car purchase in the GDP accounts.
Spencer,
Why to you persist in agreeing with me but pretending that I am somehow disagreeing with you? Because you are correct that trade balances it should not be part of a GDP calculation. It is based on illogical assumptions. But that is only one of the problems with the was GDP is calculated. Essentially it is a measure of government spending not production.
Spencer,
I was pondering why we are not communicating on this and it struck me that perhaps this question will help with the understanding.
What happens if the personal consumption expenditure is booked in one month but the trade negative does not show up until two or three months later, or vice versa? Trade does balance, but if the data is recognized in different periods, it can give the appearance of differences in GDP depending on the period. This is a potential variance that is cooked in the books.