Today I discuss the factors that brought oil prices so far down and more recently back up.
World oil production was essentially stagnant for seven years beginning in 2005. Field production of crude oil averaged 73.9 million barrels a day in 2005 and averaged 74.7 mb/d in 2011.

Monthly world field production of crude oil in thousands of barrels per day, Jan 1973 to Nov 2015. Vertical line at Jan 2012. Data source: Monthly Energy Review.
That plateau was followed by a dramatic surge in world production of 3.1 mb/d between January 2012 and January 2015. More than all of that increase can be accounted for arithmetically by the 3.2 mb/d increase in U.S. production, spurred by horizontal fracturing of shale formations. Net production outside the U.S. actually decreased 100,000 b/d during these 3 years, though far from uniformly across producing countries, with 800,000 b/d increases each from Iraq and Canada helping to offset production declines in places like Libya, Iran, and Mexico.

Monthly U.S. field production of crude oil in thousands of barrels per day, Jan 1973 to Nov 2015. Data source: Monthly Energy Review.
U.S. production continued to rise in the first few months of last year, but fell almost 400,000 b/d between March and November to end the year about where it began. The EIA’s Drilling Productivity Report model predicts that field production from the major U.S. shale plays will have fallen another 400,000 b/d from November values by April. Last week the Wall Street Journal passed along this assessment:
In the Bakken Shale region, prices will need to be above $60 for benchmark West Texas Intermediate crude for at least three months before the area sees a meaningful uptick in drilling activity, said Lynn Helms, Director of North Dakota’s Department of Mineral Resources.
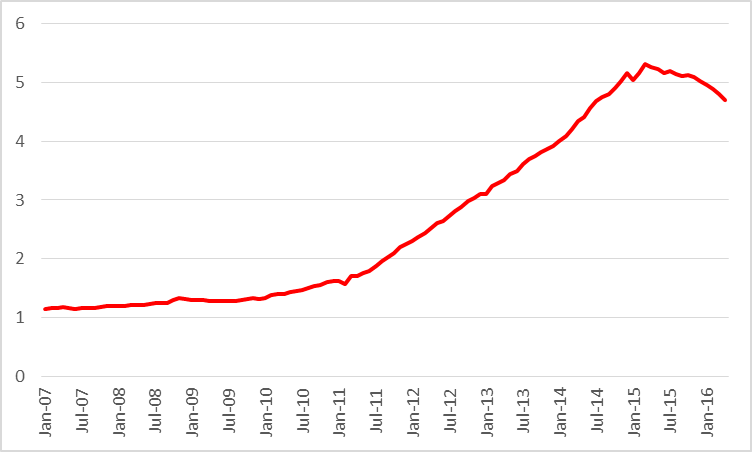
Actual or expected average daily production (in million barrels per day) from counties associated with the Permian, Eagle Ford, Bakken, and Niobrara plays, monthly Jan 2007 to Apr 2016. Data source: EIA Drilling Productivity Report.
But despite the situation in the U.S., world production of crude oil increased another 1.1 mb/d in the first 11 months of 2015. Here the big story has been Iraq, whose production was up almost 1 mb/d even though ISIS continues to control large non-oil-producing sections of Iraq.

Monthly Iraqi field production of crude oil in thousands of barrels per day, Jan 1973 to Nov 2015. Data source: Monthly Energy Review.
Saudi production was 400,000 b/d higher in November than in January, though that just leaves its current monthly production within the range we’ve been typically seeing over the last three years.

Monthly Saudi Arabian field production of crude oil in thousands of barrels per day, Jan 1973 to Nov 2015. Data source: Monthly Energy Review.
Another key factor keeping oil prices low has been Iran. The country claims to have increased production by 400,000 b/d since sanctions were lifted in January, and has plans for further increases. However, so far Iran has been encountering some logistical problems in selling the oil.
It’s important to emphasize that it’s not just developments on the supply side that have been driving recent oil price movements. The graph below compares the prices of a number of commodities over the last 16 months, which share not only the same dramatic downward trend, but also all experienced price rallies in the spring of last year and again over the last 2 months. This is true not just for the dollar price of copper, silver, lumber, and cattle, but for the dollar price of a euro as well.
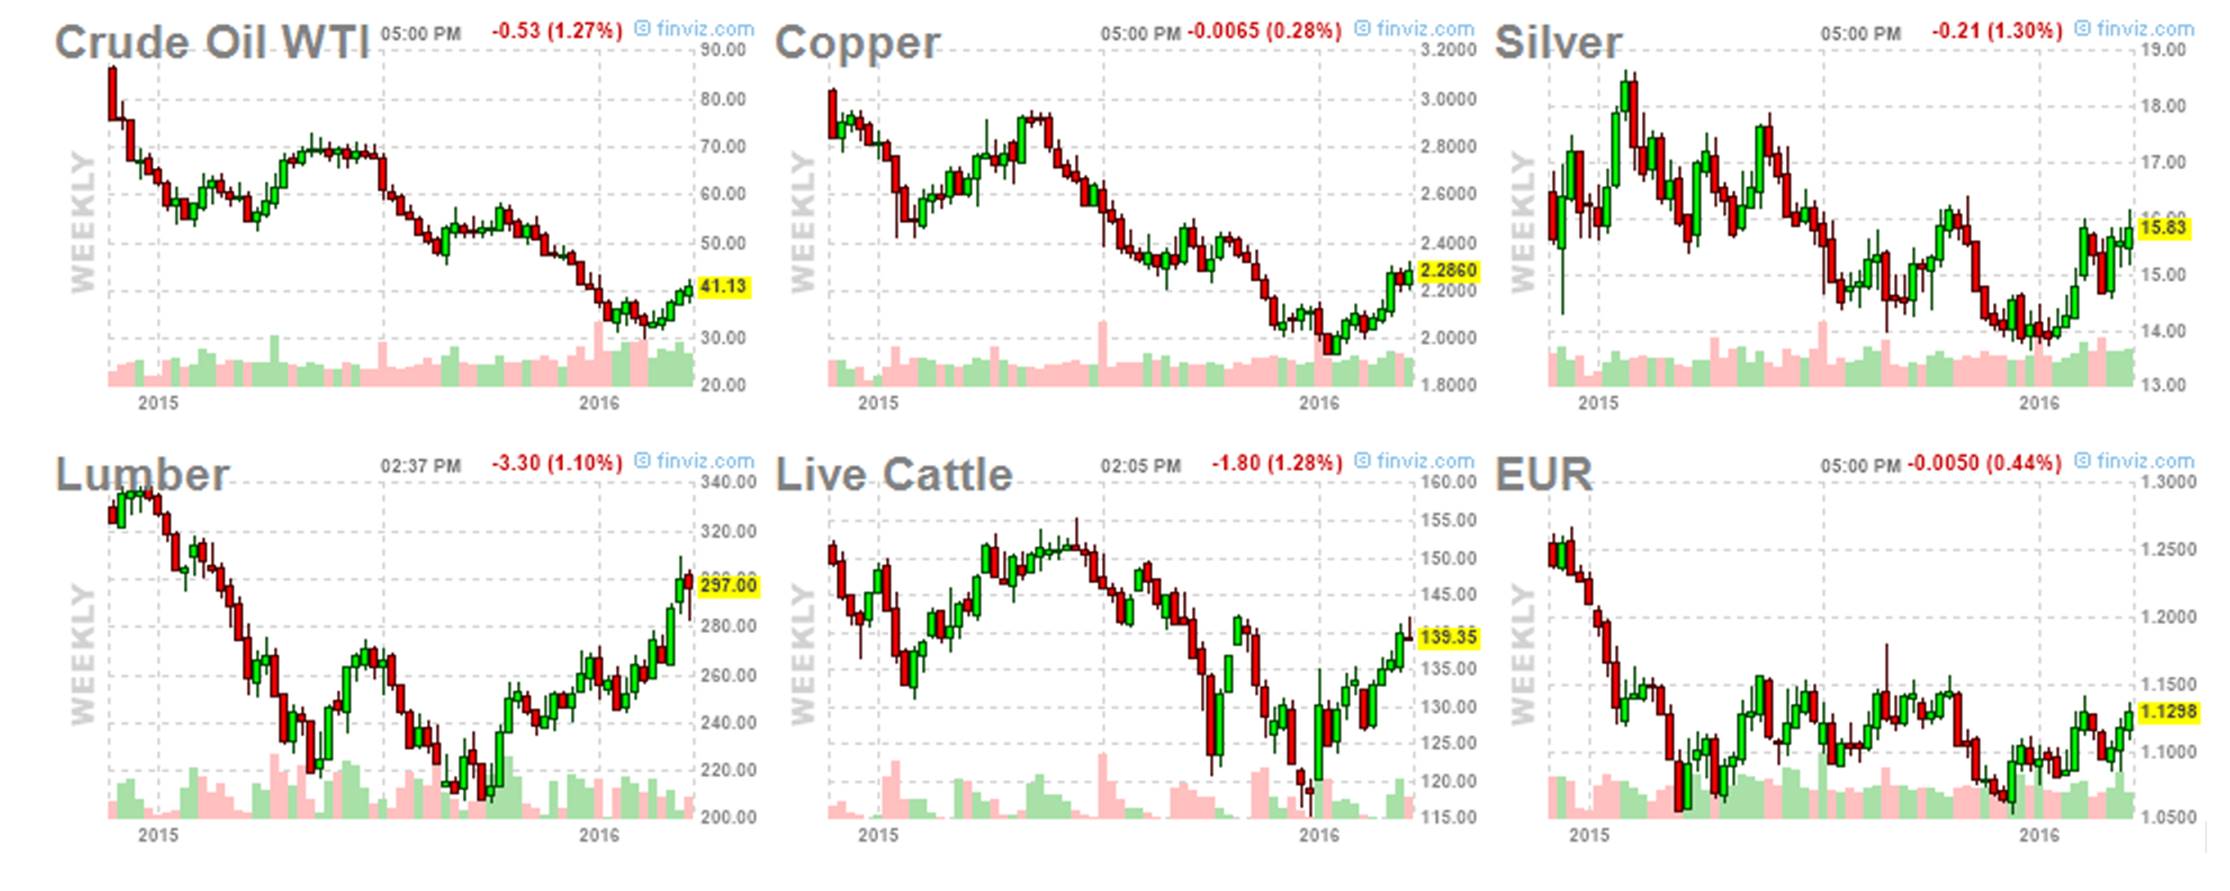
Weekly futures prices, Oct 2014 to Mar 2016. Source: Financial Visualizations.
The recent comovement between the dollar price of oil and the dollar price of the Chinese yuan is even more striking, as plots of the cumulative percent change (measured in 100 log points) in those two series since Sept 2014 demonstrate.
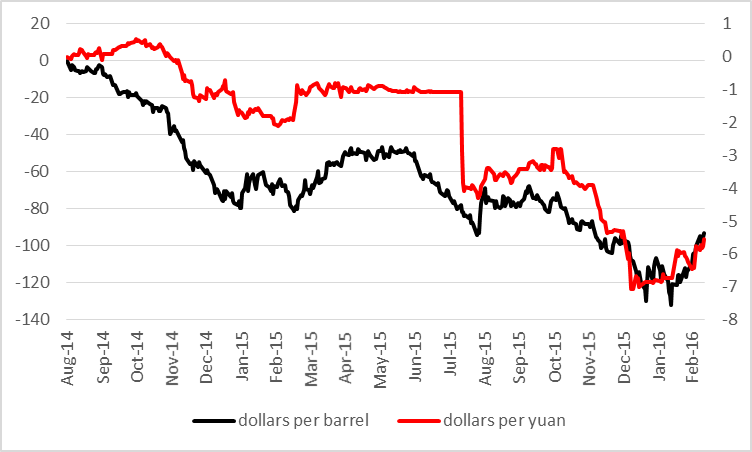
One hundred times the cumulative change since Aug 29, 2014 in the natural logs of the spot price of West Texas Intermediate (left scale, from DCOILWTICO on FRED) and of the dollar price of a euro (right scale, from reciprocal of DEXCHUS on FRED), daily, Aug 29, 2014 through Mar 11, 2016.
Note well that the above graphs do not imply that oil prices did not change if you measured them in euros or yuan. Oil prices and exchange rates in the two last sets of graphs have been plotted on very different scales. The price of oil is up 44% since January 20, but the euro has only appreciated by 2.5% and the yuan by about 1% since then. While it is certainly not the case that movements in the exchange rate are the cause of movements in the price of oil, it is quite clear from the graphs that these variables are responding to some common forces.
One important common factor is concerns about economic weakness in Europe and China, which contributed to their weaker currencies relative to the dollar as well as to slower growth in forecast oil demand. But is there evidence that the economic outlook has improved over the last two months? Chinese leaders have been suggesting that is indeed the case, and IMF Chief Christine Lagarde is encouraged by recent policy moves in Europe, Japan, and China. But many other observers remain pessimistic.
Another factor in the recent retreat of the dollar could be the Fed’s move toward a more dovish posture for 2016. Some have argued that this could mean a faster economic growth rate than might have been forecast in December and thus more robust oil demand. On the other hand, the reason for the Fed’s change would seem to be newly perceived weakness in some of the U.S. and global economic indicators.
To summarize, strong supply and weak demand contributed to the collapse of oil prices through the first part of this year. Which if either of those fundamentals has changed since then is substantially less clear at this point.
That isn’t much of a retreat of the dollar.
A continuing reminder that what the EIA calls “Crude oil” is actually Crude + Condensate (C+C) , and the available data suggest that actual global crude oil production (45 API Gravity and lower crude oil) has been flat to down since 2005, while global natural gas production and associated liquids, condensate and natural gas liquids (NGL), have so far continued to increase.
In regard to the global production/inventory oversupply, there are two issues–the quantity and the quality of the oversupply.
The following WSJ article addresses the quantity issue:
WSJ: Crude Mystery: Where Did 800,000 Barrels of Oil Go?
(For access, do a Google search for title)
http://www.wsj.com/articles/crude-mystery-where-did-800-000-barrels-of-oil-go-1458207004
In regard to quality, my contention is that the global production/inventory oversupply is a house of cards built on an unstable foundation of actual global crude oil production (45 API & lower crude oil) that requires vast upstream capex in order to keep actual crude oil production from crashing:
http://oilpro.com/post/22276/estimates-post-2005-us-opec-global-condensate-production-vs-actua
And of course, Global Post-2005 Cumulative Net Exports (CNE) depletion marches on. I estimate that from 2006 to 2015 we may have already burned through about one-third of Global Post-2005 CNE:
http://peakoilbarrel.com/texas-oil-production-still-on-a-plateau/#comment-561436
Emad Mostaque is an oil analyst who was bearish on oil prices in the summer of 2014 (contrary to prevailing opinion), but who was bullish on oil prices in November, 2015 (also contrary to prevailing opinion). Following is an excerpt of a November, 2015 article on Mr Mostaque’s analysis.
The link below has a video clip that is well worth watching. The article I linked to has a small error. The article suggested that Mostque was expecting oil prices as high as $130 by late 2016; he actually said it was possible that oil prices could hit $130 in 2017, before falling back to an $80 to $100 equilibrium range. He also touched on net oil exports, noting that Saudi net oil exports this year could easily be a million bpd below their 2005 rate (and I concur).
It’s interesting to see what has transpired since the article was published.
Monthly EIA data (the Annual Energy Review) shows that US Crude + Condensate (C+C) production fell from 9.7 million bpd in April, 2015 to 9.2 million bpd in January 2016, and EIA weekly estimates are putting current US C+C production at around 9.1 million bpd. It’s a pretty good bet that year over year US C+C production will have fallen from 9.7 million bpd in April, 2015 to below 9 million bpd in April, 2016.
It’s also interesting to look at US net total liquids imports, which fell from 5.4 million bpd in January, 2014 to 4.8 million bpd in January, 2015, and then increased again, to 5.6 million bpd in January, 2016, a year over year increase of 0.8 million bpd. And we have seen a similar increase in net crude oil imports that refineries need, with EIA weekly supply data (four week running average data) showing that US net crude oil imports rose from 6.9 million bpd in January, 2015 to 7.5 million bpd in January, 2016. (US net crude oil imports are now up by 0.8 million bpd year over year, March, 2015 to March, 2016, most recent four week running average data.)
In other words, the US becoming increasingly dependent on net oil imports, and as I have outlined several times, in my opinion the current global liquids oversupply is a house of cards built on an unstable foundation of actual crude oil production that requires vast upstream capex expenditures in order to keep actual crude oil production from crashing–and that upstream capex is falling dramatically.
Oil could hit US$130 as U.S. output ‘falls off a cliff’: Analyst (November, 2015)
http://www.bnn.ca/News/2015/11/10/Oil-could-hit-US130-as-US-output-falls-off-a-cliff-says-analyst.aspx
Excerpt:
Annual Energy Review (EIA):
http://www.eia.gov/totalenergy/data/monthly/pdf/sec3_3.pdf
A good Bloomberg article, with an interesting chart from Rystad Energy, showing estimated new production versus the declines from existing production:
http://www.bloomberg.com/news/articles/2016-03-22/drillers-can-t-replace-lost-output-as-100-oil-inheritance-spent
Some interesting data were posted by Prof. Tad Patzek on LifeItself.
http://patzek-lifeitself.blogspot.co.at/
Much as I like Tad, there is an important fallacy of construction in his analysis, which you linked.
Note that in the second graph, he shows the ‘Hubbert Peak’ for the Eagle Ford as occurring in 2015. This is absolutely incorrect. Eagle Ford and Bakken production did not peak due to ‘peak oil’ issues, but rather because oil prices collapsed. Indeed, the entire oil price narrative of the last eight months has been a process of price discovery to establish where US shale output actually begins to fall. The problem was not that the major shale plays were spent, but rather that they were so prolific that they (along with Iraq and Saudi Arabia) destroyed oil prices.
If oil prices return to $60, expect these plays to start ramping up again.
Prof. Hamilton,
What is the situation on demand side?
1. Yes, due to economic situation, demand from EU and China might have come down. But there are not actual figures to confirm how much of demand has actually came down? Actually, The USA demand for oil has also drastically fallen due to increase in the domestic shale oil production.
2. The low oil prices gives many EME’s and Poor economies to build up there reserves and buy more of the cheap oil. For example, India and many other countries actually increasing their storage facilities. world over, the countries are trying store as much as possible, but are these actions does not able to create acquitte demand in the market? USA storage capacity is almost full, ranging around 90%.
3. is it that the world has moved from “only oil” usage to alternative energy sources due to advancements in technology. The use of LPG, electricity, solar, biol fuels etc actually seized the oil demand growth. I am not sure, how to check this point empirically, I will be great full if, someone could explain the concerns …..
Ashnaidu –
The EU led global oil demand growth in 2015. China’s demand continues pretty good, with some disagreement about the volumes in 2015, but figure 300-500 kbpd / year. The political risk in China is now large, complicating the demand outlook.
Korean oil demand and US gasoline demand are very strong; and exceptionally strong in India. We saw something like 3 mbpd of ‘missing barrels’ last quarter. I think demand growth in the last quarter is likely substantially underestimated. But good luck finding numbers to support that in real time.
There is adequate storage. We are not using floating storage in any material way, and of course, the current contango (12 month futures spread) of $3.50 is woefully inadequate to incentivize floating storage. For that, we’d need $1.20-$1.50 / barrel per month, of a difference between the 12 month and spot price of oil running at about $15-18 / barrel. The contango has never been that wide during this entire glut period, ie, the glut is probably smaller than thought. See Jeffery’s missing barrels article above.
As for alternative fuels, oil demand growth was strong in 2015, I would guess in the 2.1-2.3 mbpd / year growth range by the time the revisions have settled. Expectations for 2016 have been muted. I think the reality will be much higher if President Xi resists the urge to melt down the Chinese economy or embroil East Asia in a naval war.
Drivers of oil demand growth will likely outweigh the impact of renewables for some time to come. I do not expect to see a material improvement in US mpg from here on out, but improvements to date will continue to cascade through the fleet, increasingly efficiency by 1% or so per year per VMT for the next 3-5 years.
In regard to global consumption, EIA data indicate that global total liquids consumption rose by about 3 million bpd from 2013 to 2015 (annual average data). In contrast, during the prior large annual oil price decline, global total liquids consumption fell by about 2 million bpd from 2007 to 2009.
In regard to US total liquids consumption, the EIA Annual Energy Review provides monthly and annual data for key liquids production and consumption metrics. One item missing from this data base is net crude oil imports, but it provides a lot of useful data:
http://www.eia.gov/totalenergy/data/monthly/pdf/sec3_3.pdf
Because of rising US production and declining consumption (relative to 2005), annual US net total liquids and crude oil imports have been trending down on an annual basis, through 2015. However, recent monthly data show a pronounced increase in US net imports, and US annual total liquids consumption (total product supplied) in 2015 was the highest since 2008.
An excerpt from my comment up the thread:
In other words, the US is becoming increasingly reliant on imported oil, and it won’t be long before the US is importing the majority of Crude + Condensate (C+C) processed daily in US refineries. We are currently (net) importing 48% of the C+C processed daily in US refineries.
Ok, this is really hard to follow – does this mean that supply of actual crude is falling (therefore rising imports), and the rising supplies are mostly condensate?
The available data strongly suggest that actual global crude oil production (45 API Gravity and lower crude oil) has been flat to down since 2005, while global natural gas production and associated liquids, condensate and natural gas liquids (NGL), have so far continued to increase. And IMO, most, if not all, of the post-2014 build in US and global Crude + Condensate (C+C) inventories consists of condensate.
Note that the EIA estimates that about 40% of US Lower 48 C+C production in 2015 exceeded the maximum API Gravity limit for WTI crude oil (42 API Gravity), and 22% of US Lower 48 C+C production in 2015 exceeded 45 API Gravity. Basically, my thesis, supported by multiple articles (see article below), is that US refiners–and perhaps global refiners–probably don’t want any more of the really light stuff.
A link to, and and an excerpt from, my article on the topic:
Estimates Of Post-2005 US, OPEC & Global Condensate Production Vs. Actual Crude Oil Production
http://oilpro.com/post/22276/estimates-post-2005-us-opec-global-condensate-production-vs-actua
US production declines are coming principally from US shale plays, thus condensate production is falling faster than lower API crude from conventional wells.
Rising imports are being drawn to the US due to the availability of modern, commercially available storage. Increases in US crude stocks have almost nothing to do with increasing US oil consumption, although this should change as US production falls off in earnest in the next six months.
Jeffrey –
Since Jan. 1, crude oil imports are up 44.2 mb (630 kbpd more than the same period in 2015).
Crude stocks are up 40.8 mb. Thus, almost the entire increase in imports went into storage. A little less than 50 kbpd represented increased US import dependence (albeit, that number will rise sharply in the next six months).
So, it is true that US oil production is down, and consumption is up. However, the increase in net crude imports is really about the contango and low oil prices, rather than about increasing US import dependency, at least for the moment.
Steven,
Or, in the alternative, US Crude + Condensate (C+C) inventories are building because US refiners (and perhaps global refiners) hit, in late 2014, the limit of how much condensate they could process if they wanted to maintain the full spectrum of refine product output.
A case history of US refiners rejecting “foul” blends of heavy crude and condensate:
http://www.reuters.com/article/us-usa-refiners-trucks-analysis-idUSKBN0MJ09520150323
Of course, what they are actually rejecting is the condensate component.
EIA estimates of US Lower 48 Crude + Condensate (C+C) production in 2015, by API Gravity:
https://www.eia.gov/todayinenergy/detail.cfm?id=23952
22% of US Lower 48 C+C production in 2015 exceeded 45 API Gravity, and about 40% exceeded 42 API Gravity, the maximum upper limit for WTI crude oil, so when we hear the WTI crude oil price quoted, it’s important to remember that about 40% of US Lower 48 C+C production cannot be sold as WTI crude oil, because the API Gravity is too high.
The article is a year old, Jeffrey. Exports bans have been lifted.
Steven,
As you know, condensate is a byproduct of natural gas production, and I believe that Bentek estimated that US gas production hit an all time record high in February, 2016. In regard to US exports, I suspect that both the global and the US markets are oversupplied with condensate.
Some 2016 articles:
The following (February, 2016) RBN Energy article touches on some of the issues discussed in a Reuters article, from last year:
U.S. refiners turn to tanker trucks to avoid ‘dumbbell’ crudes (March, 2015)
http://www.reuters.com/article/us-usa-refiners-trucks-analysis-idUSKBN0MJ09520150323
Note that the author of the RBN Energy article touches on two key issues: (1) Insufficient heavy crude to offset the flood of condensate, thus making it more difficult to create their “Synthetic WTI” blend and (2) Weak demand for the Synthetic WTI blend itself.
Just My Imagination – How Full Is Cushing Crude Oil Storage Capacity, Really? (February, 2016)
https://rbnenergy.com/just-my-imagination-how-full-is-cushing-crude-oil-storage-capacity-really
Another (March, 2016) article on the mismatch between what US oil companies are producing and what refiners need:
US crude refiners ask for more specifications as shale shifts oil at Cushing (March, 2016)
http://blogs.platts.com/2016/03/16/us-crude-refiners-specifications-shale-cushing/
And IMO, this is probably a global phenomenon. Note that the implied condensate yield per BCF of dry gas production was greater for OPEC than for the US, for 2014:
http://oilpro.com/post/22276/estimates-post-2005-us-opec-global-condensate-production-vs-actua
Oilprice.com has an article which noted that US Crude + Condensate (C+C) exports are down year over year, after the ban on crude oil exports was lifted, and they are right.
Based on most recent year over year four week running average EIA data:
Week ending 3/20/15 (million bpd):
C+C Exports: 0.5
C+C* Imports: 7.3
Net C+C Imports: 6.8
Net Total Liquids Imports: 4.8
Week ending 3/18/16:
C+C Exports: 0.4 (-0.1)
C+C* Imports: 8.1 (+0.8)
Net C+C Imports: 7.7 (+0.9)
Net Total Liquids Imports: 5.3 (+0.5)
*Presumably all actual crude oil (why would US refiners import condensate?)
As I have frequently stated, in my opinion we have both a US and a global oversupply of condensate, and IMO these numbers seem to serve as additional confirmation of that assertion. And I suspect that US, and perhaps global, refiners in late 2014 hit the upper limit of how much condensate that they could process, if they wanted to maintain their output of distillates and heavier refined products. And I suspect that most, if not all, of the post-2014 build in US C+C inventories consists of condensate.
And my contention is that the global production/inventory oversupply is a house of cards built on an unstable foundation of actual global crude oil production (45 API & lower crude oil) that requires vast upstream capex in order to keep actual crude oil production from crashing:
http://oilpro.com/post/22276/estimates-post-2005-us-opec-global-condensate-production-vs-actua
As a non-economist and by no means an oil expert, my opinion should be heavily discounted, but 10 years ago I saw a flow chart of how oil prices are set–a complicated virtually Rube Goldbergian set of maybe 20 different inputs with complex feedback loops built in. The author suggested that oil prices have, as a result of this complexity (in which long term market fundamentals played little role) that oil prices have very little actual information content. In other words using oil prices to set a country’s energy policies was a chump’s game.
At the time I thought this was questionable. However after watching the oil price spike and collapse of the last decade and the collapse of recent months–I have begun to wonder if he wasn’t more correct than I knew.
And by the way, Jim, I think this analysis is right on track. A lot seems to move with the yuan. I think the algos are programmed to equate yuan devaluation with falling global demand, and so, if the yuan devalues, all these programs–including for oil–sell off.