Horizontal fracturing of tight hydrocarbon-bearing formations was responsible for a phenomenal resurgence in U.S. oil production, which rose more than 4 million barrels per day from 2010 levels before peaking in April of last year.

Monthly U.S. field production of crude oil in thousands of barrels per day, Jan 1973 to Dec 2015. Data source: Monthly Energy Review.
Only 1/4 of the drilling rigs that were active in the U.S. shale oil producing counties in November 2014 were still on the job this February. Despite this massive cutback in capital spending, total U.S. crude oil production had fallen only 400,000 barrels a day (a 4.5% drop) as of December.
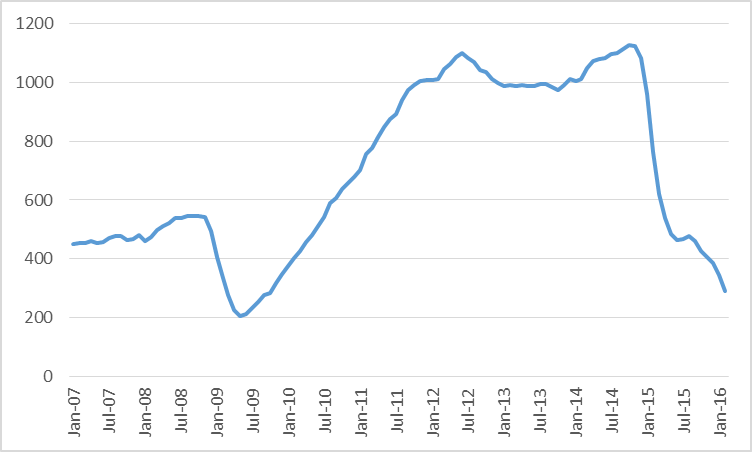
Number of active oil rigs in counties associated with the Permian, Eagle Ford, Bakken, and Niobrara plays, monthly Jan 2007 to Feb 2016. Data source: EIA Drilling Productivity Report.
The reason that U.S. oil production has not fallen more is remarkable efficiency gains. Occidental Petroleum described a series of measures they have taken that have reduced the time it takes to complete a well by up to 50%, which could enable it to drill the same number of wells each month using half the number of rigs. Other innovations are allowing much more oil to be produced from each completed well. Decker, Flaaen, and Tito (2016) note that the average new well in the Bakken produced 200 barrels/day in 2007. Last year the number was 400 b/d. However, it remains true as ever that production from an average new well will have fallen off by half within a year of operation.
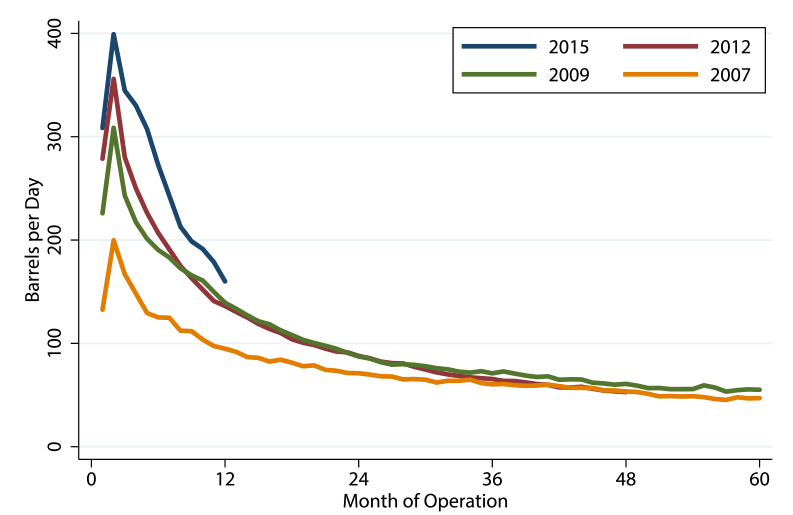
Average Bakken well decline rates by year (production from the well n months after completion). Source: Decker, Flaaen, and Tito (2016).
Drillers have also been able to get deep cost discounts from the companies that sell to them as a result of the market bust. These along with the productivity gains have significantly lowered the price of oil at which the producers would be able to cover their costs (including capital costs). A survey by the Federal Reserve Bank of Kansas City asked operators (primarily working in the Niobrara Shale) what oil price would be needed in order for drilling to be profitable in their area. The median response was $60 a barrel, down significantly from the $79 estimate of a year earlier, but still far above current prices. Many analysts expect a third to a half of U.S. oil companies to file for bankruptcy in 2016.
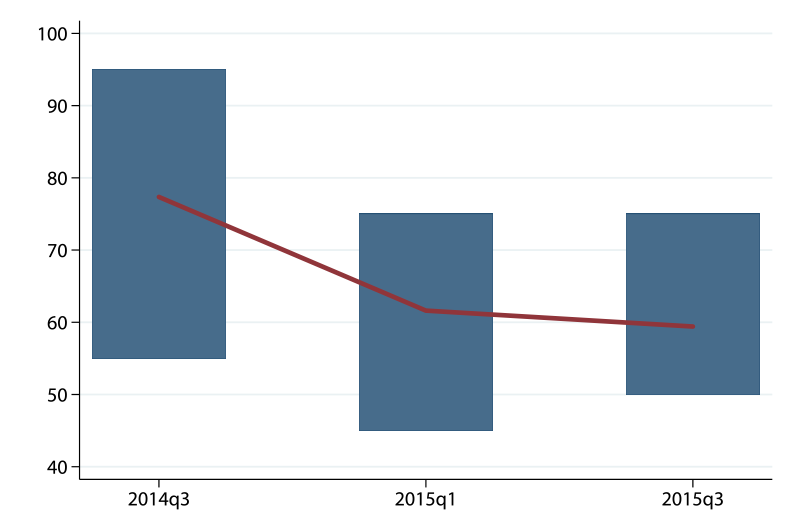
Median response (red line) and range of responses (blue rectangles) to price needed for profitability. Source: Decker, Flaaen, and Tito (2016).
The table below reports operating income for five of the most important companies in the shale oil boom, which between them produced almost a million barrels a day in 2014. Between them they lost $32 billion in 2015, a year when the average price of WTI was $49/barrel. So far in 2016 we’ve averaged $33/barrel.
Despite ongoing productivity gains and cost savings, a significant fraction of current world oil production cannot be sustained at current prices.
… and then when the supply falls, the prices will increase and the extraction from shale will be profitable leading to an increased supply until supply, demand, and prices become more stable… I didn’t say stabilize because that never happens.
Bakken is set for around 25% drop in production based off of operators guidance and CAPEX. Unlike last year when all operators were planning on keeping production flat. This year, no one is completing wells, most have said they will start back up around $45/BBL. Cost to produce is $25/BBL in nodak. Therefore, even at current prices they are only netting about $12/BBL, which will have to eventually pay off a $7.5 million well (or hopefully will because it is impossible it will). I assume this is similar in other areas. Also, keep in mind many of those earnings for operators included non-cash write-downs of their assets. For example, by some act of god (and or accounting fraud) CLR did not have to writedown any of its assets, which is why they “look” much better than everyone else but in reality are not.
I can see sunk costs – debt raised in the past for wells now depleted leading to red ink and Chapter 7 (who’d chance financing Chapter 11?). But the threshold for drilling to be profitable suggests there should be no new drilling. I assume the reported average hides a large variance, and perhaps the question asked respondents to choose a range rather than provide a number. Teaching plus meetings plus papers to grade, so no time today to look at the FRB KC study.
mike smitka autosandeconomics.blogspot.com
I would note the increasing pace of decline for the Bakken curves (third graph from the top).
Note that the initial production (IP) rate increases, but so does the pace of decline. By month 12, 2012 wells were producing less per month (although not cumulatively) than 2009 wells. And note that by month 36. 2012 are producing no more than 2007 wells.
Wells from the 2015 vintage are likely to be producing less than 2009 vintage wells by month 14 or so.
From this, we can conclude that enhanced completion techniques like slickwater fracs and boosted sand completions are, in effect, doing a better job of emptying the formation faster, rather than increasing EURs. Now, the advantage gained in the first 12 months of production or so appears to sustain. Thus, after year 1 or year 5, a 2015 well will have produced say, 20,000 bbls more than a 2009 vintage–with all of that differential gained in the first year of production.
So, that incremental 3-7 million pounds of sand and 3-6 million gallons of water per well are buying about 20,000 barrels of incremental oil.
Is that a productivity improvement? It depends on the cost of sand and water and the price of oil.
“Drillers have also been able to get deep cost discounts from the companies that sell to them as a result of the market bust. ”
Drillers as in service companies? Or Drillers as in exploration and production (e&p) companies?
In some quarters fees for drilling have declined to the point that service companies are having trouble keeping the lights on.
Ordinarily, we would refer to the oil companies like EOG or Pioneer as ‘operators’. The drillers or drilling contractors would be classed as ‘service companies’ and include the likes of Baker Hughes and Schlumberger. There are specialized drilling companies like Helmerich and Payne. Companies like Baker Hughes, Weatherford and Halliburton are known as service companies because they provide a wide array of drilling, completion and production services. For example, they would provide the equipment for pressure pumping–fracking.
This shock/experiment — the 60% decline in oil prices — is a good opportunity to revisit the question of incentives to innovate.
According to standard neoclassical theory, the incentive to innovate does not change as output prices fluctuate. Rent-seeking and behavioural economic models might suggest otherwise. Macro data suggest that output growth and productivity growth are positively correlated.
This is an interesting question in light of the climate change issue and chronic obstructive pulmonary disorder (COPD) epidemic all thought to be driven by growing fossil fuel use. Could high carbon taxes spur innovation?
High taxes spur substitution and non-use. High profits spur innovation. I am not particularly impressed by the rate of shale innovation in the last 12 months or so.
US shale needs to be eliminated completely. It creates environment hazard for few people gain.
If God didn’t want the U.S. to have shale oil, he wouldn’t have created it and he wouldn’t have created the free market either.
Totally disagree with Kopits – in my experience people have always figured out how to do more with less when the business cycle turns, and that seems to be true of oil E&P as well. When times are booming, if anything there’s more room for profligacy….
Do not underestimate the effect on prices of cheap Iranian oil flooding the market.
A boom is in sight in Iran.
As we know supply/demand is always effective related to prices, well, James says so.
I would not.
Interesting article in today’s WSJ.
WSJ: Fund Chief Survives Oil’s Swings
Pierre Andurand’s fund is one of only a few to correctly call oil-price moves since summer 2014 as many peers shut down
http://www.wsj.com/articles/in-oil-a-trader-stands-out-by-surviving-1459834201
Production peaks when (not if) that the production from new wells can no longer offset the declines from existing wells, and a critically important point that a lot of analysts are missing is the huge increase in the volumetric decline from existing US oil production.
In 2008, a reasonable assumption that the rate of decline in existing US Crude + Condensate (C+C) production was about 5%/year, from a production base of 5.0 million bpd, or about 0.25 million bpd per year.
In my opinion, a plausible estimate now is that the rate of decline in existing US C+C production is about 15%/year, from a production base of 9.2 million bpd in January, 2016. This implies that the industry needs to put on line about 1.4 million bpd in new C+C production per year, just to offset declines from existing wells–almost a six fold increase from the 2008 estimated volumetric decline.