Here I review key trends in the oil market over the last decade.

World field production of crude oil, in thousands of barrels per day, monthly Jan 1973 to Nov 2015. Excludes natural gas liquids, biofuels, and refinery processing gain. Blue line segment connects June 2005 and June 2013. Data source: EIA Monthly Energy Review, Table 11.1b.
World oil production barely increased between 2005 and 2013. Yet this was a period when oil consumption from the emerging economies was growing rapidly. For example, Chinese imports of crude oil grew by a million barrels a day between 2005 and 2008 and increased by another two million barrels a day between 2008 and 2013.
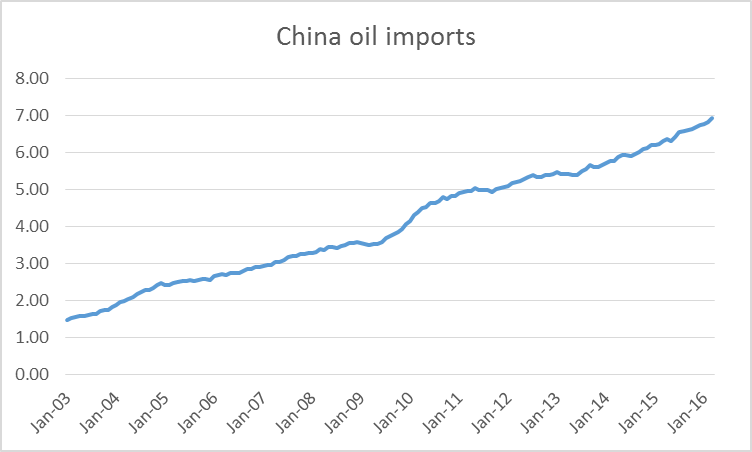
Chinese oil imports in millions of barrels a day, average over the previous 12 months, Jan 2003 to March 2016. Data source: JODI.
How could China realize such a big increase in consumption when very little additional oil was being produced worldwide? The answer is that consumption in places like the United States, Europe, and Japan had to fall. The primary factor that persuaded people in those countries to use less was the high average price of oil over 2007-2013.
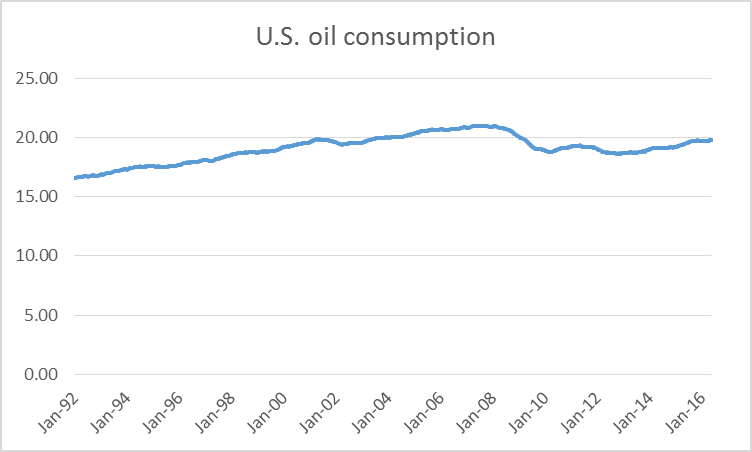
U.S. product supplied of petroleum products in millions of barrels per day, average over the previous 52 weeks, Jan 3, 1992 to May 20, 2016. Data source: EIA.
But in the last few years global oil production broke away dramatically from that decade-long plateau. In 2013-2014 the key factor was surging production from U.S. shale formations. That peaked and began to decline in 2015. But world production continued to grow during 2015 thanks to tremendous increases from Iraq. And increases in 2016 may come from new Iranian production now that sanctions have been lifted.

Iraqi field production of crude oil, in thousands of barrels per day, monthly Jan 1973 to Nov 2015. Data source: EIA Monthly Energy Review, Table 11.1a.
The new supplies from the U.S., Iraq, and Iran brought prices down dramatically. And in response, demand has been climbing back up. U.S. consumption over the last 12 months was 800,000 b/d higher than in 2013, a 4% increase. Vehicle miles traveled in the U.S. are up 6% over the last two years.
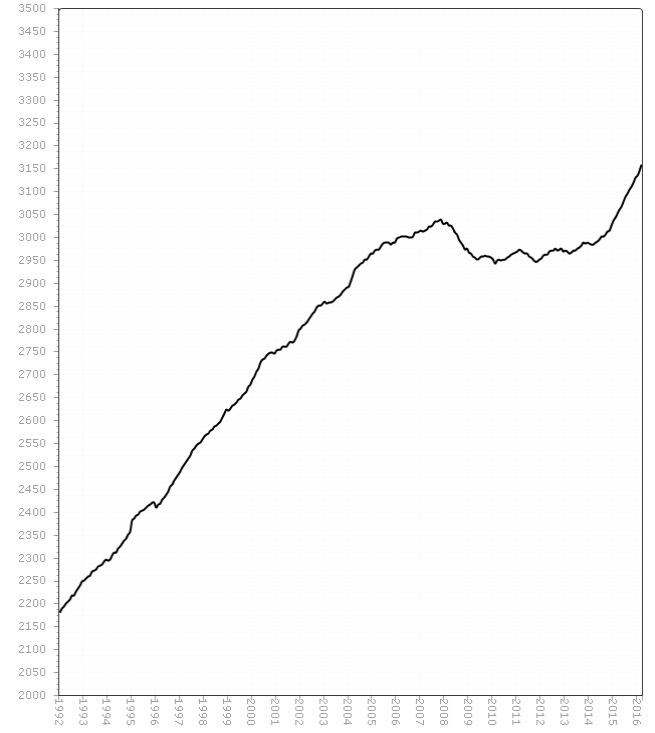
Average monthly U.S. vehicle distance traveled over the 12 months ended at each indicated date, in billions of miles, Jan 1992 to March 2016. Source: Federal Highway Administration.
Average fuel economy of new vehicles sold in the United States is no longer improving.
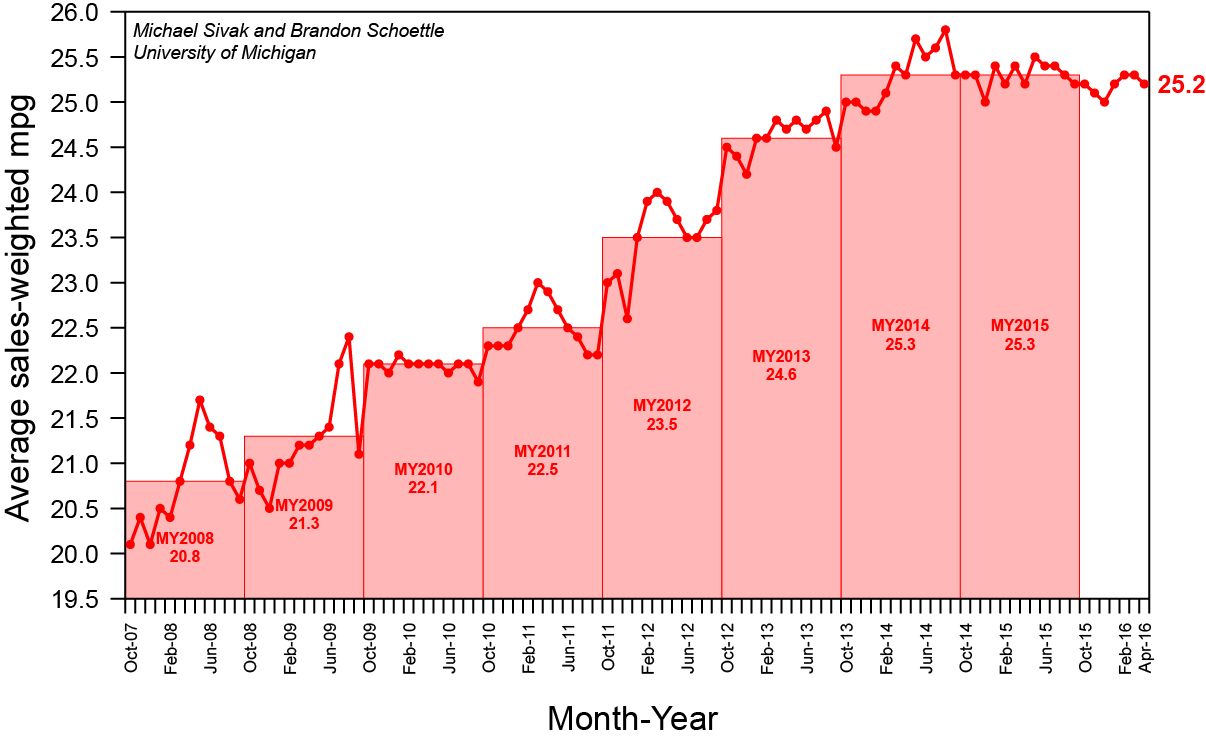
Average miles per gallon of new U.S. vehicles sold. Source: University of Michigan Transportation Research Institute.
Low prices are increasing demand and will also dramatically reduce supply. The EIA is estimating that U.S. production from shale formations is down almost a million barrels a day from last year.
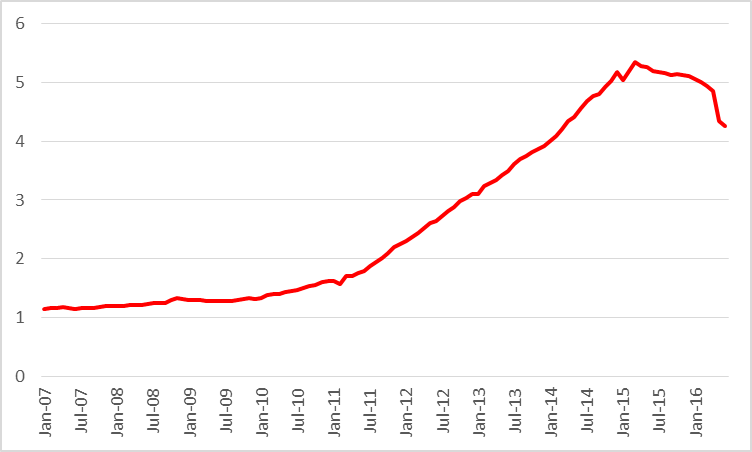
Actual or expected average daily production (in million barrels per day) from counties associated with the Permian, Eagle Ford, Bakken, and Niobrara plays, monthly Jan 2007 to June 2016. Data source: EIA Drilling Productivity Report.
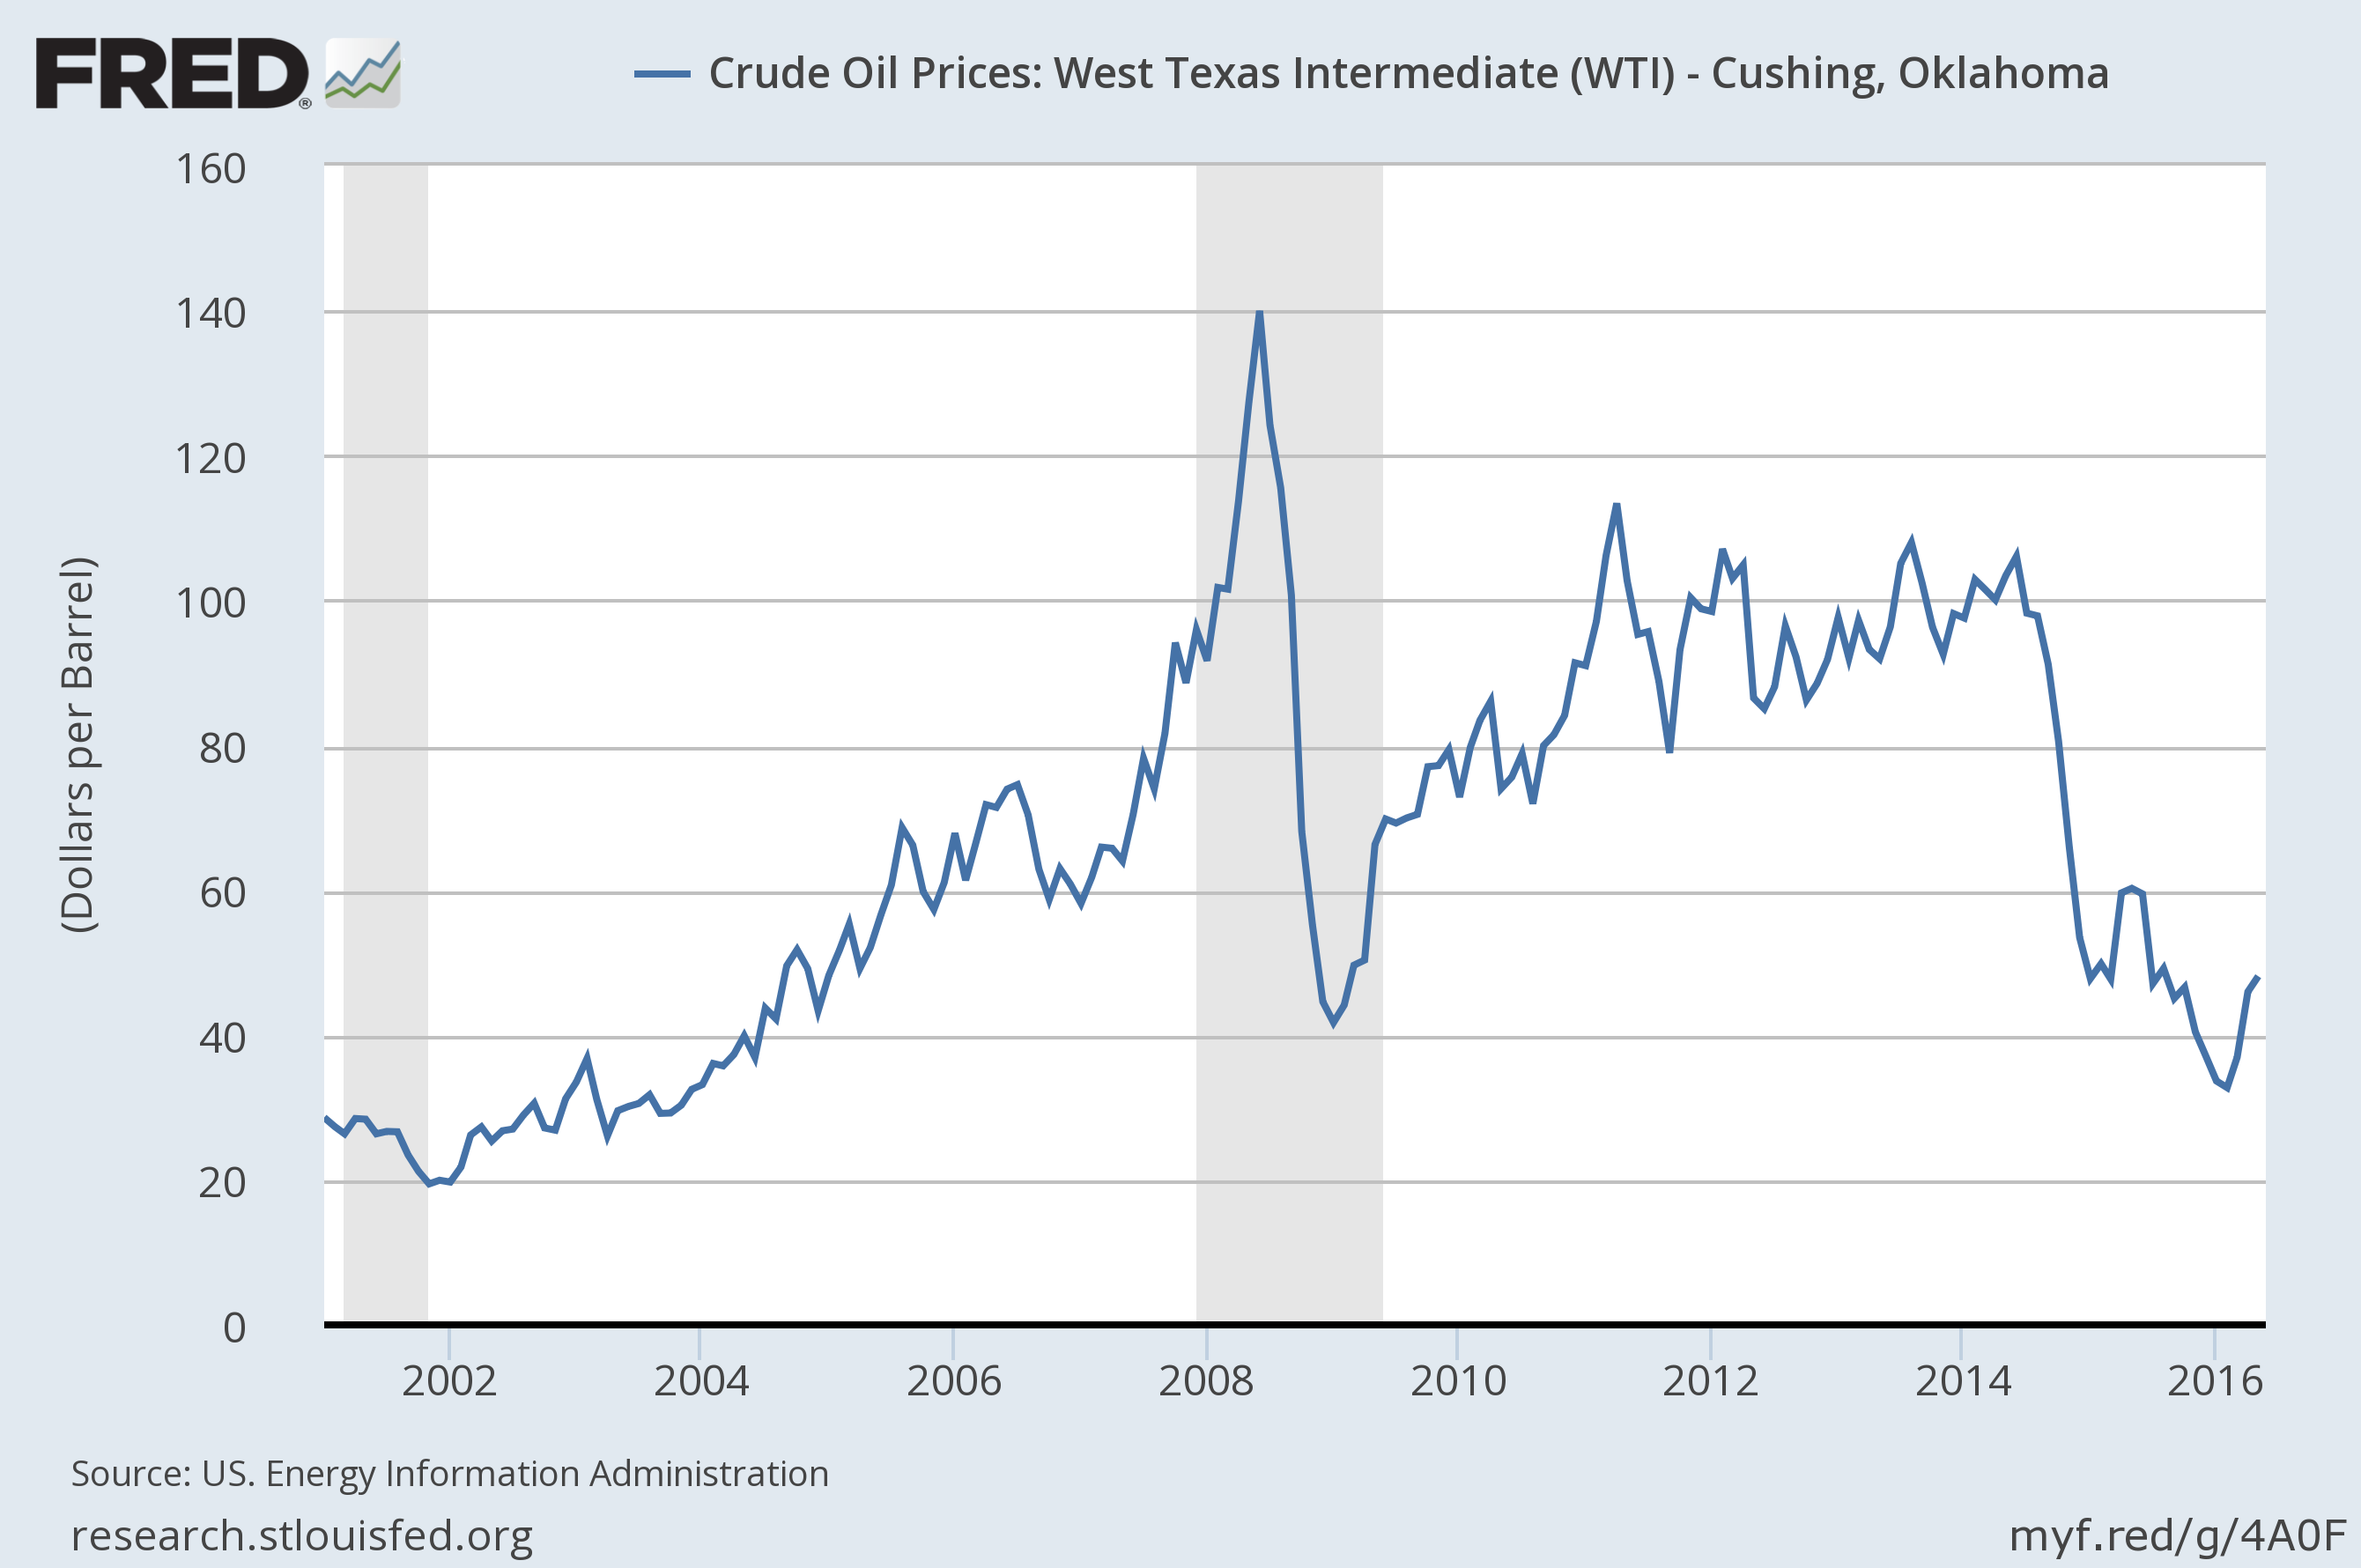
These factors all contributed to a rebound in the price of oil, which traded below $30/barrel at the start of this year but is now back close to $50.
Nevertheless, I doubt that $50 is high enough to reverse the decline in U.S. shale production. Nor is the slashing that we’ve seen in longer-term oil-producing projects about to be undone. And while there is enough geopolitical stability at the moment in places like Iraq and Iran to sustain significantly higher levels of production than we saw in 2013, there is no shortage of news elsewhere in the world that could develop into important new disruptions. For example, conflict in Nigeria may cut that country’s oil production by a million barrels a day.
Adding a million barrels/day to U.S. oil demand and subtracting 2 million b/d from U.S. and Nigerian supply would seem to go a long way toward erasing that glut in oil supply that we’ve been hearing about.
The article should also account for the speculation that impacted prices as institutional investors, producers, consumers and the speculators embarked on hedging oil prices that led to some bizarre consequences. As these hedges expire, the futures market is yet again getting into new windows of opportunity for all of these four constituencies. Large consumers of oil like the airlines industry and the producers of oil hold the two opposite poles of the hedges, while the other two act as long term and short term investors in the game. This would have completed the otherwise deeply data driven article to its fruition.
Do not disappoint our Chicago-school supply/demand friend James !
(factually you are right of course, the oil market is heavily rigged.)
The interesting question is, what is driving the oil price at any given moment in time? It’s not always the same thing. From July last year until, say, a few weeks ago, spot was driving futures prices. Ordinarily, the medium term futures prices (say, 18-24 months out) should represent some notion of marginal cost, with oil prices tending to return to that level over time. The spot price would in turn be determined by the futures prices less the cost of storage and capital, in the case of onshore storage, perhaps $0.50 per month. Therefore, if we thought $65 was marginal cost, then the spot price should be about $12 less, so figure $50-55.
However, this notion disintegrated last summer, because investors lost confidence in both marginal cost and the time necessary to achieve it (ie, how long it would take the market to clear). Further, supply-demand data was so unreliable (and remains so today), that market participants could not determine the actual state of play. How big was that oil supply glut? To this day, we’re really not sure.
Without data and confidence in the clearing interval. investors turned instead to the spot price for guidance. We can know with some certainty what oil traded for today. The futures prices thus became the spot price plus the cost of storage.
But what determines the spot price in a glut? This price may be highly susceptible to news and sentiment. And I think it was, particularly sentiment related to China. Now, if you’re using a fundamentals (ie, marginal cost-based) model, then the last year has been all but unintelligible. So the model you use has to change with prevailing market conditions. Prices are not always determined by the same driver, or to quote Scott Sumner, never reason from a price change.
I wonder to what extent did ethanol and other biofuels made up for flat oil production in the 2005-2013 period.
I seem to recall an opinion from Francisco Blanch at Bank of America Merrill Lynch that oil would have to reach US$60/bbl before new wells were drilled in the USA. I tend to think that volatility will keep capital backers over in the cautious camp even if oil does temporarily lurch north of US$60/bbl.
These recent supply interruptions, including the wild fire in the Fort McMurray area of northern Alberta were all unanticipated for the most part. Except Nigeria and Venezuela perhaps. Those two poster children for the Resource Curse were expected to fall apart at some point though getting the exact timing is always tough.
Northern Alberta heavy oil production will recover quickly. Nigeria and Venezuela?
Incidentally, oil consumption is growing again in Mexico. See John Kemp’s article at reuters.com.
Thx. for all the informations. Great work 😉
The EIA tracks two type of net US oil imports: (1) Net crude oil imports, which is the net volume of crude oil that US refiners import in order to supply their refineries with the mix of Crude + Condensate (C+C) that they need and (2) Net total liquids imports, which are basically gross exports less gross imports, inclusive of total liquids production, including biofuels and refinery gains.
Both EIA metrics showed increasing US annual net oil imports from 2002 to 2005, and declining US annual net oil imports from 2005 to 2015. However, US net imports have shown a large year over year increase. Based on year to date weekly supply data through 5/20/16, US net crude oil imports increased from 6.8 million bpd last year to 7.4 million bpd this year (versus same time period last year). Net total liquids imports increased from 5.2 million bpd last year to 5.6 million bpd this year.
Note that this is the first time since the 2002 to 2005 time period that both the US and the Chindia region are showing increasing net oil imports. Circa 2002 to 2005, annual Brent crude oil prices approximately doubled from $25 in 2002 to $55 in 2005, a rate of increase of 26%/year. It’s important to remember that what I call Global Net Exports of oil (GNE*) increased strongly from 2002 to 2005, but the available data suggest that GNE have been below the 2005 rate for probably 10 straight years, through 2015.
So, the last time that the Chindia region + the US showed increasing net oil imports, annual Brent crude oil prices increased at 26%/year from 2002 to 2005–versus an increasing supply of GNE.
But this time the Chindia region + the US are showing increasing net oil imports–versus an almost certain ongoing post-2005 decline in GNE.
And again, when analysts discuss “Crude oil,” they generally mean Crude + Condensate (C+C), and in my opinion, we are probably in the early stages of a very sharp decline in actual global crude oil production (45 API Gravity and lower crude oil)–my premise being that only trillions of dollars in post-2005 upstream global capex has heretofore staved off a collapse in actual global crude oil production, and that very upstream global capex is now collapsing (see link below).
Incidentally, gross US C+C exports have declined year over year, down from 0.5 million bpd last year to 0.4 million bpd this year (year to date data comparisons), even as US export restrictions were eliminated. I suspect that US shale players have borrowed billions of dollars in order to build up a huge surplus of a commodity for which there is little incremental demand, to-wit, condensate.
*Combined net exports from (2005) Top 33 net exporters (total petroleum liquids + other liquids production less total liquids consumption, EIA)
Estimates Of Post-2005 US, OPEC & Global Condensate Production Vs. Actual Crude Oil Production
http://oilpro.com/post/22276/estimates-post-2005-us-opec-global-condensate-production-vs-actua
Net Exports Summary:
http://peakoilbarrel.com/texas-oil-production-still-on-a-plateau/#comment-561436
Re: Rates of decline in US Oil & Gas Production
In regard to the volumetric decline from existing wells, US operators are facing two challenges, even apart from the economic issues: (1) As production increases, the volumetric decline from existing wells increases (at a given decline rate) and (2) as the percentage of total production that comes from high decline rate tight/shale plays increases, the rate of decline from existing wells increases.
For example, US Crude + Condensate (C+C) production averaged 5.0 million bpd in 2008 and 9.4 million bpd in 2015.
If we assume a 5%/year rate of decline from existing wells in 2008, US operators only needed to add 0.25 million bpd of new production in 2009 to offset declines from existing wells.
If we assume a 15%/year rate of decline from existing wells in 2015, US operators would need to add 1.4 million bpd of new production in 2016 to offset declines from existing wells, which is clearly not happening.
The math is similar for both oil and gas, although the rate of decline from existing wells appears to be higher for gas. I frequently cite a Citi Research estimate that the rate of decline in existing US gas production is about 24%/year. As support of this estimate, Louisiana’s net rate of decline in marketed gas production from 2012 to 2014 was 20%/year (this was the net rate of decline, after new wells were added; of course, the decline followed the collapse in the Haynesville Shale Gas Play rig count).
In any case, a reasonable estimate is that the US currently needs about 17 BCF/day of new gas production per year, just to offset declines from existing wells. 17 BCF/day matches or exceeds the 2014 dry gas production rate of every country in the world, except for the US & Russia (BP data).
Of course, with continued low rig counts, hyperbolic decline rates will moderate the rates of declines in existing production, but for both oil and gas US operators are facing much higher volumetric rates of decline in existing production–versus what they faced prior to the tight/shale boom.
Following are the monthly marketed gas production numbers for Louisiana for March (from both conventional and tight/shale gas), for 2012 to 2016, along with the year over year net exponential rates of decline in monthly production (of course gross rates of decline from existing wells would be even higher):
3/12: 252 BCF/month
3/13: 219 (14%/year)
3/14: 173 (24%/year)
3/15: 167 (4%/year)
3/16: 154 (8%/year)
Link to a graph showing total Haynesville Shale Gas Play gas production (presumably from both Texas and Louisiana) versus the rig count:
http://i1095.photobucket.com/albums/i475/westexas/Haynesville-rig-count-and-natural-gas-production1_zpsb1n95tiz.jpg
Re: Saudi Arabia
I have a lengthy comment on Saudi Arabia, which can be found at the bottom of the article at the following link:
http://oilpro.com/announcement/3418/saudi-series-part-5-junction-road
I estimate that Saudi net exports (total petroleum liquids + other liquids, EIA) fell from 9.5 million bpd in 2005 to around 8.7 million bpd in 2015, and since all available data indicate that Saudi net exports were below their 2005 net export rate of 9.5 million bpd in the intervening years, Saudi net exports have almost certainly been below their 2005 rate for 10 straight years.
And:
Saudi Aramco CEO (January, 2015): “The math will tell you that our exports are gradually declining.”
http://www.reuters.com/article/2015/01/27/saudi-oil-aramco-idUSL6N0V60Z320150127
And:
A Note on what I call “Cowboy Integration”
In order to get a rough estimate of post-export peak CNE (Cumulative Net Exports) I take the rate of decline in what I call the ECI Ratio (ratio of production to consumption) and then estimate when the ECI Ratio would approach 1.0 and thus zero net exports (production = consumption). I then multiply annual net exports at peak times the number of years to estimated zero net exports, divided by 2 (to get the area under a triangle), and I then subtract annual net exports at peak, to get estimated post-export peak CNE.
The Six Country Case History consists of the major net exporters that hit or approached zero net oil exports from 1980 to 2010 (excluding China)–Indonesia, UK, Egypt, Argentina, Malaysia, Vietnam. Their combined net exports peaked in 1995, but their combined production did not fall below the 1995 rate until the year 2000.
Based on the 1995 to 2002 rate of decline in the Six Country ECI Ratio, they would approach zero net exports around the year 2015. Their annual net exports in 1995 were 1.0 Gb/year. So, estimated post-1995 CNE, based on the initial seven year (1995 to 2002) rate of decline in the ECI Ratio, were as follows:
(1.0 Gb/year X 20 years X 0.5) less 1.0 Gb = 9.0 Gb
Actual Six Country post-1995 CNE were 7.3 Gb, and they hit zero net exports in the year 2007. Note that in only four years (from 1995 to 1999), as the Six Countries showed increasing production, they had already shipped 54% of post-1995 CNE.
If we do a similar exercise for Saudi Arabia, using estimated numbers for 2015, it suggests that post-2005 Saudi CNE will be on the order of about 60 Gb, with 2006 to 2015 inclusive CNE of about 30 Gb, suggesting that Saudi Arabia may have already shipped about 50% of their total post-2005 supply of CNE.
Note that by definition, it’s not whether, but to what degree, that Saudi Arabia has depleted their remaining volume of post-2005 CNE.
A link to a summary of Net Export Math:
http://peakoilbarrel.com/texas-oil-production-still-on-a-plateau/#comment-561436